Crop Performance and Water Productivity of Transplanted Rice as Affected by Seedling Age and Seedling Density under Alternate Wetting and Drying Conditions in Lao PDR

Abstract
:1. Introduction
2. Materials and Methods
2.1. Site Description
2.2. Experimental Setup and Treatment Details
2.3. Seedbed Management
2.4. Water Management in the Main Field
2.5. Fertilizer and Other Cultural Management
2.6. Data Collection and Calculation
2.7. Statistical Analysis
3. Results
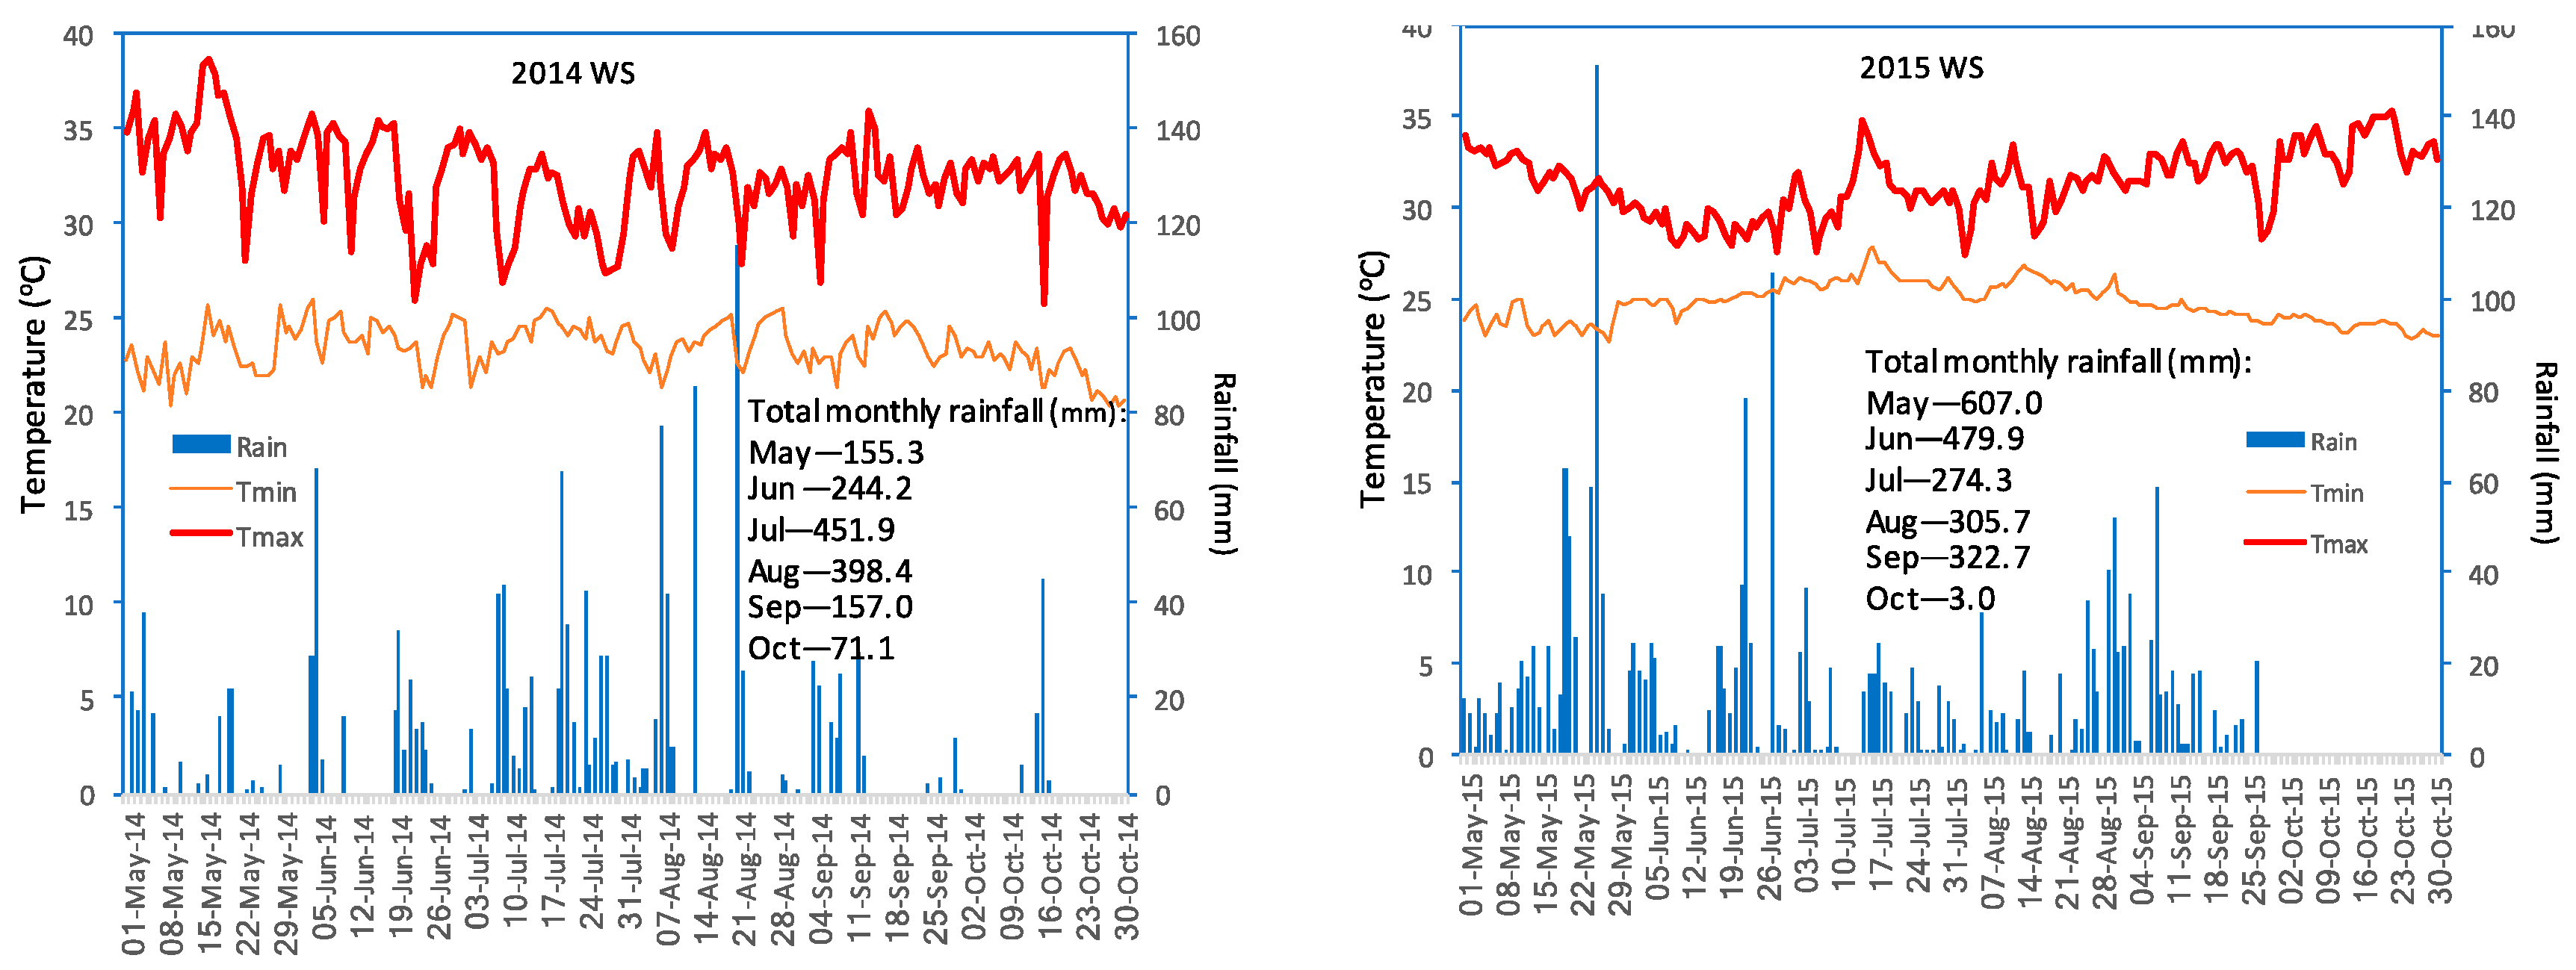
3.1. Weather
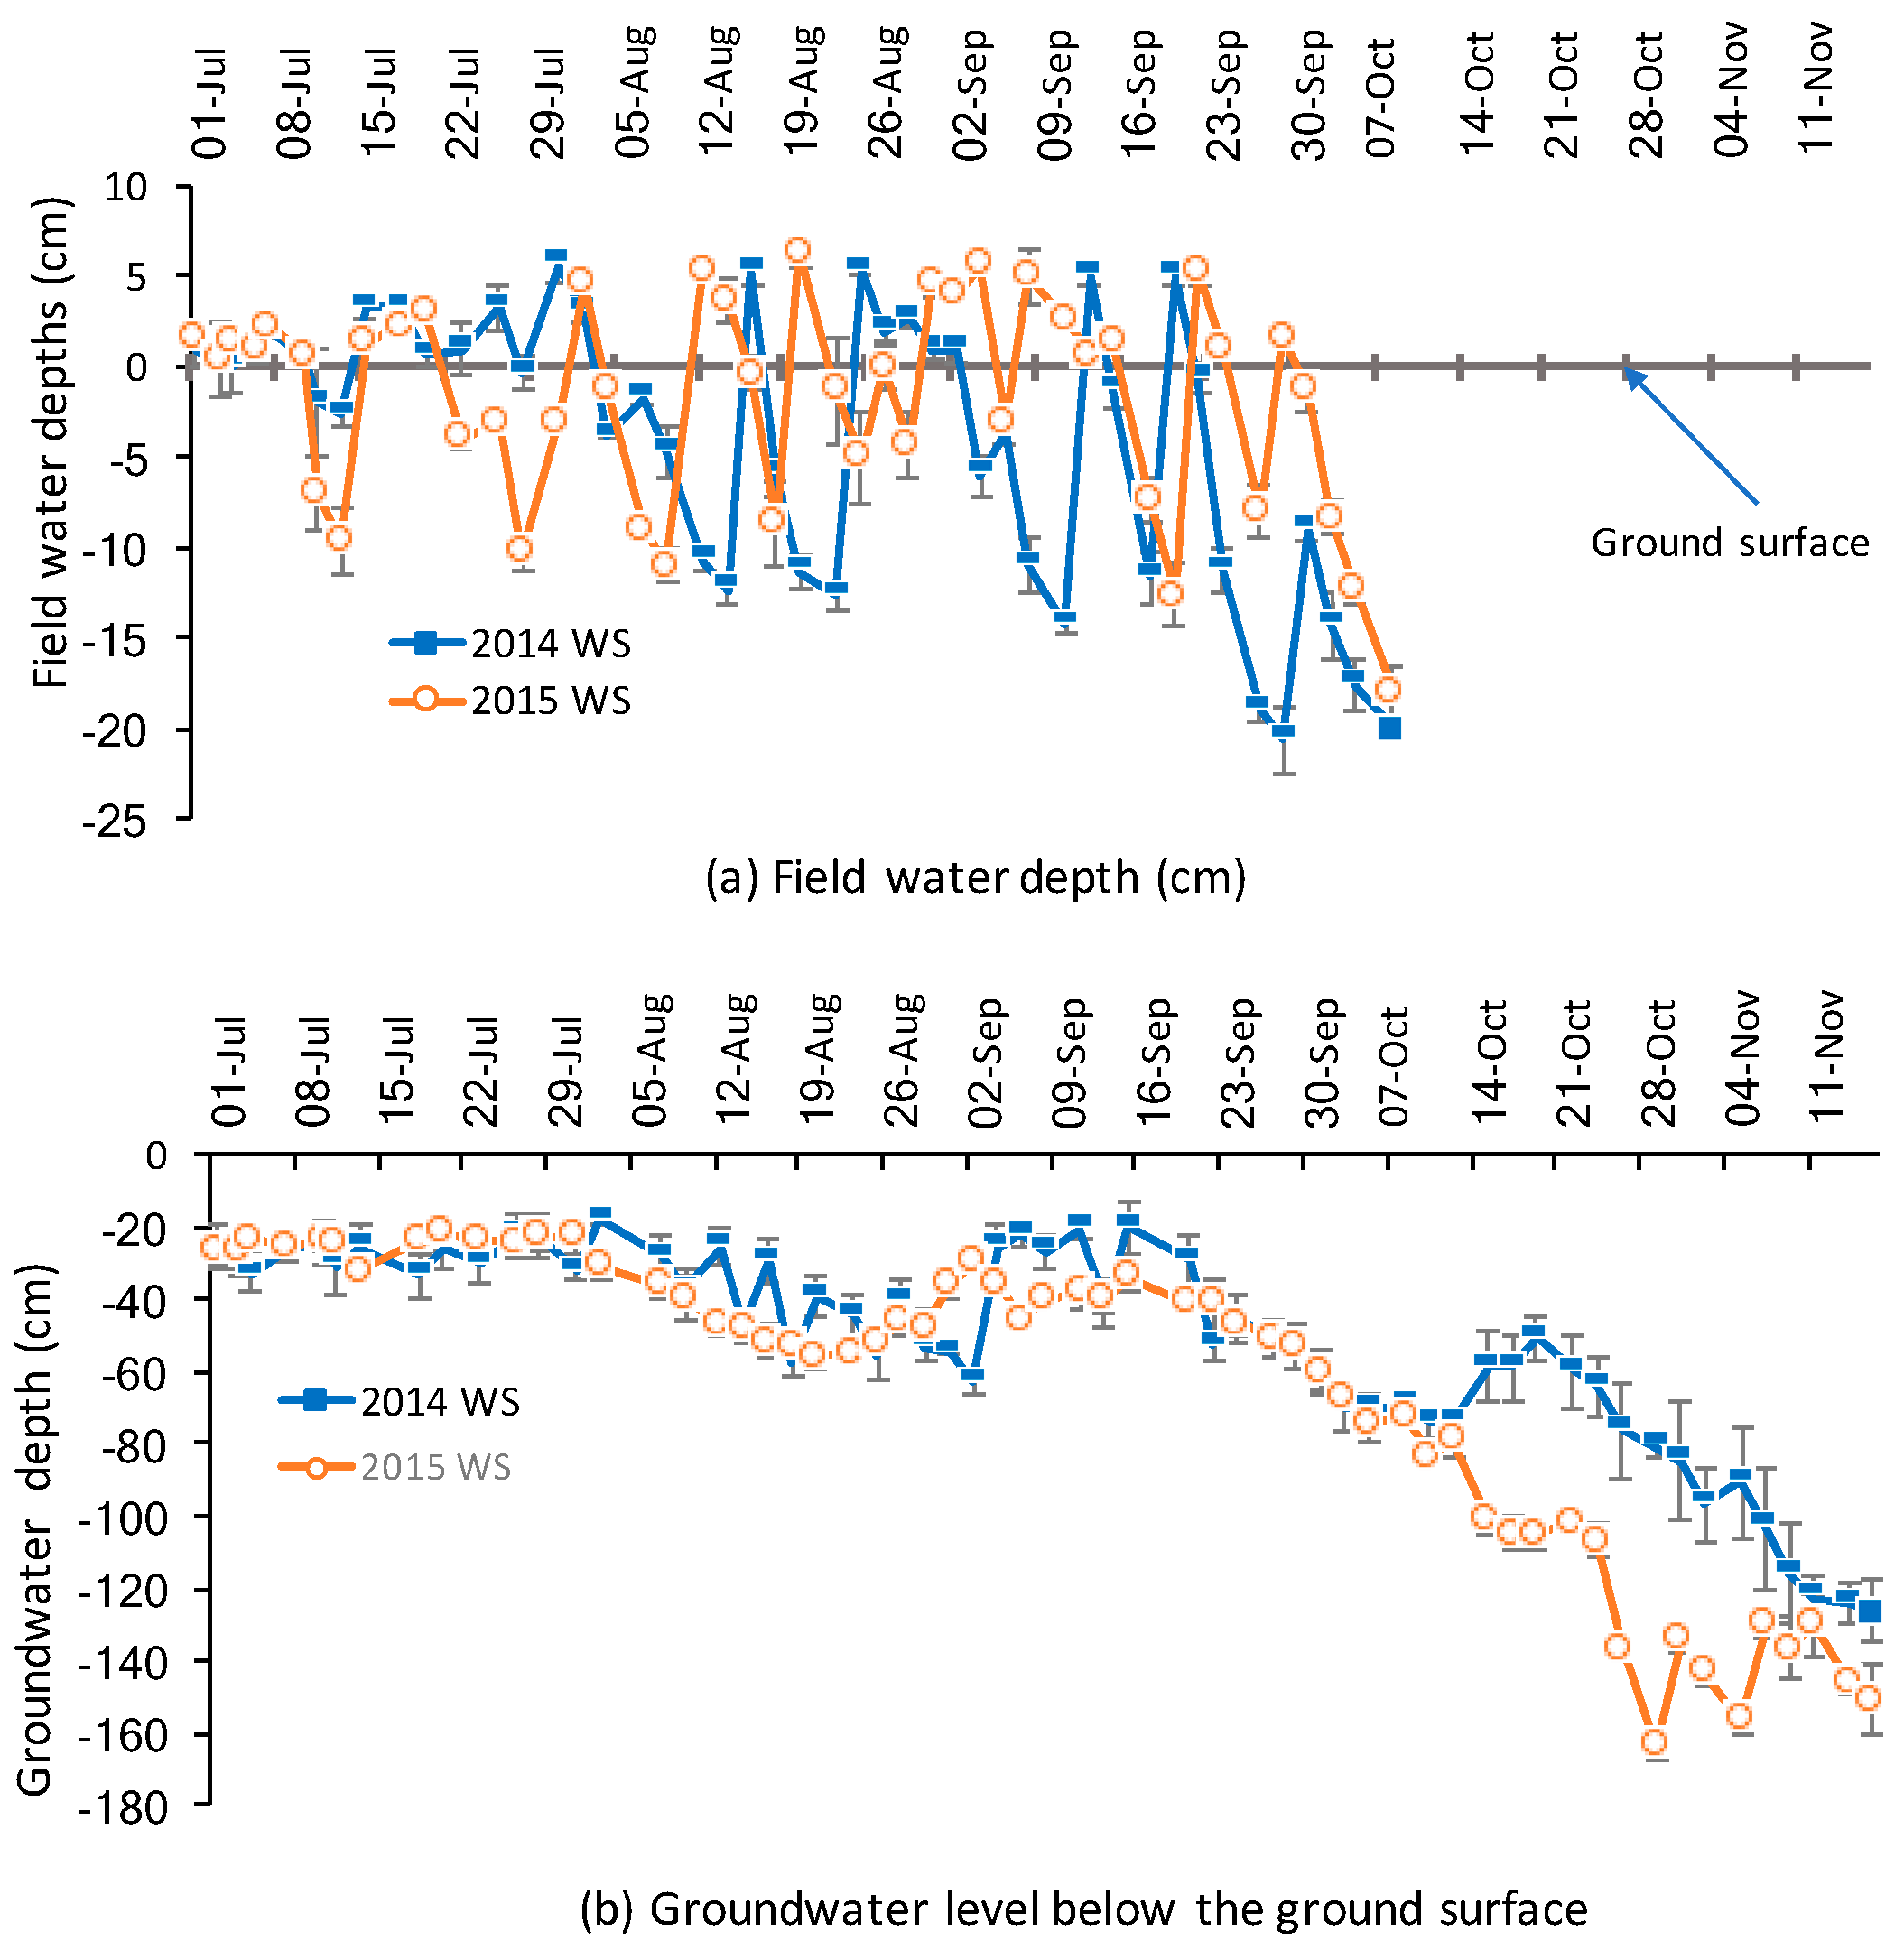
3.2. Hydrological Conditions and Water Level Changes
3.3. Crop Growth and Development
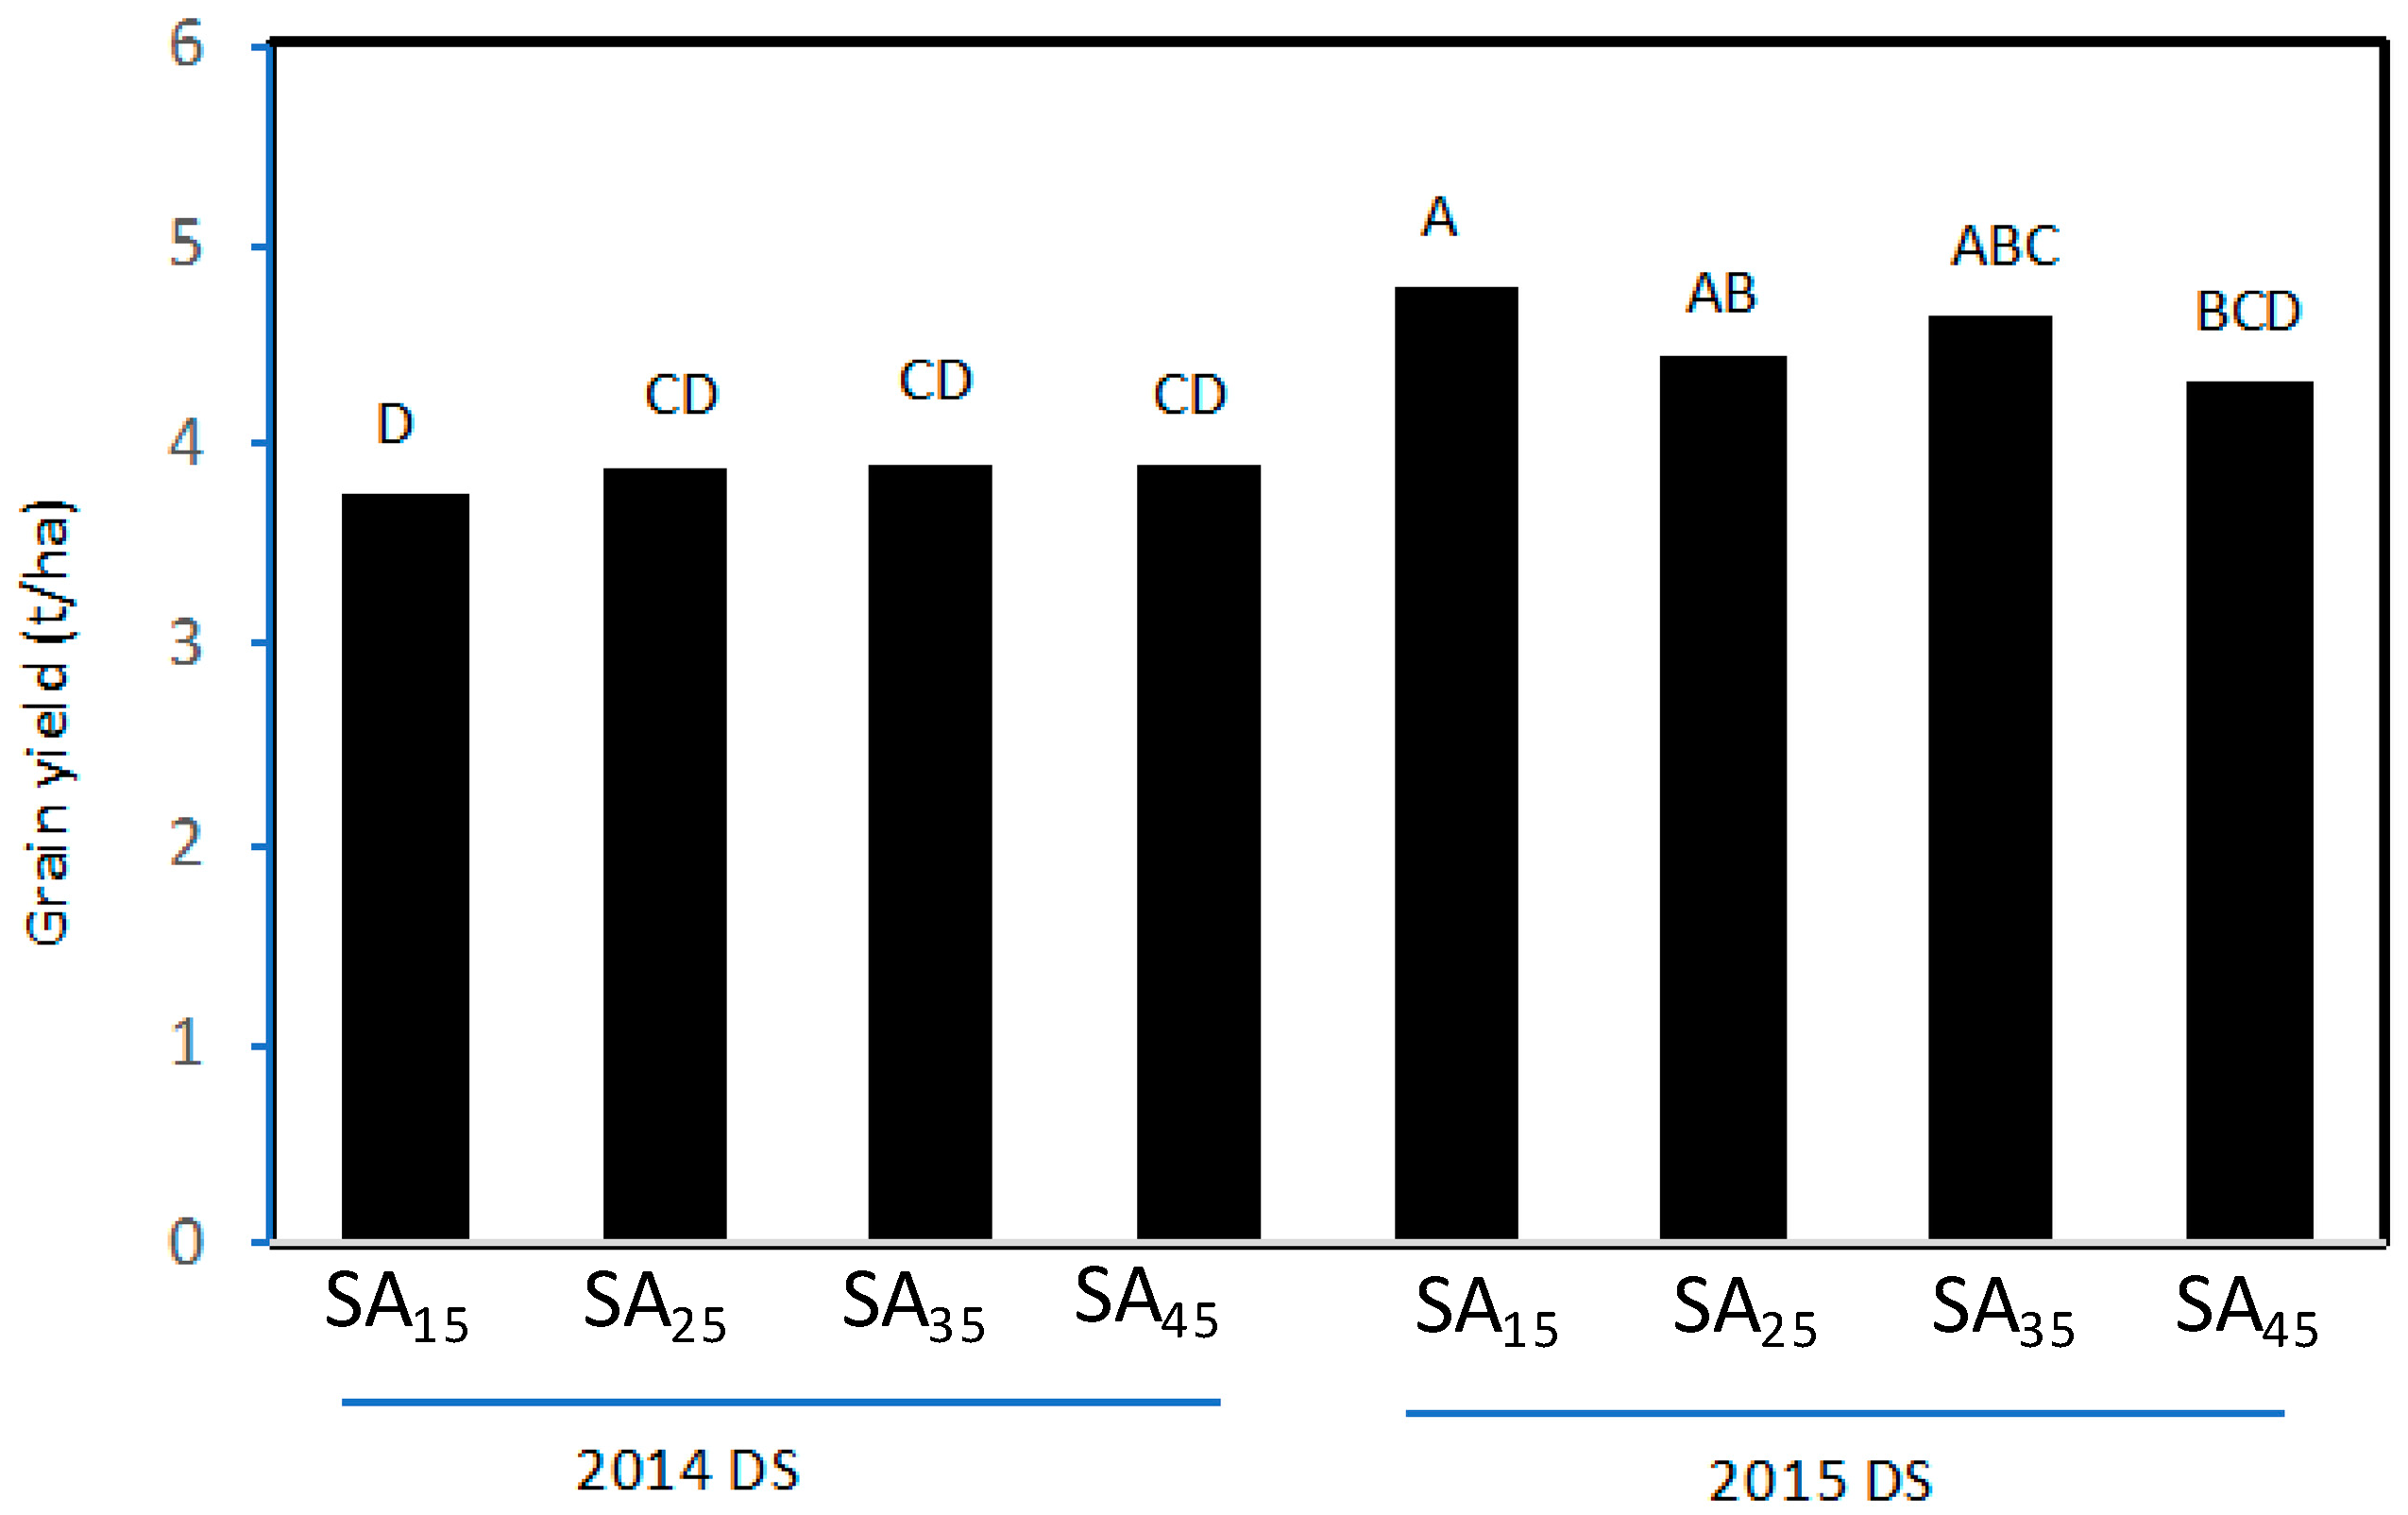
3.4. Grain Yield and Grain Yield Components
3.5. Water Input and Water Productivity
4. Discussion
5. Conclusions
Author Contributions
Funding
Acknowledgments
Conflicts of Interest
References
- Tuong, T.P.; Bouman, B.A.M. Rice production in water scarce environments. In Water Productivity in Agriculture: Limits and Opportunities for Improvement; IKijne, J.W., Barker, R., Molden, D., Eds.; CABI: Wallingford, UK, 2003; pp. 53–56. [Google Scholar]
- Comprehensive Assessment of Water Management in Agriculture. Water for Food, Water for Life: A Comprehensive Assessment of Water Management in Agriculture; Earthscan: London, UK; International Water Management Institute: Colombo, Sri Lanka, 2007; Volume 645, pp. 7–10. [Google Scholar]
- Ramasawamy, S.; Armstrong, J. Lao PDR Trend Food Insecurity Assessment—Lao PDR Expenditure and Consumption Survey (2002/03 and 2007/08 LECS (draft)); European Commission; Lao Statistics Bureau (Lao PDR); FAO: Rome, Italy, 2012.
- Eliste, P.; Santos, N. Lao People’s Democratic Republic Rice Policy Study; World Bank: Washington, DC, USA, 2012. (In English) [Google Scholar]
- Basnayake, J.; Inthavong, T.; Kam, S.P.; Fukai, S.; Schiller, J.M.; Chanphengxay, M. Climatic diversity within rice environments in Laos. In Rice in Laos; Schiller, J.M., Chanphenxay, M.B., Linquist, B., Appa Rao, S., Eds.; International Rice Research Institute: Los Banos, Philippines, 2006; p. 457. [Google Scholar]
- Bouman, B.A.M.; Lampayan, R.M.; Tuong, T.P. Water Management in Irrigated Rice. Coping with Water Scarcity; International Rice Research Institute: Los Banos, Philippines, 2007; p. 53. [Google Scholar]
- Sharma, P.K. Effect of periodic moisture stress on water-sue efficiency in wetland rice. Oryza 1989, 26, 252–257. [Google Scholar]
- Lampayan, R.M.; Rejesus, R.M.; Singleton, G.R.; Bouman, B.A.M. Adoption and economics of alternate wetting and drying water management for irrigated lowland rice. Field Crop. Res. 2015, 170, 95–108. [Google Scholar] [CrossRef]
- Lampayan, R.M.; Inthavong, T.; Somsamay, V.; Quicho, E.; Eberbach, P. Farmer-participatory evaluation of alternate wetting and drying (AWD) water-saving technology in Southern Laos. Lao J. Agric. For. 2014, 30, 121–135. [Google Scholar]
- Paddalia, C.R. Effect of age of seedling on the growth and yield of transplanted rice. Oryza 1980, 18, 165–167. [Google Scholar]
- Bassi, G.; Rang, A.; Joshi, S.P. Effect of seedling age on flowering of cytoplasmic male sterile and restore lines of rice. Int. Rice Res. Notes 1994, 19, 4–8. [Google Scholar]
- Mobasser, H.R.; Tari, D.B.; Muhammad, V.; Ali, E. Effect of seedling age and planting space on yield and yield components of rice (Neda variety). Asian J. Plant Sci. 2007, 6, 438–440. [Google Scholar]
- Liu, W.H.; Zhou, X.; Li, Z.; Xin, C. Effects of seedling age and cultivation density on agronomic characteristics and grain yield of mechanically transplanted rice. Sci. Rep. 2017, 7, 14072. [Google Scholar] [CrossRef] [PubMed]
- Lampayan, R.M.; Faronilo, J.E.; Tuong, T.P.; Espiritu, A.J.; de Dios, J.L.; Bayot, R.S. Effects of seedbed management and delayed transplanting of rice seedlings on crop performance, grain yield, and water productivity. Field Crop. Res. 2015, 183, 303–314. [Google Scholar] [CrossRef]
- Stuart, A.M.; Pame, A.P.; Vithoonjit, D.; Viriyangkura, L.; Pithuncharurnlap, J.; Meesang, N.; Suksiri, P.; Singleton, G.R.; Lampayan, R.M. The application of best management practices increases the profitability and sustainability of rice farming in the central plains of Thailand. Field Crop. Res. 2018, 220, 78–87. [Google Scholar] [CrossRef]
- Gomez, K.A.; Gomez, A.A. Statistical Procedures for Agricultural Research, 2nd ed.; John Wiley and Sons: New York, NY, USA, 1984. [Google Scholar]
- STAR Version 2.0.1. Statistical Tools for Agricultural Research (STAR); Biometrics and Breeding Informatics, PBGB Division, International Rice Research Institute: Los Baños, Philippines, 2014.
- Mishra, A.; Salokhey, V.M. Seedling characteristics and the early growth of transplanted rice under different water regimes. Exp. Agric. 2008, 44, 1–19. [Google Scholar] [CrossRef]
- Li, G.H.; Zhang, Z.; Yang, C.; Liu, Z.; Wang, S.; Ding, Y. Population characteristics of high–yielding rice under different densities. Agron. J. 2016, 108, 1415–1423. [Google Scholar] [CrossRef]
- Huang, M.; Yang, C.; Ji, Q.; Jiang, L.; Tan, J.; Li, Y. Tillering responses of rice to plant density and nitrogen rate in a subtropical environment of southern China. Field Crop. Res. 2013, 149, 187–192. [Google Scholar] [CrossRef]
- Thanunathan, K.; Sivasubramanian, V. Age of seedling and crop management practices for high density (HD) grain rice. Crop. Res. 2002, 24, 421–424. [Google Scholar]
- Mandal, B.K.; Sainik, T.R.; Ray, P.K. Effect of age of seedling and level of nitrogen on the productivity of rice. Oryza 1984, 21, 225–232. [Google Scholar]
- Singh, R.S.; Singh, S.B. Effect of age of seedlings, N–levels and time of application on growth and yield of rice under irrigated condition. Oryza 1999, 36, 351–354. [Google Scholar]
- Kewat, M.L.; Agrawal, S.B.; Agrawal, K.K.; Sharma, R.S. Effect of divergent plant spacings and age of seedlings on yield and economics of hybrid rice (Oryza sativa). Indian J. Agron. 2002, 47, 367–371. [Google Scholar]
- Chandra, D.; Manna, G.B. Effect of planting date, seedling age, and planting density in late planted wet season rice. Int. Rice Res. Notes 1988, 6, 30. [Google Scholar]
- Sarangi, S.K.; Maji, B.; Singh, S.; Burman, D.; Mandal, S.; Sharma, D.K.; Singh, U.S.; Ismail, A.M.; Haefele, S.M. Improved nursery management further enhances the productivity of stress–tolerant rice varieties in coastal rainfed lowlands. Field Crop. Res. 2015, 174, 61–70. [Google Scholar] [CrossRef]


| Soil Property | Mean |
|---|---|
| % clay | 21.0 |
| % silt | 39.0 |
| % sand | 40.0 |
| pH | 6.0 |
| Organic C (%) | 2.3 |
| Total N (%) | 6.9 |
| Available P (mg kg−1) | 28.4 |
| Available K (mg kg−1) | 29.1 |
| CEC (meq 100−1g) | 4.5 |
| 2014 | 2015 | |||||
|---|---|---|---|---|---|---|
| Season/ Treatment | Sowing to PI (d) | Sowing to Harvest (d) | Transplanting to Harvest (d) | Sowing to PI (d) | Sowing to Harvest (d) | Transplanting to Harvest (d) |
| Seedling age | ||||||
| SA15 | 58 d | 117 d | 102 a | 61 d | 119 d | 104 a |
| SA25 | 68 c | 122 c | 97 b | 68 c | 125 c | 100 b |
| SA35 | 73 b | 127 b | 92 c | 79 b | 132 b | 97 c |
| SA45 | 84 a | 134 a | 89 c | 89 a | 139 a | 94 d |
| Seedling density | ||||||
| SD1 | 70 a | 124 a | 94 a | 74 a | 127 a | 97 a |
| SD3 | 72 a | 126 a | 96 a | 74 a | 129 a | 99 a |
| SD5 | 71 a | 126 a | 96 a | 76 a | 130 a | 100 a |
| Variety | ||||||
| V1 | 68 b | 123 b | 93 b | 71 c | 125 c | 95 c |
| V2 | 69 b | 125 b | 95 b | 73 b | 129 b | 99 b |
| V3 | 75 a | 127 a | 97 a | 79 a | 132 a | 102 a |
| ANOVA results | ||||||
| SA | * | * | * | * | * | * |
| SD | ns | ns | ns | ns | ns | ns |
| V | * | * | * | * | * | * |
| SA × SD | ns | ns | ns | ns | ns | ns |
| SA × V | ns | ns | ns | ns | ns | ns |
| SD × V | ns | ns | ns | ns | ns | ns |
| SA × SD × V | ns | ns | ns | ns | ns | ns |
| Treatment | Plant Height (cm) | Tiller Per Hill (no.) | ||
|---|---|---|---|---|
| 2014 | 2015 | 2014 | 2015 | |
| Seedling age | ||||
| SA15 | 55.4 a | 63.1 a | 11.7 a | 15.0 a |
| SA25 | 53.3 a | 63.0 a | 10.5 b | 12.9 b |
| SA35 | 47.0 b | 55.5 b | 10.7 b | 12.7 b |
| SA45 | 38.3 c | 54.2 b | 6.6 c | 9.8 c |
| Seedling density | ||||
| SD1 | 44.7 a | 55.8 a | 6.5 b | 10.5 c |
| SD3 | 49.3 a | 59.3 a | 10.6 a | 12.9 b |
| SD5 | 51.4 a | 62.0 a | 11.9 a | 14.8 a |
| Variety | ||||
| V1 | 41.9 b | 53.2 c | 10.9 a | 14.5 a |
| V2 | 53.3 a | 60.9 b | 9.5 a b | 13.1 b |
| V3 | 50.2 a | 63.0 a | 9.2 a b | 11.7 c |
| Interaction significance | ||||
| SA × SD | ns | ns | ns | ns |
| SA × V | ns | ns | ns | ns |
| SD × V | ns | ns | ns | ns |
| SA × SD × V | ns | ns | ns | ns |
| Season | Treatment | Panicle (no. m−2) | Spikelet (no. panicle−1) | 1000-Grain Weight (g) | Filled Grain (%) | Grain Yield (t ha−1) | Harvest Index (%) |
|---|---|---|---|---|---|---|---|
| 2014 | Seedling Age | ||||||
| SA15 | 180.6 b | 106.2 c | 29.1 a | 79.3 c | 3.7 a | 39 a | |
| SA25 | 192.2 a | 109.0 b | 29.7 a | 82.2 b | 3.9 a | 39 a | |
| SA35 | 180.8 b | 107.6 b c | 29.3 a | 83.9 a | 3.9 a | 36 a | |
| SA45 | 176.2 b | 114.1 a | 28.8 a | 80.5 c | 3.9 a | 42 a | |
| Seedling Density | |||||||
| SD1 | 167.3 c | 120.1 a | 28.9 a | 80.4 a | 3.9 a | 40 a | |
| SD3 | 177.0 b | 107.0 b | 29.2 a | 82.3 a | 3.8 a | 40 a | |
| SD5 | 203.0 a | 100.5 c | 29.5 a | 81.8 a | 3.9 a | 36 a | |
| Variety | |||||||
| V1 | 236.3 a | 97.5 c | 21.2 c | 82.6 a | 3.5 b | 42 a | |
| V2 | 150.1 b | 108.5 b | 36.9 a | 79.4 a | 4.1 a | 38 a | |
| V3 | 161.0 b | 121.6 a | 29.5 b | 82.5 a | 3.9 a | 37 a | |
| Interaction Significance | |||||||
| SA × SD | ns | ns | ns | ns | ns | ns | |
| SA × V | ns | ns | ns | * | ** | ns | |
| SD × V | ns | ns | ns | ns | ns | ns | |
| SA × SD × V | ns | * | ns | ns | ns | ns | |
| 2015 | Seedling age | ||||||
| SA15 | 182.0 a | 108.8 b | 33.1 a | 78.9 a | 4.8 a | 31 a | |
| SA25 | 196.0 a | 114.3 a | 28.9 b | 79.3 a | 4.4 a | 32 a | |
| SA35 | 179.2 a | 104.24 b | 28.8 b | 79.0a | 4.7 a | 32 a | |
| SA45 | 179.0 a | 94.2 c | 28.7 b | 79.4 a | 4.3 a | 32 a | |
| Seedling density | |||||||
| SD1 | 168.3 b | 111.2 a | 31.1 a | 80.0 a | 4.6 a | 35 a | |
| SD3 | 192.8 a | 103.2 b | 29.6 a | 79.9 a | 4.5 a | 31 b | |
| SD5 | 193.0 a | 101.8 b | 29.0 a | 77.6 a | 4.5 a | 30 b | |
| Variety | |||||||
| V1 | 227.2 a | 100.1 a | 22.8 c | 78.4 b | 4.3 b | 35 a | |
| V2 | 161.9 b | 108.7 a | 36.6 a | 75.5 b | 4.7 a | 31 a | |
| V3 | 165.0 b | 107.6 a | 30.3 b | 83.7 a | 4.7 a | 30 a | |
| Interaction significance | |||||||
| SA × SD | ns | ns | ** | ns | ns | ns | |
| SA × V | ns | ns | ns | ns | * | ns | |
| SD × V | ns | ns | ns | ns | ns | ns | |
| SA × SD × V | ns | ns | ns | ns | ns | ns | |
| Seedling Age | Grain Yield (t ha-1) | 1000-Grain Weight (g) | Filled Spikelet (%) | ||||||
|---|---|---|---|---|---|---|---|---|---|
| V1 | V2 | V3 | SD1 | SD3 | SD5 | V1 | V2 | V3 | |
| 2014 | |||||||||
| SA15 | 3.4b C | 3.8b B | 4.1ab A | 78.6b B | 77.0b B | 82.4a A | |||
| SA25 | 3.6ab B | 4.2a A | 3.8bc B | 84.4a A | 78.6b B | 83.7a A | |||
| SA35 | 3.4b B | 4.1a A | 4.2a A | 84.0a A | 83.0a A | 84.9a A | |||
| SA45 | 3.7a B | 4.4a A | 3.7c B | 83.4a A | 78.9b B | 79.0b B | |||
| 2015 | |||||||||
| SA15 | 4.6a B | 4.9a A | 5.0a A | 38.6a A | 31.2a B | 29.4a C | |||
| SA25 | 4.2a B | 4.5a A | 4.6ab A | 28.2b A | 29.2b A | 29.4a A | |||
| SA35 | 4.2a B | 4.9a A | 4.9a A | 28.7b A | 29.0b A | 28.8a A | |||
| SA45 | 4.3a A | 4.4a A | 4.3b A | 28.7b A | 28.9b A | 28.5a A | |||
| Treatment | 2014 | 2015 | ||||
|---|---|---|---|---|---|---|
| Total Irrigation (mm) | Total Rainfall (mm) | Total Water Input (mm) | Total Irrigation (mm) | Total Rainfall (mm) | Total Water Input (mm) | |
| Seedling age | ||||||
| SA15 | 439.3 d | 1009.2 a | 1448.5 a | 317.0 d | 902.8 a | 1219.8 a |
| SA25 | 469.5 c | 944.4 b | 1413.9 b | 456.3 c | 807.0 b | 1263.3 a |
| SA35 | 506.4 b | 886.2 c | 1392.6 b | 522.4 b | 711.1 c | 1233.5 a |
| SA45 | 596.9 a | 647.2 d | 1244.1 c | 577.3 a | 623.7 d | 1201.0 a |
| Seedling density | ||||||
| SD1 | 500.2 a | 876.9 a | 1377.1 a | 501.3 a | 761.2 a | 1262.5 a |
| SD3 | 537.7 a | 875.6 a | 1413.3 a | 488.9 a | 761.2 a | 1250.1 a |
| SD5 | 505.2 | 862.7 a | 1367.9 a | 500.3 a | 761.2 a | 1261.5 a |
| Variety | ||||||
| V1 | 493.3 b | 863.7 b | 1357.0 a | 465.3 b | 759.4 a | 1224.7 a |
| V2 | 505.7 a | 866.5 b | 1372.2 a | 470.3 b | 759.4 a | 1229.7 a |
| V3 | 510.1 a | 884.8 a | 1394.9 a | 524.3 a | 764.7 a | 1289.0 a |
| Interaction significance | ||||||
| SA × SD | ns | ns | ns | ns | ns | ns |
| SA × V | ns | ns | ns | ns | ns | ns |
| SD × V | ns | ns | ns | ns | ns | ns |
| SA × SD × V | ns | ns | ns | ns | ns | ns |
| Season/Seedling Age | Irrigation Water Productivity (WPI) | Total Water Productivity (WPI+R) | ||||
|---|---|---|---|---|---|---|
| V1 | V2 | V3 | V1 | V2 | V3 | |
| 2014 | ||||||
| SA15 | 0.78 b B | 0.89 b A | 0.94 a b A | 0.23 c B | 0.27 b A | 0.29 c A |
| SA25 | 0.84 ab B | 0.96 ab A | 0.89 bc AB | 0.28 b A | 0.30 b A | 0.28 c A |
| SA35 | 0.79 b B | 0.96 ab A | 0.97 a A | 0.24 bc B | 0.30 b A | 0.32 ab A |
| SA45 | 0.87 a B | 1.01 a A | 0.86 c A | 0.33 a B | 0.40 a A | 0.33 a B |
| 2015 | ||||||
| SA15 | 0.89 a B | 0.99 a A | 1.01 a A | 0.32 a A | 0.33 b A | 0.36 a A |
| SA25 | 0.97 a A | 1.01 a A | 0.98 a A | 0.32 a B | 0.36 ab AB | 0.37 a A |
| SA35 | 0.80 a B | 0.92 a A | 0.97 a A | 0.33 a B | 0.40 a A | 0.40 a A |
| SA45 | 0.82 a A | 0.84 a A | 0.82 a A | 0.37 a A | 0.37 a b A | 0.36 a A |
© 2019 by the authors. Licensee MDPI, Basel, Switzerland. This article is an open access article distributed under the terms and conditions of the Creative Commons Attribution (CC BY) license (http://creativecommons.org/licenses/by/4.0/).
Share and Cite
Lampayan, R.; Xangsayasane, P.; Bueno, C. Crop Performance and Water Productivity of Transplanted Rice as Affected by Seedling Age and Seedling Density under Alternate Wetting and Drying Conditions in Lao PDR. Water 2019, 11, 1816. https://doi.org/10.3390/w11091816
Lampayan R, Xangsayasane P, Bueno C. Crop Performance and Water Productivity of Transplanted Rice as Affected by Seedling Age and Seedling Density under Alternate Wetting and Drying Conditions in Lao PDR. Water. 2019; 11(9):1816. https://doi.org/10.3390/w11091816
Chicago/Turabian StyleLampayan, Rubenito, Phetmanyseng Xangsayasane, and Crisanta Bueno. 2019. "Crop Performance and Water Productivity of Transplanted Rice as Affected by Seedling Age and Seedling Density under Alternate Wetting and Drying Conditions in Lao PDR" Water 11, no. 9: 1816. https://doi.org/10.3390/w11091816