Article

Activated Carbon Mixed with Marine Sediment is Suitable as Bioanode Material for Spartina anglica Sediment/Plant Microbial Fuel Cell: Plant Growth, Electricity Generation, and Spatial Microbial Community Diversity

by
Emilius Sudirjo
1,2,*,
Cees J.N. Buisman
1 and
David P.B.T.B. Strik
1,*
1
Environmental Technology, Wageningen University & Research, Bornse Weilanden 9, 6708WG Wageningen, The Netherlands
2
Government of Landak Regency, West Kalimantan Province 79357, Indonesia
*
Authors to whom correspondence should be addressed.
Water 2019, 11(9), 1810; https://doi.org/10.3390/w11091810
Submission received: 1 August 2019 / Revised: 16 August 2019 / Accepted: 17 August 2019 / Published: 30 August 2019
(This article belongs to the Section Wastewater Treatment and Reuse)

Abstract

:
Wetlands cover a significant part of the world’s land surface area. Wetlands are permanently or temporarily inundated with water and rich in nutrients. Therefore, wetlands equipped with Plant-Microbial Fuel Cells (Plant-MFC) can provide a new source of electricity by converting organic matter with the help of electrochemically active bacteria. In addition, sediments provide a source of electron donors to generate electricity from available (organic) matters. Eight lab-wetlands systems in the shape of flat-plate Plant-MFC were constructed. Here, four wetland compositions with activated carbon and/or marine sediment functioning as anodes were investigated for their suitability as a bioanode in a Plant-MFC system. Results show that Spartina anglica grew in all of the plant-MFCs, although the growth was less fertile in the 100% activated carbon (AC100) Plant-MFC. Based on long-term performance (2 weeks) under 1000 ohm external load, the 33% activated carbon (AC33) Plant-MFC outperformed the other plant-MFCs in terms of current density (16.1 mA/m2 plant growth area) and power density (1.04 mW/m2 plant growth area). Results also show a high diversity of microbial communities dominated by Proteobacteria with 42.5–69.7% relative abundance. Principal Coordinates Analysis shows clear different bacterial communities between 100% marine sediment (MS100) Plant-MFC and AC33 Plant-MFC. This result indicates that the bacterial communities were affected by the anode composition. In addition, small worms (Annelida phylum) were found to live around the plant roots within the anode of the wetland with MS100. These findings show that the mixture of activated carbon and marine sediment are suitable material for bioanodes and could be useful for the application of Plant-MFC in a real wetland. Moreover, the usage of activated carbon could provide an additional function like wetland remediation or restoration, and even coastal protection.

1. Introduction

Wetlands have been known as one of the world’s most important type of ecosystems, which play a critical role in climate change, biodiversity, hydrology, and human health [1]. For instance, wetlands provide a range of ecosystem services including fresh water; nutrient cycling; food and fiber production; carbon fixation and storage; flood mitigation and water storage; water treatment and purification; and habitats for biodiversity. About 5–10% of the world’s land surface is covered by wetlands [2]. A recent study reported that the global wetland area is between 15 and 16 million km2, in which about 8.9–9.5% is coastal wetlands [3]. Unfortunately, despite their critical role wetlands are facing a serious problem of losses caused by human activities. A study has shown that at least 33% of global wetlands had been lost as of 2009 due to human activities [1]. This loss was comparable to a previous study reporting that between 1970 and 2008, natural wetland declined globally by about 30% [4].
Sediment pollution by human activities is a major problem for wetland ecosystems [5]. By nature, wetland sediments are able to remedy themselves from pollutants, such as petroleum hydrocarbon pollutants, due to the presence of diverse microbial communities [6]. However, in some cases such as to control hydrophobic organic compounds (HOCs), an in-situ amendment by human interference is applied for sediment remediation by e.g., addition of activated carbon (AC), which is most widely used for in-situ sediment sequestration and immobilization [7]. The capability of AC to adsorb organic compounds is controlled either by physical interaction or by chemical interaction between AC surface area and absorbents. The adsorption rate is influenced by molecular size of the organic compounds and distribution of the AC pores [8,9]. The activated carbon materials have three types of pores: micropores (<2 nm), mesopores (2–50 nm), and macropores (>50 nm). The surface area of AC is determined by the presence and distribution of these pores [10]. In-situ sediment treatment using activated carbon (AC) has been demonstrated in full-scale projects, up to 100 ha of application area. In-situ treatment of sediment HOCs using sorptive AC-bearing materials has progressed from an innovative sediment remediation approach to a proven reliable technology [7].
Sediments are also new sources for generating electricity with a so called sediment microbial fuel cell [11]. Hereby the anode of the fuel cell is driven by oxidation of sediment sulfide (a side-product of microbial oxidation of sedimentary organic matters) and oxidation of sedimentary organic carbon converted by electrochemically active microorganisms. The in-situ AC amendment in sediment could be coupled with sediment microbial fuel cell installation for concurrent production of renewable energy and bioremediation of pollutants such as heavy metals and HOC’s. Various sediments both in marine and fresh water environments are suited to generating electricity [12]. Even living plants could be included in such systems, providing additional services as known for the so-called Plant-Microbial Fuel Cells (Plant-MFC).
Actually, wetlands inhabited with the Plant-MFC can provide a new (additional) source of bioelectricity and have the potential to reduce eutrophication and promote plant growth [13,14]. The Plant-MFC is envisioned as a sustainable in-situ bioelectricity source which can avoid competition between food and energy production [15], e.g., Plant-MFC could be combined with rice paddy production [16,17,18,19]. Plant-MFC converts solar energy into bioelectricity via plant rhizo deposits and electrochemically active bacteria (EAB) [15,20]. Several studies have been conducted to increase Plant-MFC performance such as investigating optimum anode position under soil [18], modifying plant growth medium [21], characterizing internal resistance [22], comparing power output from different sediment types [23], designing new reactors [24,25,26], studying plant and microbe cooperation [17], and developing and investigating various electrode materials [18,20,26,27]. The highest 2 weeks average power density of 240 mW/m2 plant growth area was achieved in a Plant-MFC when integrated with an oxygen reducing biocathode [28]. For large scale application, Plant-MFC is potentially integrated in wetlands by which various functions could be combined including electricity generation, sediment remediation, plant growth support, and as protection of coastal areas [23,29].
Plant-MFCs were embedded with vascular plants, macrophytes, and bryophytes as well as their combination with sediments, natural and constructed wetlands. From a recent review paper, at least 40 plant species have been utilized in the Plant-MFC system [30]. Among those species, Spartina anglica is one of the most model species [20,21,25,28,31,32]. S. anglica is known as an invasive species that has sustained more than a century of evolution. It can tolerate a wide range of environmental conditions and grows on a variety of substrates, including clays, fine silts, organic mud, sands, and shingle. As a result, S. anglica can occupy the seaward edge of salt marshes [33,34]. There are several economic and societal effects of S. anglica. It has potential for coastal protection because it can absorb wave energy. It has also been planted for estuary reclamation [33]. In an upper tidal zone wetland, S. anglica grows as a pioneer plant [35]. S. anglica is also used as a green manure in China in which 50 kg of S. anglica biomass is approximately equivalent to 0.5 kg of urea [35].
In a long term real application, one of the challenges for Plant-MFC technology is simultaneously harvesting maximum power, remaining plant vitality, and preventing electrode material from deteriorating over time [36]. Research has shown that the long term power output of a S. anglica Plant-MFC was fluctuating while the plant was growing [32]. Several anode materials have been used in the Plant-MFCs to produce electricity. Among them were graphite granule and tezontle (a volcanic slag) [37], graphite felt/mat [15,17,24,25,27,28], graphite granule/grain [20,38,39], carbon fiber [40], nano-catalyzed graphite disc, rolled steel mesh with graphite fiber [41], and stainless steel mesh with biochar [42].
Although many studies about the anode materials for a Plant-MFC have been conducted, to our best knowledge, there is no study yet using activated carbon (AC) in the Plant-MFCs while studying the effect of marine sediment. It is well known that the activated carbon is a suitable bioanode material for microbial fuel cells fed with acetate [43,44]. Recent work also showed that a mixture of AC and marine sediment is able to store and generate electricity [45]. Activated carbon was chosen in our study because it has the potential to be integrated with soil/wetland amendments; it is a suitable bioanode material that can be mixed with sea-sediment; and it has the ability to support plant growth [46]. Such AC can be produced from an agricultural byproduct like rice husks, rice bran, sugarcane bagasse, walnut shells, and olive stones [47,48] and can also be utilized for soil amendment to increase agricultural production without negatively affecting the soil bacteria community [49,50]. Therefore, the main objective of this study was to investigate the suitability of a mixture of activated carbon and marine sediment as a bioanode in a Plant-MFC system with S. anglica. Here it was studied how different mixtures of the activated carbon (AC) and the marine sediment (MS) as an anode material affected the plant vitality, electricity generation, and spatial microbial community. Overall, the results provide insights that the Plant-MFC anode, consisting of activated carbon and marine sediments, has potential to be tested in a demo-scale wetland to generate electricity and provide additional functions like wetland remediation or restoration, and eventually coastal protection [51,52,53].

2. Materials and Methods

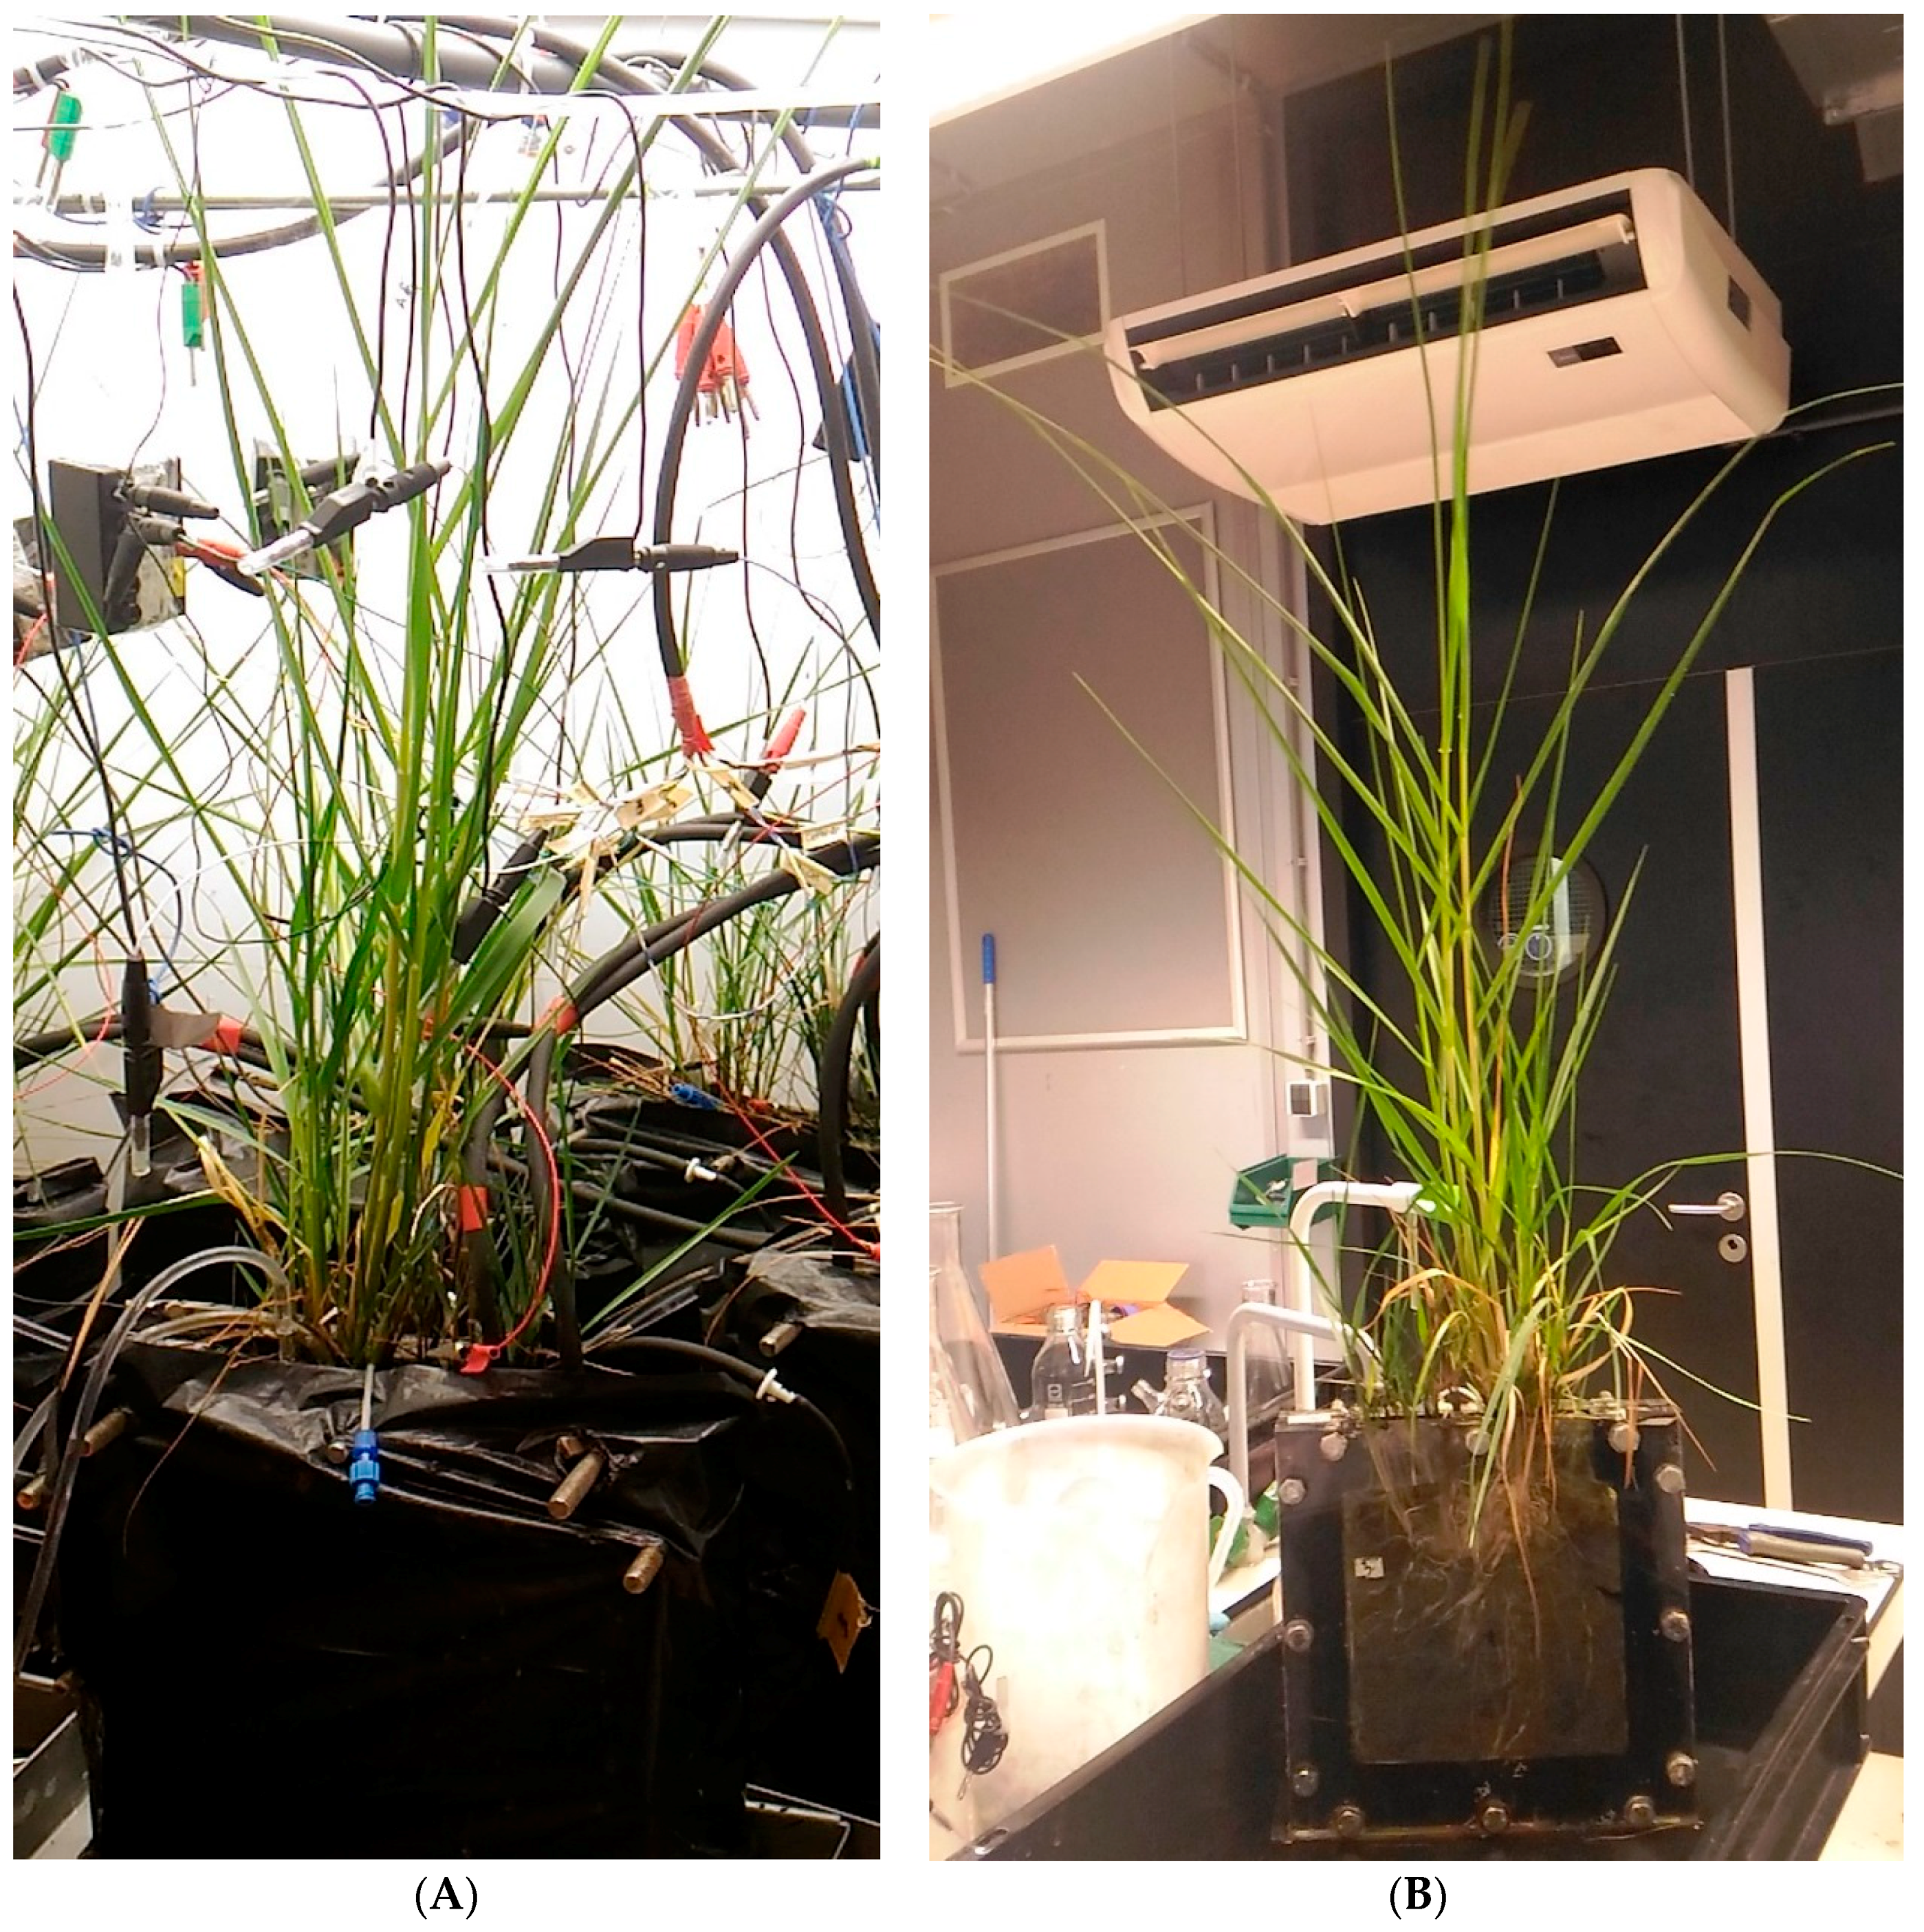
2.1. Experimental Setup

Lab constructed wetlands were prepared by planting S. anglica in the anode chamber of eight successfully operated flat-plate reactors from the bioelectrochemical system (BES) experiment [45]. Since the plants were transplanted, in this study the reactors were re-named as Plant-MFC instead of BES using the same numbering as the earlier study. The reactors consisted of two compartments in which one functioned as an anode and another as a cathode. A cation exchange membrane (fumasep FKD-PK-75 PEEK-reinforces, 75 μm, Fumatech, Bietigheim-Bissingen, Germany) separated the anode and the cathode compartment. In the anode, two graphite rods (18 × 1 × 0.2 cm) connected with titanium wire were glued in both side of the anode, functioning as current collector. A complete description and preparation steps how to build the reactors were presented in the previously published paper [45].
Four different anode compositions were used to fill the anode compartments (650 mL). Plant-MFC 1 and Plant-MFC 2, this duplicate was named as AC100, were filled with 100% activated carbon (AC); Plant-MFC 3 and Plant-MFC 4, this duplicate was named as MS100, were only filled with marine sediment; Plant-MFC 5 and Plant-MFC 6, this duplicate was named as AC67, were filled with a mixture of 67% AC and 33% marine sediment; and Plant-MFC 7 and Plant-MFC 8, this duplicate was named as AC33, were filled with a mixture of 33% AC and 67% marine sediment. The utilized AC is granular activated carbon PK 1–3 (Cabot Norit Netherlands BV, with apparent density of 290 g/L, Amersfoort, The Netherlands).
In the cathode compartment (22 × 22 × 1 cm; with a winding channel for catholyte flow), graphite felt was used as an electrode. This graphite felt (22 × 22 cm; 3 mm thickness, Grade WDF, National specialty product carbon and Graphite Felt, Morgan Advance Materials (Taiwan) Co., LTD.,Kaohsiung, Taiwan) was woven with a titanium wire as a current collector. From day 1–105, a nitrate-less, sulfate-less, ammonium-rich plant growth medium was utilized as catholyte. Then from day 105 until the end of the experiment, the plant growth medium catholyte was replaced with demi water. In both cases, the catholyte was aerated with ambient air using an aquarium pump and recirculated into the cathode chamber in a close cycle via a 1 L bottle with a pump (Watson-Marlow 505S, Rotterdam, The Netherlands at 30 rpm). Total catholyte volume in the close cycle was maintained at 1 L [45].
Common cordgrass (S. anglica), together with the marine sediment, was collected from a tidal area wetland at Krabbendijke, The Netherlands (51.446710 N, 4.093149 E). Prior to being integrated into the reactors, the grasses were kept outside at ambient temperature for one month in a container with marine sediment from their original habitat. The grasses were kept in a waterlogged condition by adding tap water to the container. Young stems with a length of 10–15 cm were selected from the container for the experiment. These stems were carefully pulled out from their clumps to avoid root damage. All remaining soil/marine sediment was gently cleaned with flowing tap water.
The plant stems were transplanted in the anode chamber of the reactor by burying their root from an open space on the top side of the anode known as plant growth area or PGA (19 × 2 cm). The roots were buried in a depth between 2 and 3 cm. The number of planted stems varied between 6 and 12 stems per reactor (Supporting Information (SI) Table S1).
The plant growth was maintained with a nitrate-less, sulfate-less, ammonium-rich plant growth medium [21,45] which was continuously pumped into the anode chamber by using a MINIPULS 3 GILSON pump at 4 μL/s flowrate. This plant growth medium also kept the anode of plant-MFCs in a waterlogged condition. On day 150 until 160, the pump was stopped to dry the anodes.

2.2. Operations

All Plant-MFCs were operated in the dark and light ratio of 10:14 h within a climate chamber (Microclima 1750, Snijders Scientific, Tilburg, The Netherlands) at 25 °C and humidity of 70%. All potentials were measured and reported against 3 M KCl Ag/AgCl reference electrode (QIS, Oosterhout, The Netherlands). The photosynthetically active radiation (PAR) light intensity was measured with a lightmeter (LI-250A, Li-Cor Quantum Q44722 sensor, Li-Cor ®Biosciences, Lincoln, NE, USA) at 12 different positions in the middle height of the climate chamber. The average PAR was 470.4 ± 12.14 µmol s−1 m−2. Two control modes were alternately applied; a potentiostat control mode (day 1–101 and day 176–190) was used to control the anode potential at −100 mV vs. Ag/AgCl (Transients, Chronoamperometry; Ivium Technologies BV, Eindhoven, the Netherlands); an external load control mode (day 102–175) was applied by connecting a 1000 ohm external load between the anode and the cathode. During the potentiostat control mode, the anode potential was controlled with a three electrode setup in which the anode was the working electrode, the cathode as the counter electrode and a reference electrode (Ag/AgCl type No: QM710X QIS, ProSense BV, Oosterhout, the Netherlands) in the anode as the reference electrode. A picture of a full-grown Plant-MFC 3 (MS100) is shown in Figure 1.
On day 28, a polarization test was conducted to evaluate the power output from all Plant-MFCs. The polarization was performed with a potentiostat by changing the anode potential of the Plant-MFC every 10 min using the three electrodes setup in which the anode was a working electrode. Prior to the polarization, the plant-MFCs were operated at an open cell condition for 1 h to determine the minimum anode potential for each plant-MFC. Based on the anode potential at the open cell condition, the anode potentials sequences for polarizations were decided as following: −100 mV, −80 mV, −60 mV, −40 mV, −20 mV, 0 mV, +20 mV, 0 mV, −20 mV, −40 mV, −60 mV, −80 mV, −100 mV (for AC100, AC67, and AC33) and −320 mV, −270 mV, −220 mV, −170 mV, −120 mV, −70 mV, −20 mV, 30 mV, −20 mV, −70 mV, −120 mV, −170 mV, −220 mV, −270 mV, −320 mV (for MS100). Current generation was logged every second with the Iviumsoft. The average current generation from every last minute of the anode potential was used to calculate the power output. For the calculation of the power output, 200 mV hypothetical oxygen reduction cathode potential was used since this value was easily reached by an oxygen reducing biocathodes applied in a Plant-MFC [28]. The current density and power density were normalized to plant growth area (PGA) and to the anode volume.

2.3. Measurements and Analysis

Data were logged every minute according to the control mode. During the potentiostat control mode, generated current was logged with the IviumSoft of Ivium Technologies connected to a lab personal computer and during the external load control mode, the anode potentials, the cathode potentials, the membrane potentials, and the cell potentials were logged with a field point (National Instruments FP-2000; FP-AI-112, National Instrument Netherlands BV, Woerden, The Netherlands) similar to previous study [45].

2.3.1. pH, Conductivity, and Acetate Analysis

Catholyte and anolyte samples were taken continually from the reactor. Catholyte samples were taken from the cathode outlet prior entering the catholyte circulation bottle. The anolyte samples were taken using a syringe via a soil moisture sampler (10 RHIZON MOM 5 cm female luer; article no. 19.21.22F from Rhizosphere Research Product, Wageningen, The Netherlands) whose end tip was placed in the middle of the anode chamber. The pH and conductivity were directly measured after sampling by using a HACH HQ440d multi pH/LDO/conductivity meter (Hach Company, Loveland Colorado, CO, USA). Samples for acetate analysis were kept in a fridge at −20 °C to be measured later using gas chromatography as described earlier [45,54].

2.3.2. Plant Growth Monitoring

Plant growth was monitored by counting the number of living stems and summarizing the height of living stems. The stems’ height was measured from the top-end-plate of the anode to the leaf tip of each stem. The accumulative stem height for every Plant-MFC was calculated by summing up all living stem heights in the reactor. These data were continually sampled until the end of the experiment.
At the end of the experiment (day 190), all biomass (both above and belowground biomass) were harvested from all reactors. The roots were rinsed in a flowing tab water to remove soil and activated carbon. Dried biomass was determined after drying at room temperature for 3 months until constant weight was reached. Biomass yield (kg/m2) was calculated and normalized per plant growth area (PGA) which was 0.0038 m2 per Plant-MFC.

2.3.3. DNA Analysis

At the end of the experiment (day 190), about 3 mL biomass samples from anode components (mixture of marine sediment, AC and plant roots) were taken for DNA analysis. Samples were taken from the MS100 (Plant-MFC 3 and Plant-MFC 4) and the AC33 (Plant-MFC 7 and Plant-MFC 8). For every reactor, five biomass samples were collected. Biomass samples were taken from five different locations in the anode as marked on Figure 2. These five sample locations were clustered in two zones: upper zone (until 5 cm below the anode surface) and lower zone (from 5 to 20 cm below the anode surface). The upper zone (UZ) sample points were (A) UZ-AN (anode) and (C) UZ-CC (current collector). The lower zone sample points were (B) LZ-RO (roots), (D) LZ-AN (anode), and (E) LZ-CC (current collector). In the MS100 plant-MFC, the anode biomass samples (UZ-AN and LZ-AN) contained marine sediment; the current collector biomass samples (UZ-CC and LZ-CC) contained marine sediment that were attached on the current collector. While, in the AC33 plant-MFC, the anode biomass samples (UZ-AN and LZ-AN) contained AC and marine sediment; the current collector biomass samples (UZ-CC and LZ-CC) contained AC and marine sediment that were attached on the current collector. In total, 20 samples were collected. The samples were stored immediately in an −80 °C freezer after collection before the DNA sequencing was performed.
Sequencing steps were performed similar to the work of de Smit et al. [55]. DNA was extracted from the samples using the PowerSoil® DNA isolation kit according to their instruction manual with some modifications (SI Method S1). The extracted DNA was quantified using Qubit® and diluted to 5 ng/μL as the final template DNA concentration for PCRs. The V3–V4 regions of 16 s rDNA from the isolated DNA (template DNA) was amplified using the primer sets provided by Takahashi et al. which allowed simultaneous amplification of bacterial and archaean 16 s rDNA. The illumina library generation methods were subsequently used to generate DNA sequence data [56].
After acquiring rDNA sequence data, statistical analysis allowed operational taxonomic unit (OTU) picking, using the SILVA version 128 16S reference database and uclust [57,58]. The Ribosomal Database Project (RDP) classifier (version 2.2) [59] was trained with the same SILVA reference database and subsequently used to classify the OTUs. Taxonomic analysis was performed using QIIME software version 1.9.1 [60]. This bioinformatics process was performed on 21 August 2018. From the acquired data, a heat map such as shown in the SI (Tables S2–S4) was made using Microsoft Excel 2016.
Beta diversity analysis was performed to measure the extent of similarity/dissimilarity between microbial populations comprising samples and sample groups by calculating different distance matrices. Based on the unweighted UniFrac beta diversity, a Principal Coordinates Analysis (PCoA) with a 3D ordination was plotted through QIIME using Emperor Software from the beta diversity data to compare group of samples based on the phylogenetic or count-based distance metrics [61]. From the PCoA, one can see the similarity and dissimilarity among the group of samples. Objects that are ordinated closer together have smaller dissimilarity values than those ordinated further apart.

2.4. Calculations

The Plant-MFC current density was plotted as a daily average as shown in SI Figure S1. During potensiostat control mode, the daily average current was directly calculated from the generated current that was logged every minute with the Iviumsoft. During the external load control mode, prior to calculating the daily average current, the generated current (Igen), in ampere (A), was calculated with Equation (1).
Igen = Vcell/R.
Vcell is cell potential (V) and R is the applied external load (ohm).
Power output (P), in Watt (W), was calculated depending on the control mode. Equation (2) was used to calculate the power output during the potentiostat control mode and Equation (3) was used to calculate the power output during the external load control mode.
P = Vhyp × Ipot.
Vhyp is 0.2 volt hypothetical cell potential and Ipot is current output measured and logged with the potentiostat.
P = Igen2 × R.
Igen is generated current (A) as calculated from Equation (1) and R is applied external load (ohm).
Both current density and power density were normalized to the plant growth area (PGA) and to the anode volume.

3. Results and Discussion

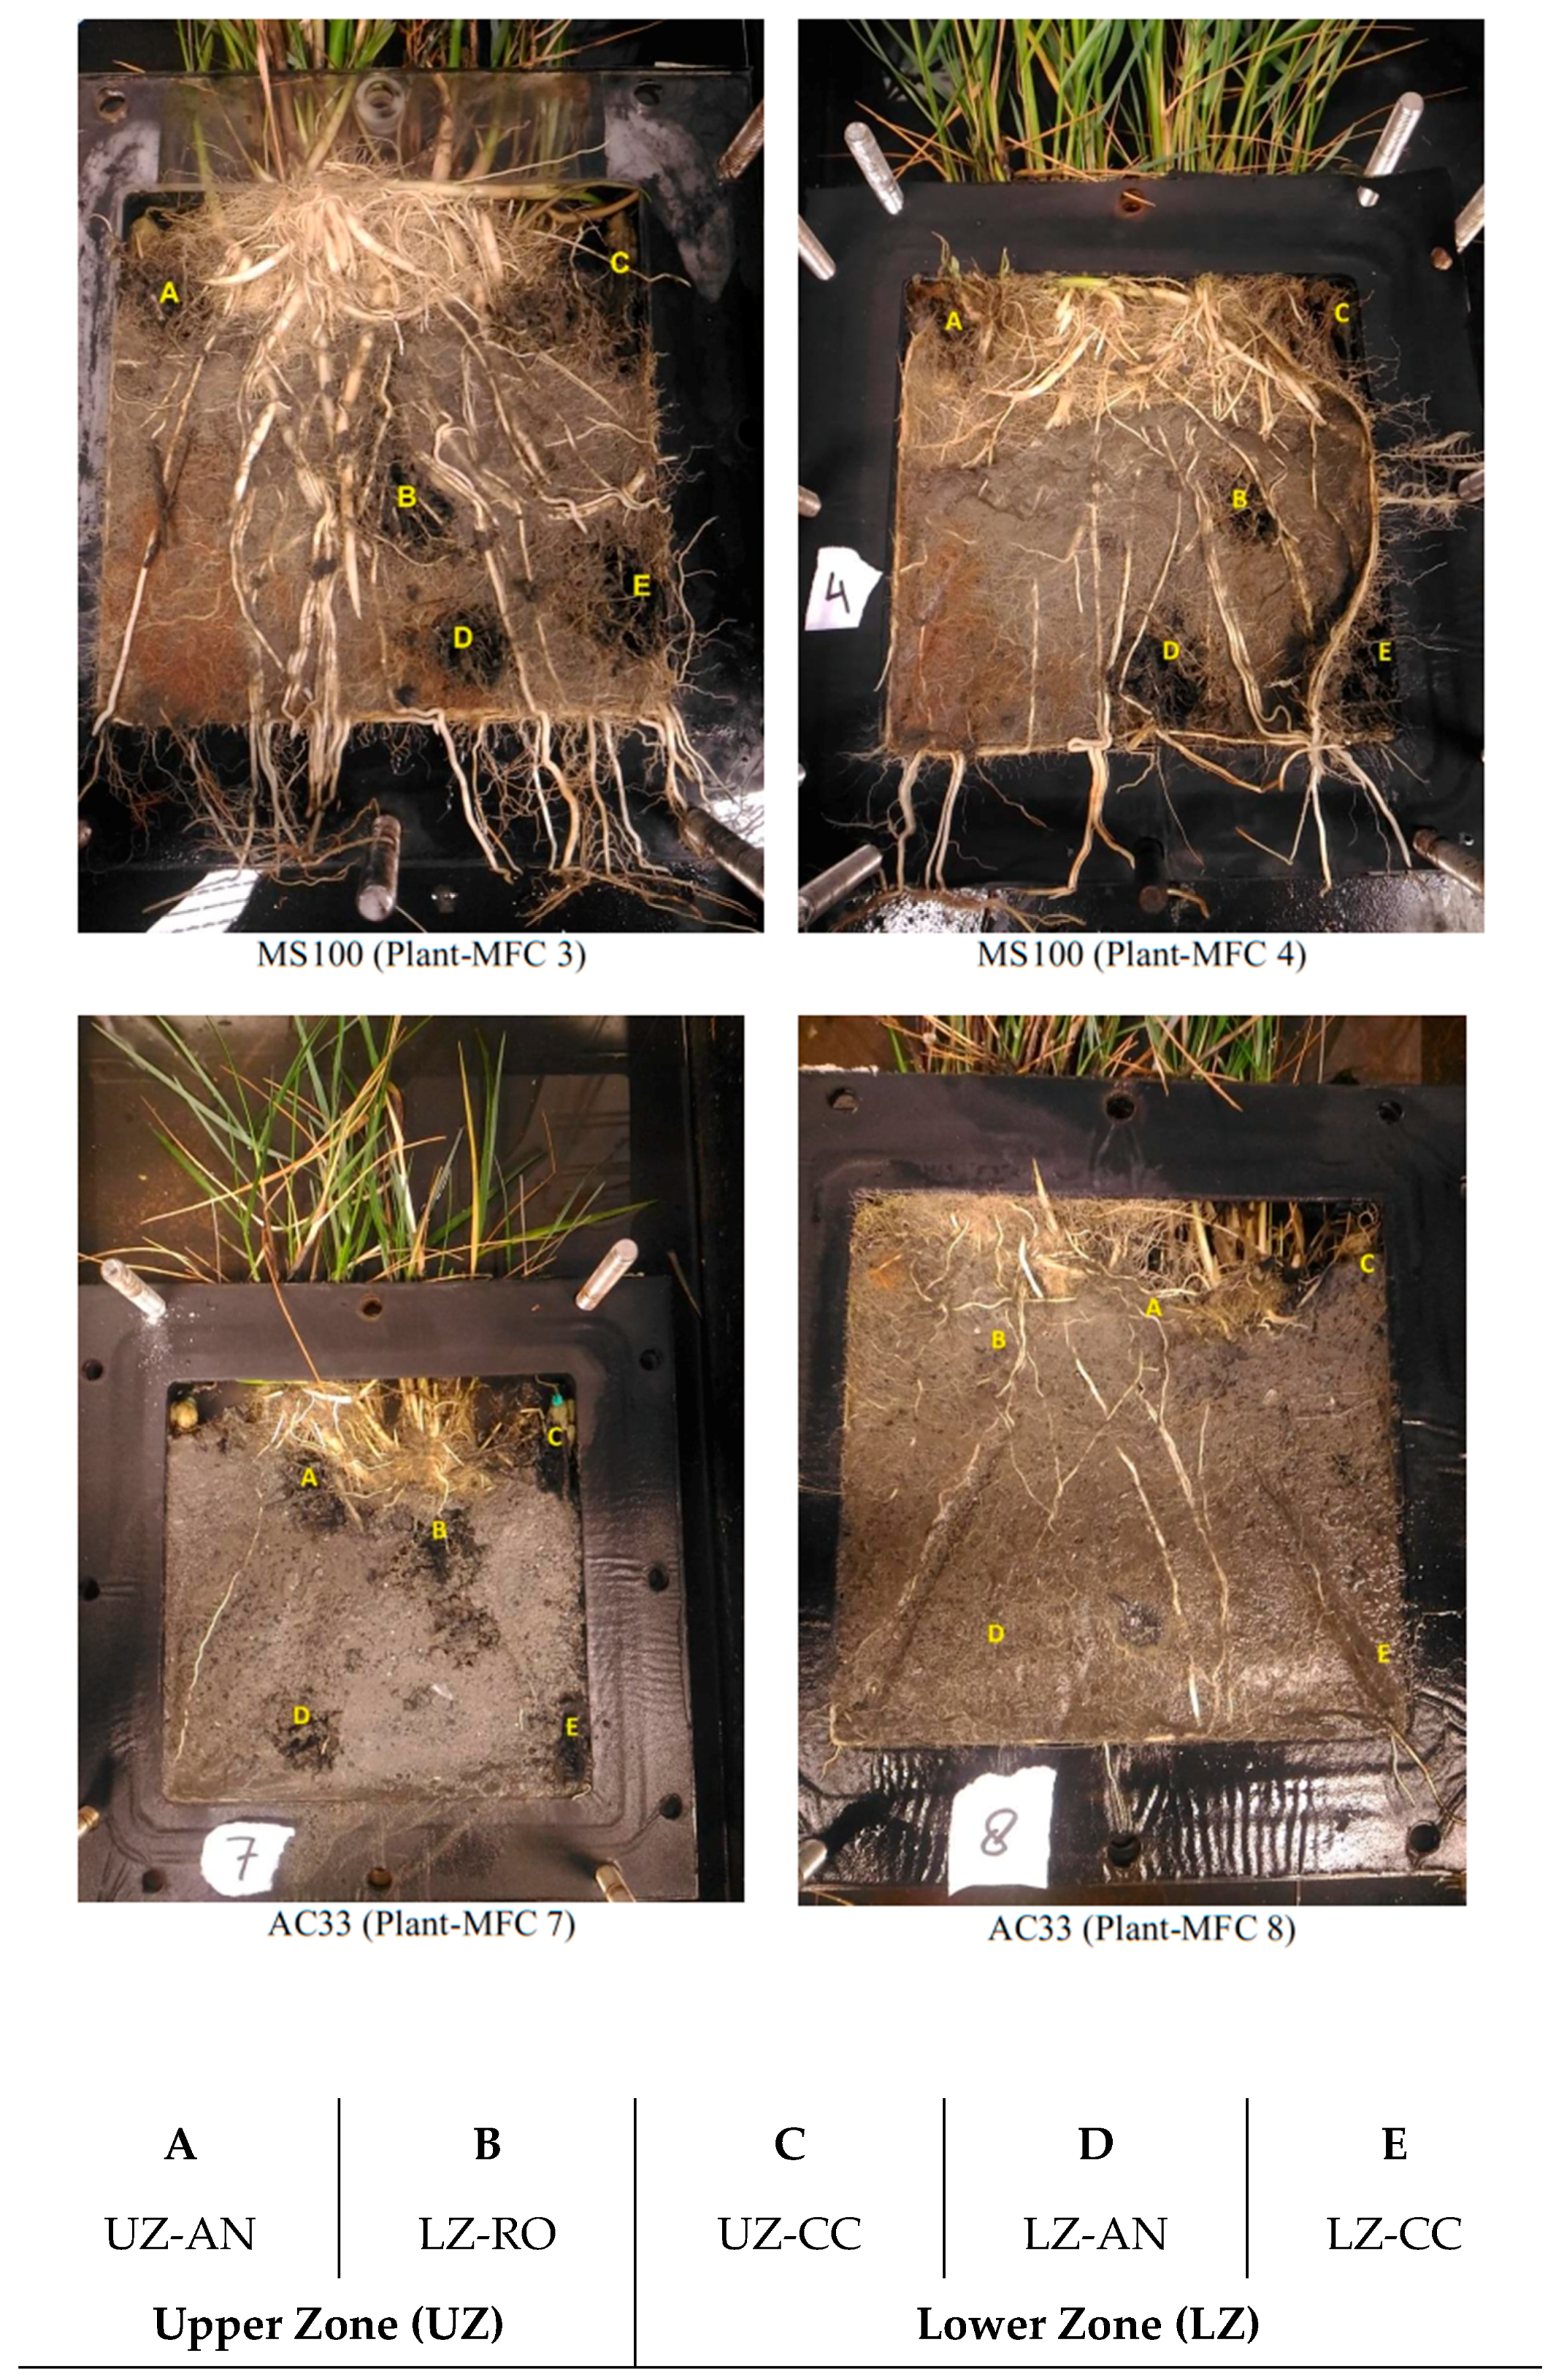
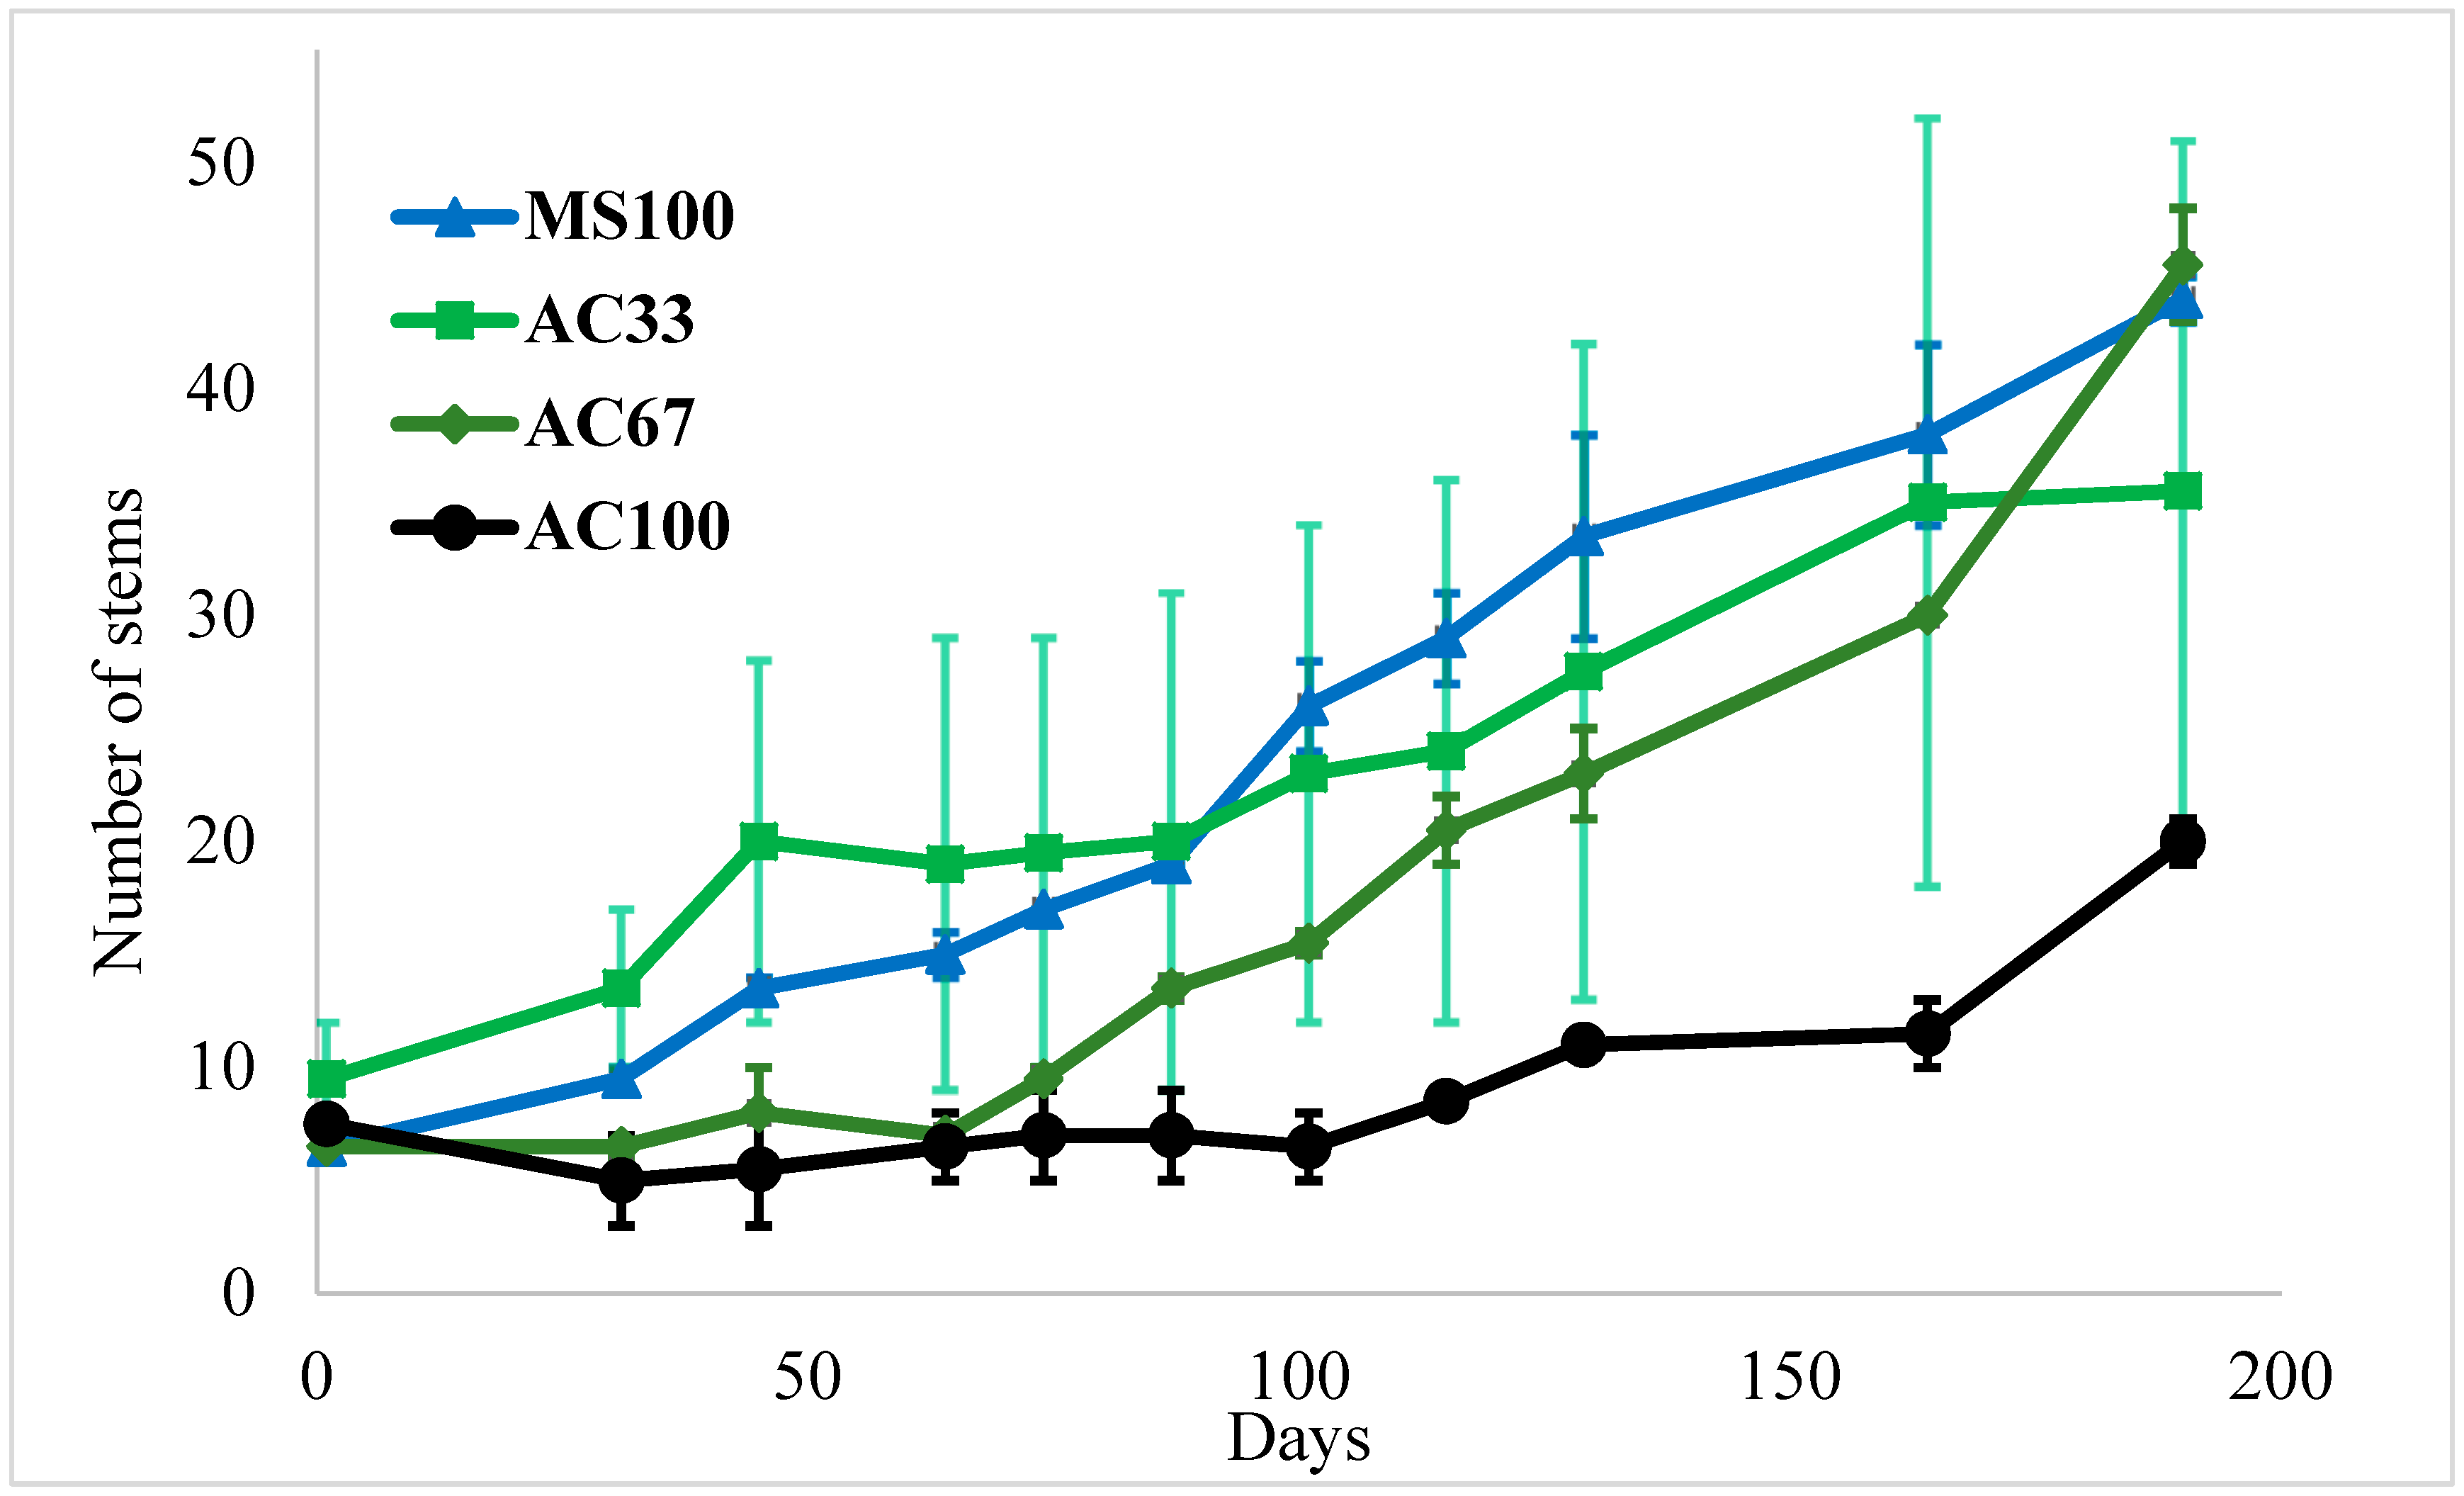
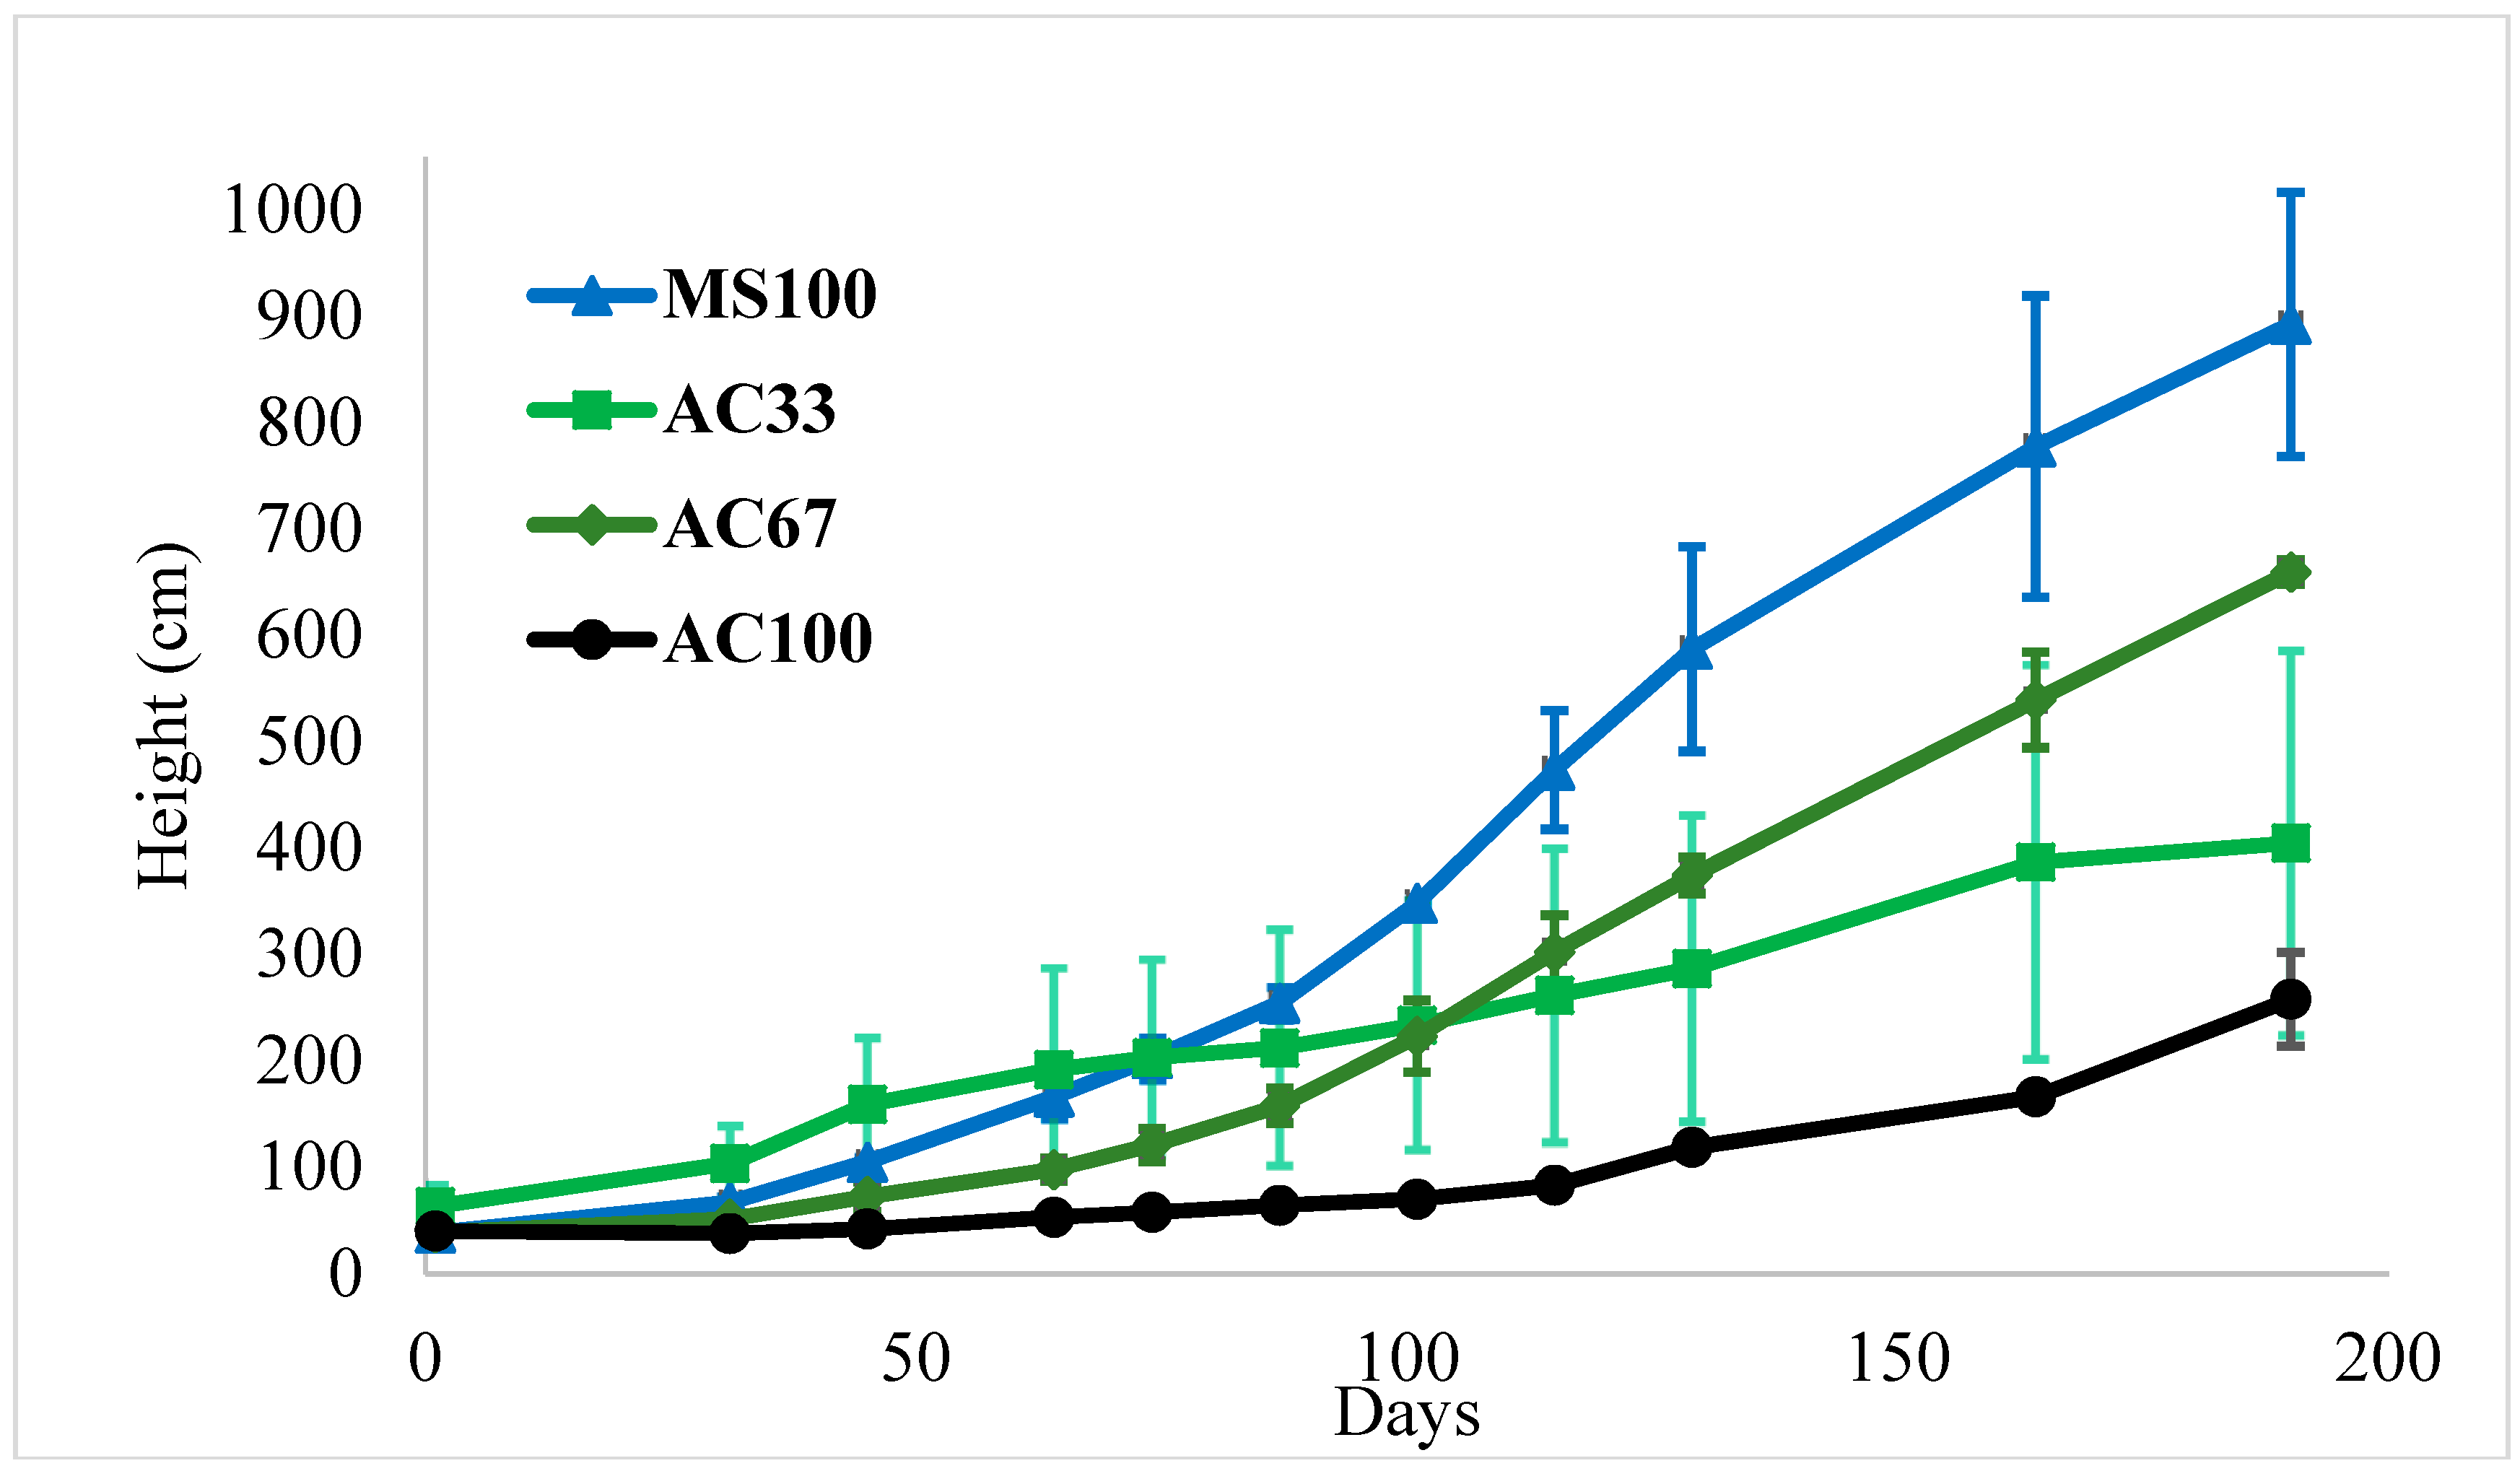
3.1. Mixture of Activated Carbon (AC) and Marine Sediment Effect on Plant Growth

Plants were growing in all reactors for 190 days after transplantation regardless of their control mode, even at negative current. This growth was proven by the increase in the number of living stems (Figure 3) and in the accumulative stems height (Figure 4). The number of living stems increased to between two and eight times from their initial size (Figure 3). The accumulative stems height varied between 2 and 10 m at the end of experiment (Figure 4). The plant ability to grow in such anode environment proves that the mixture of activated carbon and marine sediment are suitable materials for a Plant-MFC. For a visual comparison, SI (Figures S2 and S3) shows plants condition at the moment they were planted and at the end of the experiment. The similar plant species were able to grow up to 703 days in the graphite felt anode of a flat-plate plant-MFC [24]. In other studies with the same plants species and a similar type of reactor, the plant vitality was reported to increase from nine stems in the beginning to 25 stems (2.8 times) after 56 days and further increases to more than 30 stems (3.3 times) after 140 days [28].
Duplicate analysis shows that the AC100 Plant-MFC has less plant growth in terms of the number of living stems (Figure 3) and the total stem height (Figure 4) compared to the other anode compositions. Evidently, more replicates are needed to provide statistically supported evidence that can lead to strong conclusions. Nevertheless, the actual measured reduced plant growth could be due to nutrient limitation for plants and/or bacteria in the reactor because of adsorption capability from activated carbon [48]. Other studies have proven that activated carbon is able to adsorb various compounds such as acetate, ammonium, phosphate, nitrate, sulphate, and metal ions [62,63,64,65,66,67,68,69]. In this study, the nutrient supply was mainly from plant growth medium and leftover acetate (SI Table S5) from a previous experiment. Conductivity and pH remained in the same order of magnitude in both the anolyte and catholyte (SI Table S5). This suggests that still some salts/nutrients are available; though whether specific nutrients were becoming limiting could not be revealed. We can speculate there may be mechanisms that Spartina plants in the long term can desorb nutrients by changing rhizosphere conditions as known for e.g., phosphate leaching plants [70,71]. The number of stems in the other anode compositions (MS100, AC33, and AC67) were growing well. It is difficult to elaborate on which anode composition is possibly performing better based on these two parameters because the variation bars from those three anode compositions were overlapping (Figure 3 and Figure 4). Further research with more compositions and replicates is recommended to determine the best composition of mixing between marine sediment and activated carbon. However, the measured data shows that mixing marine sediment with activated carbon had a higher plant vitality than sole use of activated carbon. The use of marine sediment may have been beneficial because it has plenty of organic matter including nutrients [72] that can be utilized by plants for their growth and by the electrochemically active bacteria to generate electricity [45].
Plant growth can also be assessed through biomass production. In this research, it is remarkable that the less growth AC100 Plant-MFCs dry biomass yields (SI Table S6) are still comparable to literature reporting a yield of S. anglica under natural conditions between 0.48–1.85 kg/m2 for above ground dry biomass and 0.78–3.11 kg/m2 for below ground dry biomass [20]. The other Plant-MFCs are, as expected, producing more biomass compared to AC100 Plant-MFC. Both the above and the lower ground dry biomass from AC33 and AC67 Plant-MFCs were also within the range of natural yield of S. anglica and slightly higher than the natural condition (SI Table S6). The dry biomass yield for MS100 Plant-MFC was higher than that in the natural condition. The biomass production from Plant-MFC could still be increased because the earlier research with S. anglica using graphite grain as anode media was able to harvest 6 kg/m2 above ground dry biomass and 15 kg/m2 below ground dry biomass [20]. These biomass yield differences might be explained as growth conditions (e.g., temperature and light intensity) are different in the natural and laboratory-experimental conditions. In addition to the plant growth, we also observed that small-red segmented worms, with diameters between 1 and 3 mm and lengths between 5 and 8 cm, were able to live/survive in the anode part of the MS100 Plant-MFC (Figure 5). These worms, based on their physical appearance possibly from Annelida phylum [73], are natural decomposers which maintain soil fertility by altering soil compositions through decomposing and transforming organic matter [74]. The latter provides support that the bioanode does support (some) biodiversity.

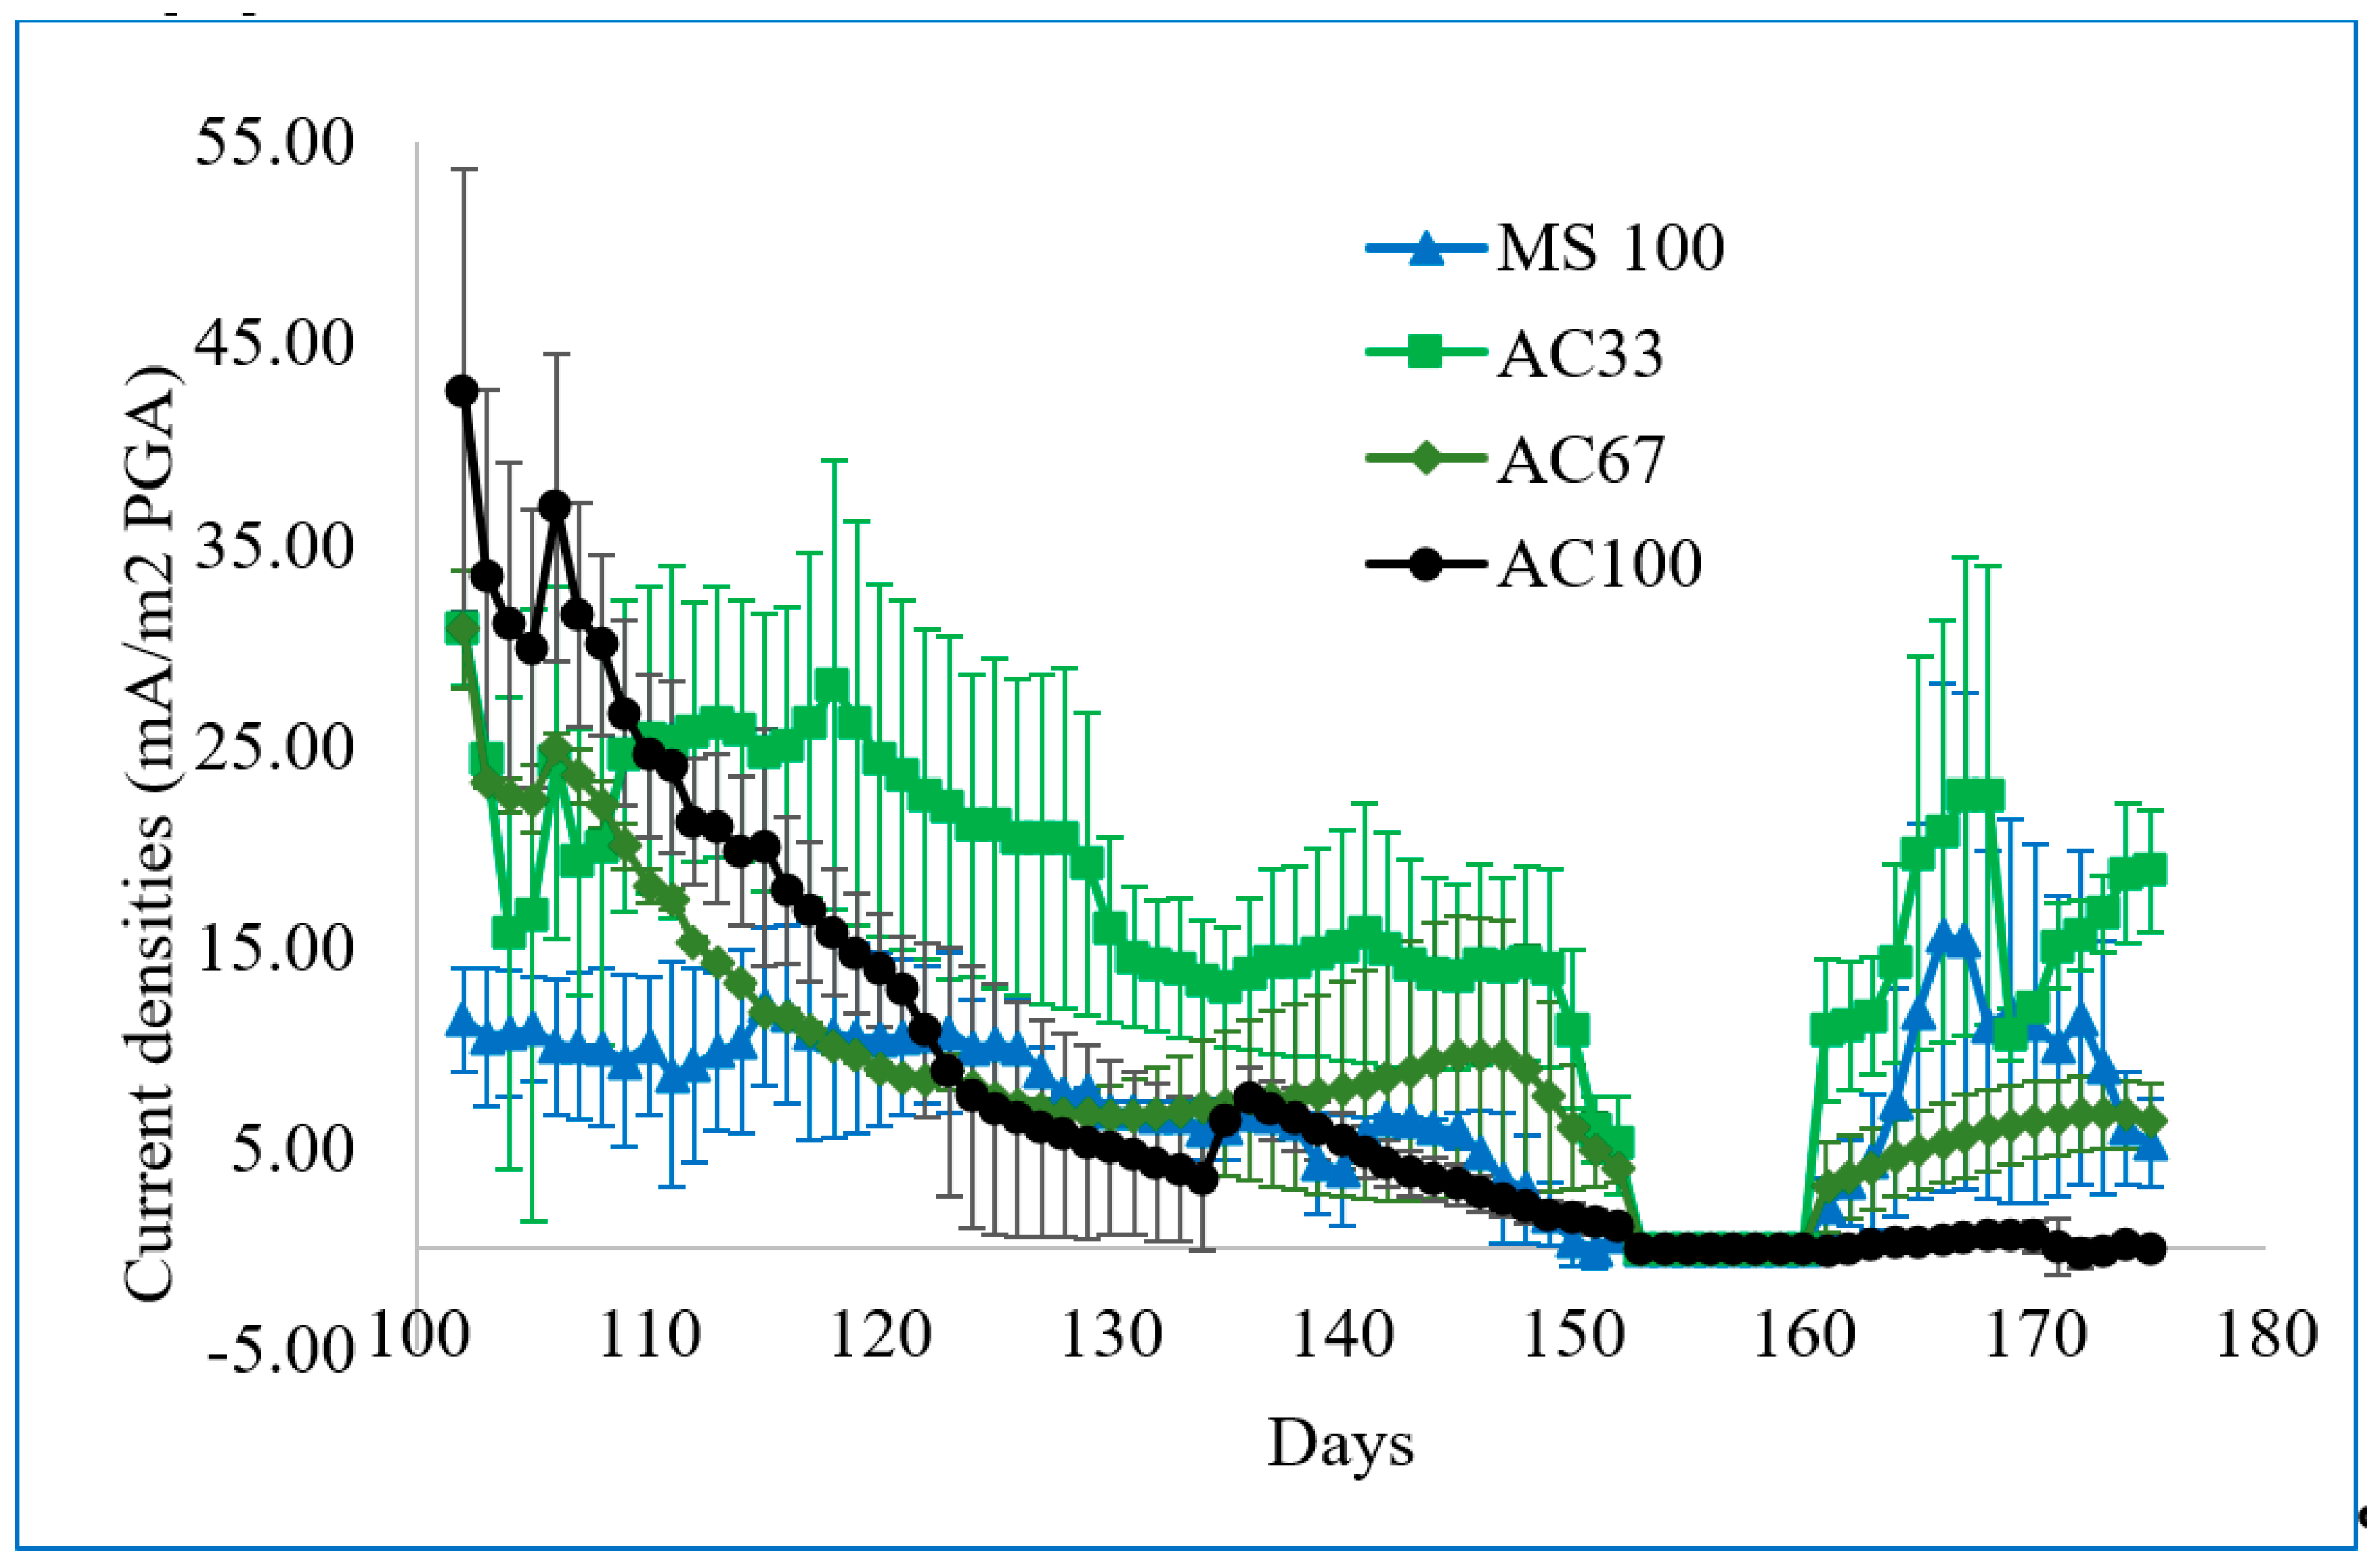
3.2. Mixture of Marine Sediment and Activated Carbon Generating Electricity in Plant-MFCs

Results show that all plant-MFCs generated power when operated at 1000 ohm external load as shown in Figure 6. The AC33 Plant-MFC seems to be best suited for generating electricity. The average duplicate AC33 Plant-MFC generated higher current density in a long-term operation compared to the other Plant-MFCs. On average, the MS100 Plant-MFC delivered less current in comparison with the other Plant-MFCs. This Plant-MFC continuously generated positive current regardless of their applied control mode. When all anode chambers were dry, in a period between day 150 and 160, the current output was zero for all of plant-MFCs. Unlike the MS100 plant-MFCs, the current output of the AC100 Plant-MFC reached up to 42.6 mA/m2 at the first time the external load was operated. Then, the current output decreased gradually reaching zero. A similar phenomenon was also shown by the AC67 plant-MFC. The high current phenomenon at the beginning of the external load operation, as shown by AC100 and AC67 Plant-MFC, was caused by the capacitive behavior of the activated carbon anode as described in earlier research [45]. At that time, the envisioned anode was actually acting as a cathode and electrical charges were added to the system. Later on, when the control mode was switched to the external load, the stored electrical charges were released as an anodic current which harmonically went towards zero [45].
During the potentiostatic controls, only MS100 and AC33 Plant-MFCs generated electricity (SI Figure S1). Instead of generating power, the other Plant-MFCs (AC67 and AC100) had a negative current production, indicating a capacitive behavior effect. At this moment, electric charges were stored in the anode. This capacitive behavior had been studied earlier in activated carbon-based bioanodes in a bioelectrochemical system [43,45,75]. The capacitive behavior was not observed in the MS100 plant-MFCs and less obvious in the AC33 plant-MFC. It was not clear why the AC100 duplicate behaved differently during the first potentiostatic control. However, both AC100 duplicates showed a similar trend, generating a negative current, on the second potentiostatic control.
After the plant growth medium pump had been stopped, all Plant-MFC anodes became dry (day 150–160) because of the evaporation process and uptake by plant roots. As a result, all plant-MFCs delivered no current. There are some possible explanations for this situation. First, dry anodes become more aerobic because oxygen would easily penetrate through pores of the activated carbon particles and the marine sediment. As a result the anaerobic EAB activity will more likely be outcompeted by aerobic bacteria in substrate utilization and thus hinder the yield of EAB in the anode [76]. Second, even though the anaerobic oxidation was still occurring in some parts of the anode, the generated electrons will soon utilize the available oxygen in the anode side as their acceptor. This fact gives a useful insight that when a wetland becomes dry, it may lose its function as a “home” for important anaerobic processes. However, in a temporary dry wetland, e.g., in an intertidal wetland, the oxygen diffusion into sediment can accelerate the aerobic degradation of some high molecular weight compounds into a low molecular weight compounds which later on can be utilized by the EAB under anaerobic condition to generate electricity [76]. Therefore, a Plant-MFC installed in a salt marsh, which influenced by tidal advection, generated more than 10 times more power than the same Plant-MFC in a peat soil [23]. The fact that all plant-MFCs delivered zero current at a dry condition might also be useful for wetland mitigation. For instance, one could design and install a less required power sensor powered by a plant-MFC. This bio sensor could be coupled with an internet of things (IoT) application [77] to monitor a wetland condition, i.e., water level.
On day 160, the plant growth medium was pumped back. The current generation of all plant-MFCs were recovered except for the AC100 plant-MFC. The AC100 Plant-MFC was hardly recovered and generated almost zero current until end of the external load control mode. Therefore, the average and maximum current and power densities of this last 2 weeks (day 160–175) operation under the external load mode after recovering from the dry period was preferable to compare the result of this study with other studies (Table 1).
In this study, insights on the possible link between plant roots and current/power generation were also observed. Based on the below ground biomass yield and pictures of the roots at the end of the experiment (SI Table S6 and SI Figure S4), the root densities from the highest to the lowest were in the MS100, AC67, AC33, and AC100 plant-MFC. There was a small difference between root density in the MS100 and the AC67 plant-MFCs. Results show a correlation (R2 = 0.6) between the current density and the root density of the Plant-MFC (SI Figure S5). The average current density of AC33 Plant-MFC was 1.04, higher than those of AC67 (0.12 mA/m2) and MS100 (0.37 mA/m2). The plant roots are able to transport oxygen into the anode [76,78,79]. The oxygen concentration at the S. anglica root surface could reach up to 85 μmol L−1 and the radial oxygen loss across the root surface ranged from 250 to 300 nmol m−2 s−1 [78]. The increase of oxygen concentration in the anode will promote the oxidation reaction, which theoretically increases the anode potential. Thus it will negatively affect the current and power generation [22,79]. Therefore, the anode should be placed in a proper distance to avoid or reduce the negative effect of oxygen loss from the roots [76].
It is challenging to compare the result of one study with other studies because of the variation in the system (i.e., electrode materials, plant growth, sediment use, reactor size, operation condition, control method, etc.). Comparing the maximal power output is less preferred because it does not really show the capability of such system to deliver continuous power for a long period. Here, we compare our result with the average power generation for a minimum period of 2 weeks performance. In Table 1 we provide a comparison with other studies which have some similarities with our study. These studies show lower than average current density of 74–384 mA/m2 (power density of 47–155 mW/m2) using a similar type of flat-plate reactor and plant species on a graphite felt anode [21]. Another Plant-MFC with graphite grains anode was able to generate average power output of 22 mW/m2 for 8 weeks [20]. However, both studies utilized ferric cyanide as catholyte instead of water.
Based on this comparison, it seems that mixing marine sediment with activated carbon influences the power output of a Plant-MFC system; however, another explanation for this could be plant difference in biomass growth (Figure 3 and Figure 4). More plants may produce more rhizo deposits. It is also not evident that the highest amount of used marine sediment was leading to the highest current density since the AC33 Plant-MFC performed better compared to the other plant-MFCs. Based on 2 week performance, the AC33 Plant-MFC generated current on average 16.01 mA/m2 PGA (22.53 mA/m2 PGA max). This result was comparable with sediment-MFC from previous study, which used a mixture of 50% granular carbon (1–5 mm) with sand as an anode material fed with 20 mM sodium acetate as electron donor. After 3 weeks of incubation, the sediment-MFC reached an average current density of 25 ± 7.74 mA/m2 with a maximum of 37.9 mA/m2 [80]. It should be noted that without the presence of plants and solely fed with sodium acetate, the mixture of 33% granular carbon with sand sediment-MFC only generated maximum of 5 mA/m2 of current density after 2 week operation [80]. The cathode performance of the studied systems may have affected the MS100 but did not likely limit the bioanode of the other Plant-MFCs. The recorded anode and cathode potentials from day 160 onwards shows that the cathode potential was not likely to limit the current generation (see SI Figure S6). Some Plant-MFCs (MS100 and AC33) fluctuated on current and anode/cathode potential. Since this did not happen in both duplicates, it could not be attributed to the type of electrode materials used. Other parameters that may cause this phenomena need to be further investigated while several Plant-MFC reports show dynamic behavior [32]. The cathode potentials of the AC33 and the AC67 were in between +100 and +300 mV except in the end of one of the AC33. The cathodes of AC100 varied between +60 and +100 mV. All these cathode potentials are higher or comparable to the cathode potentials reported for an abiotic oxygen reduction process within a similar flat-plate Plant-MFC reported by Wetser [28]. The measured anode potential in all systems (except the MS-100) were mostly rather high (>0.070 V) compared to other Plant-MFC studies with Glyceria maxima plants showing a significant anode resistance [22]. This supports that the cathodes of our studies were not limited for the oxygen reduction using the produced electrons at the anode. For the MS100, the anode and cathode potentials were fluctuating providing possible limitations on the cathode as well as on the anode during the experiment. Further studies with more replicates and more variations on AC, different electrode materials, and marine sediment percentages are needed to draw conclusions on using such electrode materials long term. Even so, the electric conductivity of the marine sediments itself and the activated carbon bed and their mixtures should be investigated while both materials have shown to have an electric conductivity which is relevant in microbial fuel cells [81,82].

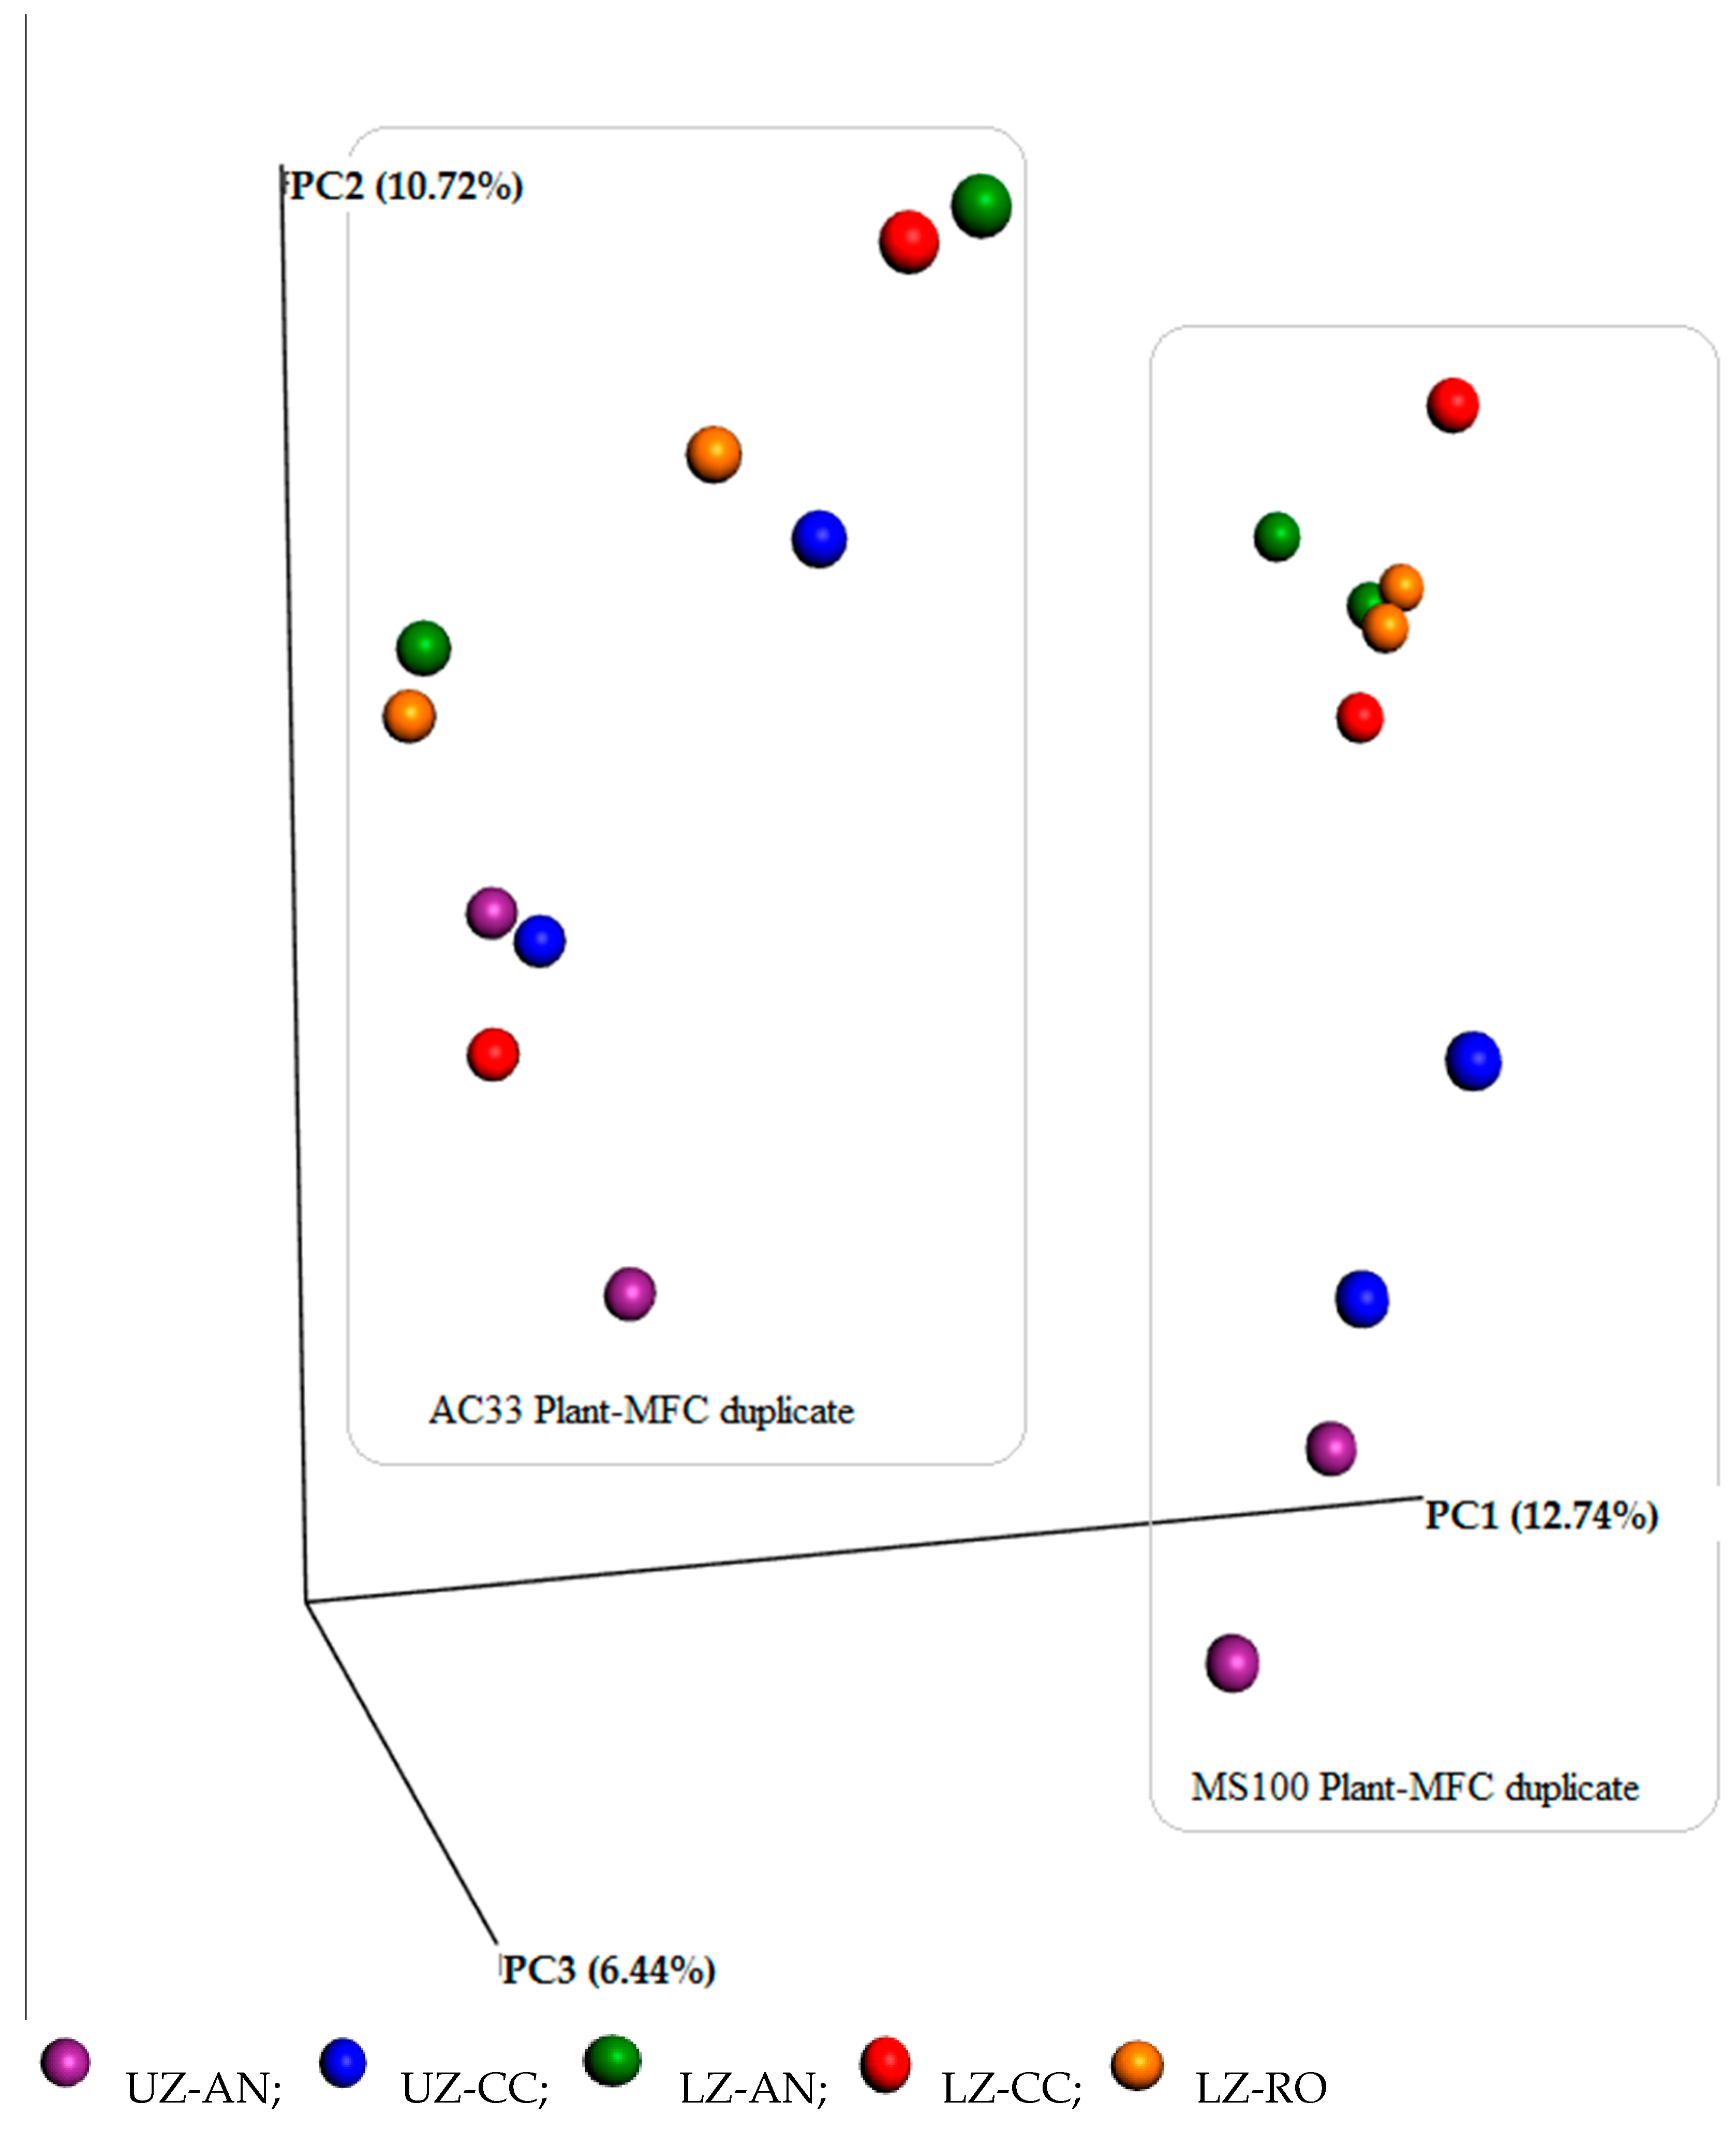
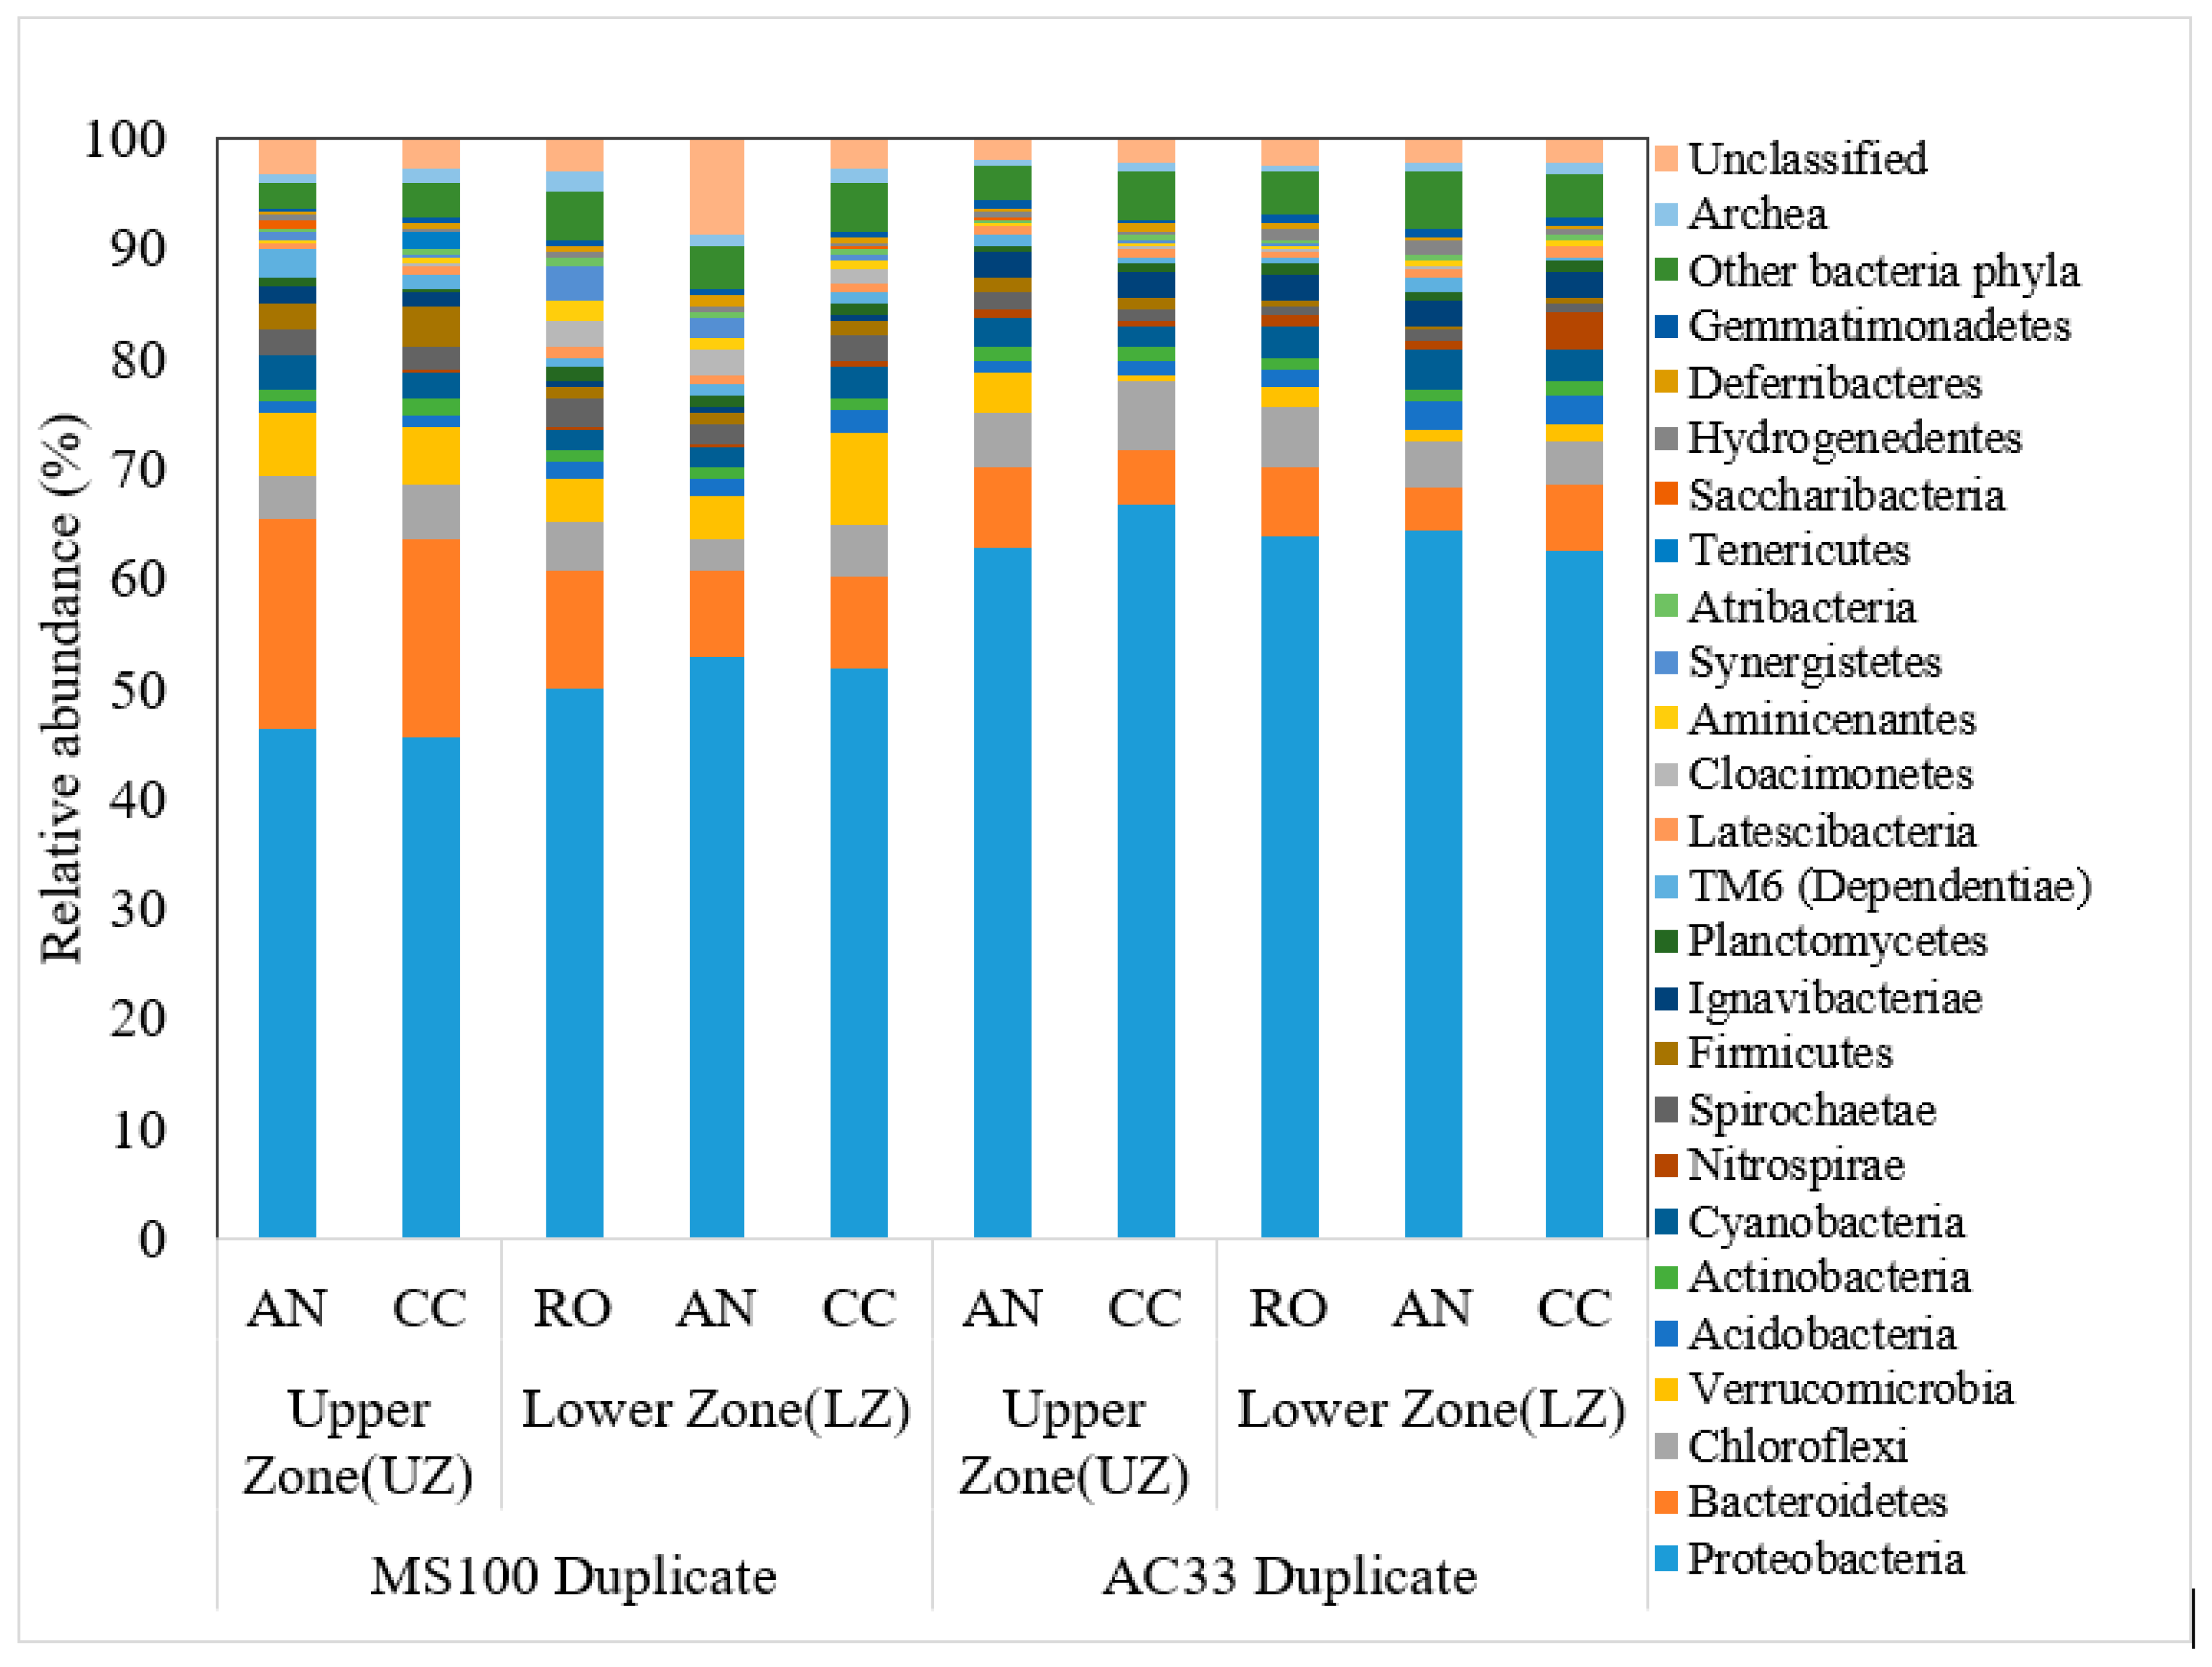
3.3. Diverse Microbial Communities

Spatially diverse microbial communities were observed in this study. Based on alpha rarefaction plots, the observed_otus (70,000 sequences per sample) for MS100 Plant-MFC 3, MS100 Plant-MFC 4, AC33 Plant-MFC 7, and AC33 Plant-MFC 8 were 6308, 7077, 8173, and 9177, respectively. The Principal Coordinates Analysis (PCoA) shows that the MS100 Plant-MFC and the AC33 Plant-MFC communities are distinctly separated between each other even though they come from the same marine sediment inocula (Figure 7). In addition, there is a clear difference between upper zone and lower zone microbial communities, especially in the MS100 plant-MFC. This result indicates that the bacterial communities are influenced by the anode composition/material.
Technical duplicate Plant-MFC microbial analysis results from all the MS100 and AC33 plant-MFCs shows that the archaea do not play an important role in the Plant-MFC electricity generation process since they were not abundantly available (0.39–1.93%). Bacteria were found with a high relative abundance in the plant-MFCs system of 85.2% to 97.7%. A total of 63 phyla were observed in this study with a relative abundance of minimum 1%. Figure 8 shows four most dominant phyla that accounted for 64–81% of the total population. They were, from the most to the least dominant, Proteobacteria, Bacteroidetes, Chloroflexi, and Verrucomicrobia. Looking deep into the Proteobacteria phylum diversity, it was dominated by Gamma proteobacteria (20.2–50.2%), Delta proteobacteria (26.2–44.5%), Beta proteobacteria (3.4–27.8%), Alpha proteobacteria (11.7–21.6%), and Epsilon proteobacteria (2.2–11.6%). More detailed relative abundance of classes within a phylum from the four most abundance phyla is presented in SI (Figure S8, Tables S2–S4). This result is similar with previous study in a Glyceria maxima Plant-MFC anode rhizosphere bacterial community which found that Proteobacteria were the most abundant phylum [39]. The dominance of Proteobacteria is also consistent with root-associated microbial communities in other rhizosphere sediment of salt marshes [87,88,89].
The dominance of Proteobacteria in such lab-wetland system are well known and most of them are responsible for sulfur cycle in the sediment. Sulfate reduction is the dominant respiration of the anaerobic marine sediment in the salt marshes vegetation [87]. Sulfate-reducing bacteria (SRB) play an important role in the marine carbon and sulfur cycle [90]. For instance, one family from Deltaproteobacteria, Desulfobulbaceae is known as “cable bacteria”. These bacteria are globally found in the marine sediment and able to transport electrons over a long distance by coupling sulfide oxidation and oxygen reduction [91,92]. At least more than 220 species of 60 genera of SRB have been described. They spread within the bacteria (Firmicutes, Proteobacteria, Nitrospira, and Thermodesulfobacteria) and the archea (Euryarchaeota and Crenarchaeota) [93]. In the near-surface sediment (20 cm), Desulfobacteraceae (Desulfosarcina, Desulfobacterium, and Desulfococcus) were reported as the dominant sulfate reducing bacteria followed by Desulfobulbaceae family [90]. Meanwhile, in the salt marshes sediment colonized by Spartina alterniflora plant species, Chromatiales and Thiotrichales are dominant sulfur oxidizing bacteria in the upper 5 cm sediment. Epsilonproteobacteria-related sulfur-oxidizer tended to increase on Spartina roots compared to surrounding sediment. Desulfobacteraceae and Desulfobulbaceae were also the dominant sulfate-reducing bacteria [94].

4. Conclusions and Outlook

The study shows that mixed of marine sediment and activated carbon in a wetland Plant-MFC bioanode can generate electricity and is suitable for plant growth. The Spartina anglica growth rate was different which may be caused by the mixing extent of the materials. On average, the 33AC Plant-MFC generated higher current and power density compared to other Plant-MFCs. A spatial diverse microbial community was observed in both MS100 and AC33 Plant-MFC with Proteobacteria as the most abundant phyla. It looks that the microbial communities were affected by the anode composition and also by the spatial position. Overall, the results provide new insights that show the potential to test Spartina anglica demo-scale wetlands to generate electricity. The advantage of AC over other electrode materials is the provision of additional functions like electricity storage or sediment remediation.

5. Associated Content

All data generated or analyzed during this study are included in this published article (and its Supporting Information files). Microbiota data (raw 16s rDNA amplicon sequences) is submitted to the EBI database (https://www.ebi.ac.uk/ena) under accession number PRJEB33916. Raw experimental data is available in the DANS-EASY database (https://doi.org/10.17026/dans-253-tk8w).

Supplementary Materials

The following are available online at https://www.mdpi.com/2073-4441/11/9/1810/s1, Figure S1: Plant-MFC performance on two different control modes, Figure S2: Plant condition at the beginning of the experiment (during transplantation), Figure S3: Plant conditions at the end of the experiment. Showing roots penetration; stem and leaf conditions, Figure S4: Root conditions at the end of the experiment, Figure S5: Correlation between root density and current density, Figure S6: Anode potential (black), Cathode potential (red) and Cell Potential (green) of Plant-MFCs between day 161 and 175, Figure S7: Polarization curve on day 28, Figure S8: Relative abundance of Classes within a phylum from four most abundance phyla, Table S1: Initial planted plants compositions, Table S2: Most abundant bacteria at order level with at least 5% relative abundance, Table S3: Most abundant bacteria at family level with at least 5% relative abundance, Table S4: Most abundant bacteria at genera level with at least 3% relative abundance, Table S5: Acetate concentration, pH and ionic conductivity from anolyte and catholyte of Plant-MFCs, Table S6: Dried biomass yield after 190 days, Method S1: DNA extraction protocol modification.

Author Contributions

Conceptualization, E.S. and D.P.B.T.B.S.; methodology, E.S. and D.P.B.T.B.S.; validation, E.S. and D.P.B.T.B.S.; formal analysis, E.S.; investigation, E.S.; resources, E.S. and D.P.B.T.B.S.; data curation, E.S. and D.P.B.T.B.S.; writing—Original draft preparation, E.S.; writing—Review and editing, E.S., D.P.B.T.B.S., and C.J.N.B.; visualization, E.S.; supervision, D.P.B.T.B.S. and C.J.N.B.; project administration, E.S. and D.P.B.T.B.S.; funding acquisition, E.S., D.P.B.T.B.S., and C.J.N.B.

Funding

This research was funded by Government of Landak Regency, West Kalimantan Province, Republic of Indonesia under an MoU with Wageningen University & Research, No. 6160030150.

Acknowledgments

The authors thank Andrea Aldas Vargas, Carlos Contreras Davila, Kasper de Leeuw, Pieter Gremmen, and Rieks de Rienk for their help on the DNA extraction.

Conflicts of Interest

The authors declare no conflict of interest. The funders had no role in the design of the study; in the collection, analyses, or interpretation of data; in the writing of the manuscript, or in the decision to publish the results.

References

  1. Hu, S.; Niu, Z.; Chen, Y.; Li, L.; Zhang, H. Global wetlands: Potential distribution, wetland loss, and status. Sci. Total Environ. 2017, 586, 319–327. [Google Scholar] [CrossRef]
  2. Kingsford, R.T.; Basset, A.; Jackson, L. Wetlands: Conservation’s poor cousins. Aquat. Conserv. Mar. Freshw. Ecosyst. 2016, 26, 892–916. [Google Scholar] [CrossRef]
  3. Davidson, N.C.; Finlayson, C.M. Updating global coastal wetland areas presented in Davidson and Finlayson (2018). Mar. Freshw. Res. 2019, 70, 1195–1200. [Google Scholar] [CrossRef]
  4. Dixon, M.J.R.; Loh, J.; Davidson, N.C.; Beltrame, C.; Freeman, R.; Walpole, M. Tracking global change in ecosystem area: The Wetland Extent Trends index. Biol. Conserv. 2016, 193, 27–35. [Google Scholar] [CrossRef]
  5. Bai, J.; Jia, J.; Zhang, G.; Zhao, Q.; Lu, Q.; Cui, B.; Liu, X. Spatial and temporal dynamics of heavy metal pollution and source identification in sediment cores from the short-term flooding riparian wetlands in a Chinese delta. Environ. Pollut. 2016, 219, 379–388. [Google Scholar] [CrossRef] [Green Version]
  6. Varjani, S.J.; Upasani, V.N. A new look on factors affecting microbial degradation of petroleum hydrocarbon pollutants. Int. Biodeterior. Biodegrad. 2017, 120, 71–83. [Google Scholar] [CrossRef]
  7. Patmont, C.R.; Ghosh, U.; LaRosa, P.; Menzie, C.A.; Luthy, R.G.; Greenberg, M.S.; Cornelissen, G.; Eek, E.; Collins, J.; Hull, J.; et al. In situ sediment treatment using activated carbon: A demonstrated sediment cleanup technology. Integr. Environ. Assess. Manag. 2015, 11, 195–207. [Google Scholar] [CrossRef]
  8. Karanfil, T.; Kilduff, J.E. Role of Granular Activated Carbon Surface Chemistry on the Adsorption of Organic Compounds. 1. Priority Pollutants. Environ. Sci. Technol. 1999, 33, 3217–3224. [Google Scholar] [CrossRef]
  9. Li, L.; Quinlivan, P.A.; Knappe, D.R.U. Effects of activated carbon surface chemistry and pore structure on the adsorption of organic contaminants from aqueous solution. Carbon 2002, 40, 2085–2100. [Google Scholar] [CrossRef]
  10. Lee, J.; Kim, J.; Hyeon, T. Recent Progress in the Synthesis of Porous Carbon Materials. Adv. Mater. 2006, 18, 2073–2094. [Google Scholar] [CrossRef]
  11. Tender, L.M.; Reimers, C.E.; Stecher, H.A., III; Holmes, D.E.; Bond, D.R.; Lowy, D.A.; Pilobello, K.; Fertig, S.J.; Lovley, D.R. Harnessing microbially generated power on the seafloor. Nat. Biotechnol. 2002, 20, 821–825. [Google Scholar] [CrossRef]
  12. Abbas, S.Z.; Rafatullah, M.; Ismail, N.; Syakir, M.I. A review on sediment microbial fuel cells as a new source of sustainable energy and heavy metal remediation: Mechanisms and future prospective. Int. J. Energy Res. 2017, 41, 1242–1264. [Google Scholar] [CrossRef]
  13. Xu, P.; Xiao, E.-R.; Xu, D.; Zhou, Y.; He, F.; Liu, B.-Y.; Zeng, L.; Wu, Z.-B. Internal nitrogen removal from sediments by the hybrid system of microbial fuel cells and submerged aquatic plants. PLoS ONE 2017, 12, e0172757. [Google Scholar] [CrossRef]
  14. Zhou, Y.-L.; Wu, H.-F.; Yan, Z.-S.; Cai, H.-Y.; Jiang, H.-L. The enhanced survival of submerged macrophyte Potamogeton malaianus by sediment microbial fuel cells. Ecol. Eng. 2016, 87, 254–262. [Google Scholar] [CrossRef]
  15. Strik, D.P.B.T.B.; Hamelers (Bert), H.V.M.; Snel, J.F.H.; Buisman, C.J.N. Green electricity production with living plants and bacteria in a fuel cell. Int. J. Energy Res. 2008, 32, 870–876. [Google Scholar] [CrossRef]
  16. Ueoka, N.; Sese, N.; Sue, M.; Kouzuma, A.; Watanabe, K. Sizes of Anode and Cathode Affect Electricity Generation in Rice Paddy-Field Microbial Fuel Cells. J. Sustain. Bioenergy Syst. 2016, 6, 10–15. [Google Scholar] [CrossRef] [Green Version]
  17. Kaku, N.; Yonezawa, N.; Kodama, Y.; Watanabe, K. Plant/microbe cooperation for electricity generation in a rice paddy field. Appl. Microbiol. Biotechnol. 2008, 79, 43–49. [Google Scholar] [CrossRef]
  18. Takanezawa, K.; Nishio, K.; Kato, S.; Hashimoto, K.; Watanabe, K. Factors Affecting Electric Output from Rice-Paddy Microbial Fuel Cells. Biosci. Biotechnol. Biochem. 2010, 74, 1271–1273. [Google Scholar] [CrossRef] [Green Version]
  19. Kouzuma, A.; Kaku, N.; Watanabe, K. Microbial electricity generation in rice paddy fields: Recent advances and perspectives in rhizosphere microbial fuel cells. Appl. Microbiol. Biotechnol. 2014, 98, 9521–9526. [Google Scholar] [CrossRef]
  20. Helder, M.; Strik, D.P.B.T.B.; Hamelers, H.V.M.; Kuhn, A.J.; Blok, C.; Buisman, C.J.N. Concurrent bio-electricity and biomass production in three Plant-Microbial Fuel Cells using Spartina anglica, Arundinella anomala and Arundo donax. Bioresour. Technol. 2010, 101, 3541–3547. [Google Scholar] [CrossRef]
  21. Helder, M.; Strik, D.P.B.T.B.; Hamelers, H.V.M.; Kuijken, R.C.P.; Buisman, C.J.N. New plant-growth medium for increased power output of the Plant-Microbial Fuel Cell. Bioresour. Technol. 2012, 104, 417–423. [Google Scholar] [CrossRef]
  22. Timmers, R.A.; Strik, D.P.B.T.B.; Hamelers, H.V.M.; Buisman, C.J.N. Characterization of the internal resistance of a plant microbial fuel cell. Electrochim. Acta 2012, 72, 165–171. [Google Scholar] [CrossRef]
  23. Wetser, K.; Liu, J.; Buisman, C.; Strik, D. Plant microbial fuel cell applied in wetlands: Spatial, temporal and potential electricity generation of Spartina anglica salt marshes and Phragmites australis peat soils. Biomass Bioenergy 2015, 83, 543–550. [Google Scholar] [CrossRef]
  24. Helder, M.; Strik, D.P.; Hamelers, H.V.; Buisman, C.J. The flat-plate plant-microbial fuel cell: The effect of a new design on internal resistances. Biotechnol. Biofuels 2012, 5, 70. [Google Scholar] [CrossRef] [PubMed]
  25. Wetser, K.; Dieleman, K.; Buisman, C.; Strik, D. Electricity from wetlands: Tubular plant microbial fuels with silicone gas-diffusion biocathodes. Appl. Energy 2017, 185, 642–649. [Google Scholar] [CrossRef] [Green Version]
  26. Timmers, R.A.; Strik, D.P.B.T.B.; Hamelers, H.V.M.; Buisman, C.J.N. Electricity generation by a novel design tubular plant microbial fuel cell. Biomass Bioenergy 2013, 51, 60–67. [Google Scholar] [CrossRef]
  27. Schamphelaire, L.D.; Bossche, L.V.D.; Dang, H.S.; Höfte, M.; Boon, N.; Rabaey, K.; Verstraete, W. Microbial Fuel Cells Generating Electricity from Rhizodeposits of Rice Plants. Environ. Sci. Technol. 2008, 42, 3053–3058. [Google Scholar] [CrossRef]
  28. Wetser, K.; Sudirjo, E.; Buisman, C.J.N.; Strik, D.P.B.T.B. Electricity generation by a plant microbial fuel cell with an integrated oxygen reducing biocathode. Appl. Energy 2015, 137, 151–157. [Google Scholar] [CrossRef]
  29. Wetser, K. Electricity from Wetlands: Technology Assessment of the Tubular Plant Microbial Fuel Cell with an Integrated Biocathode. Ph.D. Thesis, Wageningen University & Research, Wageningen, The Netherlands, 2016. [Google Scholar]
  30. Kabutey, F.T.; Zhao, Q.; Wei, L.; Ding, J.; Antwi, P.; Quashie, F.K.; Wang, W. An overview of plant microbial fuel cells (PMFCs): Configurations and applications. Renew. Sustain. Energy Rev. 2019, 110, 402–414. [Google Scholar] [CrossRef]
  31. Helder, M.; Chen, W.-S.; van der Harst, E.J.M.; Strik, D.P.B.T.B.; Hamelers, H.V.M.; Buisman, C.J.N.; Potting, J. Electricity production with living plants on a green roof: Environmental performance of the plant-microbial fuel cell. Biofuels Bioprod. Biorefin. 2013, 7, 52–64. [Google Scholar] [CrossRef]
  32. Timmers, R.A.; Strik, D.P.B.T.B.; Hamelers, H.V.M.; Buisman, C.J.N. Long-term performance of a plant microbial fuel cell with Spartina anglica. Appl. Microbiol. Biotechnol. 2010, 86, 973–981. [Google Scholar] [CrossRef] [PubMed]
  33. Gray, A.J.; Marshall, D.F.; Raybould, A.F. A Century of Evolution in Spartina anglica. In Advances in Ecological Research; Begon, M., Fitter, A.H., Macfadyen, A., Eds.; Academic Press: Cambridge, MA, USA, 1991; Volume 21, pp. 1–62. ISBN 0065-2504. [Google Scholar]
  34. Raybould, A.F.; Gray, A.J.; Lawrence, M.J.; Marshall, D.F. The evolution of Spartina anglica C. E. Hubbard (Gramineae): Genetic variation and status of the parental species in Britain. Biol. J. Linn. Soc. 1991, 44, 369–380. [Google Scholar] [CrossRef]
  35. Nehring, S.; Adsersen, H. NOBANIS—Invasive Alien Species Fact Sheet—Spartina Anglica.-From: Online Database of the European Network on Invasive Alien Species-NOBANIS. 2006. Available online: https://www.nobanis.org/globalassets/speciesinfo/s/spartina-anglica/spartina_anglica.pdf (accessed on 28 January 2019).
  36. Nitisoravut, R.; Regmi, R. Plant microbial fuel cells: A promising biosystems engineering. Renew. Sustain. Energy Rev. 2017, 76, 81–89. [Google Scholar] [CrossRef]
  37. Salinas-Juárez, M.G.; Roquero, P.; Durán-Domínguez-de-Bazúa, M.D.C. Plant and microorganisms support media for electricity generation in biological fuel cells with living hydrophytes. Bioelectrochemistry 2016, 112, 145–152. [Google Scholar] [CrossRef] [PubMed]
  38. Arends, J.B.A.; Speeckaert, J.; Blondeel, E.; De Vrieze, J.; Boeckx, P.; Verstraete, W.; Rabaey, K.; Boon, N. Greenhouse gas emissions from rice microcosms amended with a plant microbial fuel cell. Appl. Microbiol. Biotechnol. 2014, 98, 3205–3217. [Google Scholar] [CrossRef] [PubMed]
  39. Timmers, R.A.; Rothballer, M.; Strik, D.P.B.T.B.; Engel, M.; Schulz, S.; Schloter, M.; Hartmann, A.; Hamelers, B.; Buisman, C. Microbial community structure elucidates performance of Glyceria maxima plant microbial fuel cell. Appl. Microbiol. Biotechnol. 2012, 94, 537–548. [Google Scholar] [CrossRef] [Green Version]
  40. Bombelli, P.; Iyer, D.M.R.; Covshoff, S.; McCormick, A.J.; Yunus, K.; Hibberd, J.M.; Fisher, A.C.; Howe, C.J. Comparison of power output by rice (Oryza sativa) and an associated weed (Echinochloa glabrescens) in vascular plant bio-photovoltaic (VP-BPV) systems. Appl. Microbiol. Biotechnol. 2013, 97, 429–438. [Google Scholar] [CrossRef]
  41. Regmi, R.; Nitisoravut, R.; Charoenroongtavee, S.; Yimkhaophong, W.; Phanthurat, O. Earthen Pot–Plant Microbial Fuel Cell Powered by Vetiver for Bioelectricity Production and Wastewater Treatment. CLEAN Soil Air Water 2018, 46, 1700193. [Google Scholar] [CrossRef]
  42. Md Khudzari, J.; Gariépy, Y.; Kurian, J.; Tartakovsky, B.; Raghavan, G.S.V. Effects of biochar anodes in rice plant microbial fuel cells on the production of bioelectricity, biomass, and methane. Biochem. Eng. J. 2019, 141, 190–199. [Google Scholar] [CrossRef]
  43. Borsje, C.; Liu, D.; Sleutels, T.H.J.A.; Buisman, C.J.N.; ter Heijne, A. Performance of single carbon granules as perspective for larger scale capacitive bioanodes. J. Power Sources 2016, 325, 690–696. [Google Scholar] [CrossRef] [Green Version]
  44. Borsje, C.; Sleutels, T.; Saakes, M.; Buisman, C.J.N.; ter Heijne, A. The Granular Capacitive Moving Bed Reactor for the scale up of bioanodes. J. Chem. Technol. Biotechnol. 2019, 94, 2738–2748. [Google Scholar] [CrossRef]
  45. Sudirjo, E.; Buisman, C.J.N.; Strik, D.P.B.T.B. Marine Sediment Mixed with Activated Carbon Allows Electricity Production and Storage from Internal and External Energy Sources: A New Rechargeable Bio-Battery with Bi-Directional Electron Transfer Properties. Front. Microbiol. 2019, 10, 934. [Google Scholar] [CrossRef] [PubMed]
  46. Sudirjo, E.; Buisman, C.J.N.; Strik, D.P.B.T.B. Electricity generation from wetlands with activated carbon bioanode. IOP Conf. Ser. Earth Environ. Sci. 2018, 131, 012046. [Google Scholar] [CrossRef]
  47. Alslaibi, T.M.; Abustan, I.; Ahmad, M.A.; Foul, A.A. A review: Production of activated carbon from agricultural byproducts via conventional and microwave heating. J. Chem. Technol. Biotechnol. 2013, 88, 1183–1190. [Google Scholar] [CrossRef]
  48. Menya, E.; Olupot, P.W.; Storz, H.; Lubwama, M.; Kiros, Y. Production and performance of activated carbon from rice husks for removal of natural organic matter from water: A review. Chem. Eng. Res. Des. 2018, 129, 271–296. [Google Scholar] [CrossRef]
  49. Hale, S.E.; Jensen, J.; Jakob, L.; Oleszczuk, P.; Hartnik, T.; Henriksen, T.; Okkenhaug, G.; Martinsen, V.; Cornelissen, G. Short-Term Effect of the Soil Amendments Activated Carbon, Biochar, and Ferric Oxyhydroxide on Bacteria and Invertebrates. Environ. Sci. Technol. 2013, 47, 8674–8683. [Google Scholar] [CrossRef] [PubMed]
  50. Igalavithana, A.D.; Ok, Y.S.; Usman, A.R.A.; Al-Wabel, M.I.; Oleszczuk, P.; Lee, S.S. The Effects of Biochar Amendment on Soil Fertility. In Agricultural and Environmental Applications of Biochar: Advances and Barriers; SSSA Special Publication, Soil Science Society of America, Inc.: Madison, WI, USA, 2016; pp. 123–144. ISBN 978-0-89118-967-1. [Google Scholar]
  51. Bakker, J.P. Restoration of Salt Marshes. In Restoration Ecology: The New Frontier; Andel, J.V., Aronson, J., Eds.; Wiley-Blackwell: Hoboken, NJ, USA, 2012; pp. 248–262. ISBN 978-1-4443-3636-8. [Google Scholar] [Green Version]
  52. Deltares Pioneer Salt Marsh Restoration for Coastal Protection—Eastern Scheldt, NL. Available online: https://publicwiki.deltares.nl/display/BTG/Pioneer+salt+marsh+restoration+for+coastal+protection+-+Eastern+Scheldt%2C+NL (accessed on 1 July 2019).
  53. Wetland International Building with Nature Indonesia—Reaching Scale for Coastal Resilience. Available online: https://www.wetlands.org/publications/building-with-nature-in-indonesia/ (accessed on 1 July 2019).
  54. Jourdin, L.; Raes, S.M.T.; Buisman, C.J.N.; Strik, D.P.B.T.B. Critical Biofilm Growth throughout Unmodified Carbon Felts Allows Continuous Bioelectrochemical Chain Elongation from CO2 up to Caproate at High Current Density. Front. Energy Res. 2018, 6, 7. [Google Scholar] [CrossRef]
  55. De Smit, S.M.; de Leeuw, K.D.; Buisman, C.J.N.; Strik, D.P.B.T.B. Continuous n-valerate formation from propionate and methanol in an anaerobic chain elongation open-culture bioreactor. Biotechnol. Biofuels 2019, 12, 132. [Google Scholar] [CrossRef] [PubMed]
  56. Takahashi, S.; Tomita, J.; Nishioka, K.; Hisada, T.; Nishijima, M. Development of a Prokaryotic Universal Primer for Simultaneous Analysis of Bacteria and Archaea Using Next-Generation Sequencing. PLoS ONE 2014, 9, e105592. [Google Scholar] [CrossRef]
  57. Edgar, R.C. Search and clustering orders of magnitude faster than BLAST. Bioinformatics 2010, 26, 2460–2461. [Google Scholar] [CrossRef] [Green Version]
  58. Quast, C.; Pruesse, E.; Yilmaz, P.; Gerken, J.; Schweer, T.; Yarza, P.; Peplies, J.; Glöckner, F.O. The SILVA ribosomal RNA gene database project: Improved data processing and web-based tools. Nucleic Acids Res. 2012, 41, D590–D596. [Google Scholar] [CrossRef] [PubMed]
  59. Wang, Q.; Garrity, G.M.; Tiedje, J.M.; Cole, J.R. Naive Bayesian classifier for rapid assignment of rRNA sequences into the new bacterial taxonomy. Appl. Environ. Microbiol. 2007, 73, 5261–5267. [Google Scholar] [CrossRef] [PubMed]
  60. Caporaso, J.G.; Kuczynski, J.; Stombaugh, J.; Bittinger, K.; Bushman, F.D.; Costello, E.K.; Fierer, N.; Peña, A.G.; Goodrich, J.K.; Gordon, J.I.; et al. QIIME allows analysis of high-throughput community sequencing data. Nat. Methods 2010, 7, 335–336. [Google Scholar] [CrossRef] [PubMed] [Green Version]
  61. Koo, H.; Hakim, J.A.; Morrow, C.D.; Andersen, D.T.; Bej, A.K. Chapter 9—Microbial Community Composition and Predicted Functional Attributes of Antarctic Lithobionts Using Targeted Next-Generation Sequencing and Bioinformatics Tools. In Methods in Microbiology; Gurtler, V., Trevors, J.T., Eds.; Academic Press: Cambridge, MA, USA, 2018; Volume 45, pp. 243–290. ISBN 0580-9517. [Google Scholar]
  62. Giusti, D.M.; Conway, R.A.; Lawson, C.T. Activated Carbon Adsorption of Petrochemicals. J. Water Pollut. Control Fed. 1974, 46, 947–965. [Google Scholar]
  63. Mugisidi, D.; Ranaldo, A.; Soedarsono, J.W.; Hikam, M. Modification of activated carbon using sodium acetate and its regeneration using sodium hydroxide for the adsorption of copper from aqueous solution. Carbon 2007, 45, 1081–1084. [Google Scholar] [CrossRef]
  64. Wilson, K.; Yang, H.; Seo, C.W.; Marshall, W.E. Select metal adsorption by activated carbon made from peanut shells. Bioresour. Technol. 2006, 97, 2266–2270. [Google Scholar] [CrossRef] [PubMed]
  65. Wang, C.-M.; Chung, T.-W.; Huang, C.-M.; Wu, H. Adsorption Equilibria of Acetate Compounds on Activated Carbon, Silica Gel, and 13X Zeolite. J. Chem. Eng. Data 2005, 50, 811–816. [Google Scholar] [CrossRef]
  66. Wang, Z.; Nie, E.; Li, J.; Yang, M.; Zhao, Y.; Luo, X.; Zheng, Z. Equilibrium and kinetics of adsorption of phosphate onto iron-doped activated carbon. Environ. Sci. Pollut. Res. 2012, 19, 2908–2917. [Google Scholar] [CrossRef] [PubMed]
  67. Boopathy, R.; Karthikeyan, S.; Mandal, A.B.; Sekaran, G. Adsorption of ammonium ion by coconut shell-activated carbon from aqueous solution: Kinetic, isotherm, and thermodynamic studies. Environ. Sci. Pollut. Res. 2013, 20, 533–542. [Google Scholar] [CrossRef]
  68. Demiral, H.; Gündüzoğlu, G. Removal of nitrate from aqueous solutions by activated carbon prepared from sugar beet bagasse. Bioresour. Technol. 2010, 101, 1675–1680. [Google Scholar] [CrossRef]
  69. Hong, S.; Cannon, F.S.; Hou, P.; Byrne, T.; Nieto-Delgado, C. Sulfate removal from acid mine drainage using polypyrrole-grafted granular activated carbon. Carbon 2014, 73, 51–60. [Google Scholar] [CrossRef]
  70. Bolan, N.S.; Elliott, J.; Gregg, P.E.H.; Weil, S. Enhanced dissolution of phosphate rocks in the rhizosphere. Biol. Fertil. Soils 1997, 24, 169–174. [Google Scholar] [CrossRef]
  71. Lambers, H.; Clements, J.C.; Nelson, M.N. How a phosphorus-acquisition strategy based on carboxylate exudation powers the success and agronomic potential of lupines (Lupinus, Fabaceae). Am. J. Bot. 2013, 100, 263–288. [Google Scholar] [CrossRef] [PubMed]
  72. Seiter, K.; Hensen, C.; Schröter, J.; Zabel, M. Organic carbon content in surface sediments—Defining regional provinces. Deep Sea Res. Part Oceanogr. Res. Pap. 2004, 51, 2001–2026. [Google Scholar] [CrossRef]
  73. Reish, D.J. Annelid. Encycl. Br. 2013. Available online: https://www.nobanis.org/globalassets/speciesinfo/s/spartina-anglica/spartina_anglica.pdf (accessed on 1 July 2019).
  74. Cunha, L.; Brown, G.G.; Stanton, D.W.G.; Da Silva, E.; Hansel, F.A.; Jorge, G.; McKey, D.; Vidal-Torrado, P.; Macedo, R.S.; Velasquez, E.; et al. Soil Animals and Pedogenesis: The Role of Earthworms in Anthropogenic Soils. Soil Sci. 2016, 181, 110–125. [Google Scholar] [CrossRef]
  75. Deeke, A.; Sleutels, T.H.J.A.; Hamelers, H.V.M.; Buisman, C.J.N. Capacitive Bioanodes Enable Renewable Energy Storage in Microbial Fuel Cells. Environ. Sci. Technol. 2012, 46, 3554–3560. [Google Scholar] [CrossRef] [PubMed]
  76. Liu, B.; Ji, M.; Zhai, H. Anodic potentials, electricity generation and bacterial community as affected by plant roots in sediment microbial fuel cell: Effects of anode locations. Chemosphere 2018, 209, 739–747. [Google Scholar] [CrossRef]
  77. Osorio de la Rosa, E.; Vázquez Castillo, J.; Carmona Campos, M.; Barbosa Pool, R.G.; Becerra Nuñez, G.; Castillo Atoche, A.; Ortegón Aguilar, J. Plant Microbial Fuel Cells–Based Energy Harvester System for Self-powered IoT Applications. Sensors 2019, 19, 1378. [Google Scholar] [CrossRef]
  78. Koop-Jakobsen, K.; Wenzhöfer, F. The Dynamics of Plant-Mediated Sediment Oxygenation in Spartina anglica Rhizospheres—A Planar Optode Study. Estuaries Coasts 2015, 38, 951–963. [Google Scholar] [CrossRef]
  79. Timmers, R.A.; Strik, D.P.B.T.B.; Arampatzoglou, C.; Buisman, C.J.N.; Hamelers, H.V.M. Rhizosphere anode model explains high oxygen levels during operation of a Glyceria maxima PMFC. Bioresour. Technol. 2012, 108, 60–67. [Google Scholar] [CrossRef] [PubMed]
  80. Arends, J.B.A.; Blondeel, E.; Tennison, S.R.; Boon, N.; Verstraete, W. Suitability of granular carbon as an anode material for sediment microbial fuel cells. J. Soils Sediments 2012, 12, 1197–1206. [Google Scholar] [CrossRef] [Green Version]
  81. Malvankar, N.S.; King, G.M.; Lovley, D.R. Centimeter-long electron transport in marine sediments via conductive minerals. ISME J. 2014, 9, 527–531. [Google Scholar] [CrossRef] [PubMed]
  82. Caizán-Juanarena, L.; Servin-Balderas, I.; Chen, X.; Buisman, C.J.N.; ter Heijne, A. Electrochemical and microbiological characterization of single carbon granules in a multi-anode microbial fuel cell. J. Power Sources 2019. [Google Scholar] [CrossRef]
  83. Fang, Z.; Cheng, S.; Wang, H.; Cao, X.; Li, X. Feasibility study of simultaneous azo dye decolorization and bioelectricity generation by microbial fuel cell-coupled constructed wetland: Substrate effects. RSC Adv. 2017, 7, 16542–16552. [Google Scholar] [CrossRef]
  84. Song, H.; Zhang, S.; Long, X.; Yang, X.; Li, H.; Xiang, W. Optimization of Bioelectricity Generation in Constructed Wetland-Coupled Microbial Fuel Cell Systems. Water 2017, 9, 185. [Google Scholar] [CrossRef]
  85. Liu, S.; Song, H.; Li, X.; Yang, F. Power Generation Enhancement by Utilizing Plant Photosynthate in Microbial Fuel Cell Coupled Constructed Wetland System. Int. J. Photoenergy 2013, 2013, 172010. [Google Scholar] [CrossRef]
  86. Tapia, N.F.; Rojas, C.; Bonilla, C.A.; Vargas, I.T. A New Method for Sensing Soil Water Content in Green Roofs Using Plant Microbial Fuel Cells. Sensors 2017, 18, 71. [Google Scholar] [CrossRef]
  87. Lasher, C.; Dyszynski, G.; Everett, K.; Edmonds, J.; Ye, W.; Sheldon, W.; Wang, S.; Joye, S.B.; Moran, M.A.; Whitman, W.B. The Diverse Bacterial Community in Intertidal, Anaerobic Sediments at Sapelo Island, Georgia. Microb. Ecol. 2009, 58, 244–261. [Google Scholar] [CrossRef] [Green Version]
  88. Wang, M.; Chen, J.-K.; Li, B. Characterization of Bacterial Community Structure and Diversity in Rhizosphere Soils of Three Plants in Rapidly Changing Salt Marshes Using 16S rDNA. Pedosphere 2007, 17, 545–556. [Google Scholar] [CrossRef]
  89. Wang, M.; Yang, P.; Falcão Salles, J. Distribution of Root-Associated Bacterial Communities along a Salt-Marsh Primary Succession. Front. Plant Sci. 2016, 6, 1188. [Google Scholar] [CrossRef] [PubMed]
  90. Leloup, J.; Fossing, H.; Kohls, K.; Holmkvist, L.; Borowski, C.; Jørgensen, B.B. Sulfate-reducing bacteria in marine sediment (Aarhus Bay, Denmark): Abundance and diversity related to geochemical zonation. Environ. Microbiol. 2009, 11, 1278–1291. [Google Scholar] [CrossRef] [PubMed]
  91. Burdorf, L.D.W.; Tramper, A.; Seitaj, D.; Meire, L.; Hidalgo-Martinez, S.; Zetsche, E.-M.; Boschker, H.T.S.; Meysman, F.J.R. Long-distance electron transport occurs globally in marine sediments. Biogeosciences 2017, 14, 683–701. [Google Scholar] [CrossRef] [Green Version]
  92. Larsen, S.; Nielsen, L.P.; Schramm, A. Cable bacteria associated with long-distance electron transport in New England salt marsh sediment. Environ. Microbiol. Rep. 2015, 7, 175–179. [Google Scholar] [CrossRef] [PubMed]
  93. Barton, L.L.; Fauque, G.D. Chapter 2 Biochemistry, Physiology and Biotechnology of Sulfate-Reducing Bacteria. In Advances in Applied Microbiology; Academic Press: Cambridge, MA, USA, 2009; Volume 68, pp. 41–98. ISBN 0065-2164. [Google Scholar]
  94. Thomas, F.; Giblin, A.E.; Cardon, Z.G.; Sievert, S.M. Rhizosphere heterogeneity shapes abundance and activity of sulfur-oxidizing bacteria in vegetated salt marsh sediments. Front. Microbiol. 2014, 5, 309. [Google Scholar] [CrossRef] [Green Version]
Figure 1. Full-grown Spartina anglica in Plant-MFC 3 (MS100); (A) inside the climate chamber and (B) at the end of the experiment.
Water 11 01810 g001
Figure 2. DNA analysis sampling points.
Water 11 01810 g002
Figure 3. Average number of living stems on different Plant-MFC reactors.
Water 11 01810 g003
Figure 4. Accumulative total stems height on different Plant-MFC reactors.
Water 11 01810 g004
Figure 5. Worms in the anode Plant-MFC 3 (MS100) surviving during 190 day operation.
Water 11 01810 g005aWater 11 01810 g005b
Figure 6. Average current output (mA/m2 plant growth area (PGA)) of Plant-MFC with variation bar. The current output reached zero when anodes were dried.
Water 11 01810 g006
Figure 7. Unweighted UniFrac Principal Coordinates Analysis (PCoA) of Plant-MFC microbial communities.
Water 11 01810 g007
Figure 8. Bacterial and archea phyla.
Water 11 01810 g008
Table 1. Average and maximum current and power densities of several Plant-MFC systems.
Reactor Type/Plant SpeciesAnode/Current CollectorCathodeCurrent Density (mA/m2 PGA)Power Density (mW/m2 PGA)MethodRef.
Av.MaxAv.Max
Flat plate
Spartina anglica
Marine sediment/small graphite rod (MS100)Graphite felt, air cathode9.0115.490.370.91AThis study
(2 weeks)45 *(2 weeks)8 *
-(0.3 A/m3) *-(46 mW/m3) *D
Flat plate
Spartina anglica
33% AC + 67% marine sediment/small graphite rod (AC33)Graphite felt, air cathode16.0122.531.041.93AThis study
(2 weeks)819 *(2 weeks)148*
-(4.8 A/m3) *-(863 mW/m3) *D
Flat plate
Spartina anglica
67% AC + 33% marine sediment/small graphite rod (AC67)Graphite felt, air cathode5.468.420.120.27AThis study
(2 weeks)12,496 *(2 weeks)2249*
-(73 A/m3) *-(13,150 mW/m3) *D
Flat plate
Spartina anglica
AC/small graphite rod (AC100)Graphite felt, air cathode0.21.580.000.00AThis study
(2 weeks)19,752 *(2 weeks)3555 *
-11.5 A/m3 *-(20,786 mW/m3) *D
Flat-plate
Spartina anglica
Graphite felt/gold wireGraphite felt, Ferric cyanide cathode74–384 (4 weeks)46947–155 (4 weeks)211A[21]
Cylindrical
Spartina anglica
Graphite grain/Graphite rodGraphite felt/gold wire, Potassium ferric cyanide--21-A[20]
(8 weeks)
---222C
Flat plate with two cathode compartments
Spartina anglica
Graphite felt/golden wireGraphite felt/golden wire, oxygen reducing biocathode---679C[28]
240
--(2 weeks)-B
Polyacrylic plastic cylinder
Ipomoea aquatica
Granular activated carbon/stainless steel meshGranular activated carbon/stainless steel mesh, air cathode-0.66 A/m3-274 mW/m3C[83]
Organic glass pipe
Phragmites australis
Activated granular carbon/stainless steel meshActivated granular carbon, air cathode-0.49 A/m3-4.5 (200 mW/m3)C[84]
Polycarbonate plastic cylinder
Ipomoea aquatica
Thick granular activated carbon/titanium wireStainless steel mesh, air cathode---12.42C[85]
Glass cylinder
Spartina anglica
Graphite granules/golden wireGraphite felt, air cathode---79C[32]
Modular
Sedum species
Carbon feltAC/graphite rood, air cathode-5-114.6 (μW/m2)C[86]
Perspex tubes
Rice(Oryza sativa)
Graphite granule/vermiculite/carbon rodGraphite felt interwoven carbon rod, air cathode-580-72D[38]
Circular graphite felt electrode in a rice paddy field
Rice (Oryza sativa)
Graphite felt connected via epoxy encapsulated wiresGraphite felt with platinum catalyst connected via epoxy encapsulated wires, air cathode---140D[16]
Method of operation: A: Continuous operation at 1000 ohm; B: 2 week continuous operation at 600 mV cell voltage controlled with potentiostaat; C: Polarization curve with external resistance; D: Potentiostat polarization; PGA = Plant growth area. Hyphens mean data are not calculated/not available. * These maximum power outputs were done at day 28 during the potentiostatic control mode (SI Figure S7). The high current and power density could be influenced by capacitive properties of the anode material that was charged and discharged using external power. This power could be utilized with care to e.g., harvest a peak power to charge external capacitors or provide a power peak to start-up small electronic devices. These high current and power outputs are not to be considered as actual performance of the sediment/plant microbial fuel cell since they do not represent a long-term performance and are the result of the potentiostatic operation.

