Impacts of Climate Change on the Hydro-Climate of Peninsular Malaysia
by
 ,
,
Ir. Mohd Zaki bin Mat Amin
1, 
Ali Ercan
2,*,
Kei Ishida
3,
M. Levent Kavvas
2,
Z.Q. Chen
4 and
Su-Hyung Jang
5 1
National Hydraulic Research Institute of Malaysia, Kuala Lumpur 43300, Malaysia
2
J. Amorocho Hydraulics Laboratory (JAHL), Department of Civil and Environmental Engineering, University of California-Davis, CA 95616, USA
3
Department of Civil and Environmental Engineering, Kumamoto University, Kumamoto 860-8555, Japan
4
Private Consultant, Davis, California, CA 95616, USA
5
K-water Institute, K-water, Daejeon 34045, Korea
*
Author to whom correspondence should be addressed.
Water 2019, 11(9), 1798; https://doi.org/10.3390/w11091798
Submission received: 16 July 2019
/
Revised: 22 August 2019
/
Accepted: 23 August 2019
/
Published: 29 August 2019
(This article belongs to the Section Hydrology)
Abstract
:In this study, a regional climate model was used to dynamically downscale 15 future climate projections from three GCMs covering four emission scenarios (SRES B1, A1FI, A1B, A2) based on Coupled Model Intercomparison Project phase 3 (CMIP3) datasets to 6-km horizontal resolution over the whole Peninsular Malaysia. Impacts of climate change in the 21st century on the precipitation, air temperature, and soil water storage were assessed covering ten watersheds and twelve coastal regions. Then, by coupling a physical hydrology model with the regional climate model, the impacts of the climate change on river flows were assessed at the outlets of ten watersheds in Peninsular Malaysia. It was found that the increase in the 30-year mean annual precipitation from 1970–2000 to 2070–2100 will vary from 17.1 to 36.3 percent among the ten watersheds, and from 22.9 to 45.4 percent among twelve coastal regions. The ensemble average of the basin-average annual mean air temperature will increase about 2.52 °C to 2.95 °C from 2010 to 2100. In comparison to the historical period, the change in the 30-year mean basin-average annual mean soil water storage over the ten watersheds will vary from 0.7 to 10.9 percent at the end of 21st century, and that over the twelve coastal regions will vary from −1.7 to 15.8 percent. Ensemble averages of the annual mean flows of the 15 projections show increasing trends for the 10 watersheds, especially in the second half of the 21st century. In comparison to the historical period, the change in the 30-year average annual mean flows will vary from −2.1 to 14.3 percent in the early 21st century, 4.4 to 23.8 percent in the middle 21st century, and 19.1 to 45.8 percent in the end of 21st century.
1. Introduction
Global climate change nowadays needs to be taken into consideration for a sustainable and resilient water management and planning, which, in turn, affects the socio-economic development of a region. As reported by Intergovernmental Panel on Climate Change in 2013 [1], hydrologic regimes are changing under the changing climate of the earth. An aspect of global climate change is a change in air temperature over the globe. Air temperature rise will increase moisture holding capacity of air. The water holding capacity of air increases by about 7% per 1 °C warming, and such a trend could result in increased water vapor in the atmosphere, and therefore may produce intense precipitation events [2]. Higher air temperature also causes higher evaporation rates and surface drying, therefore increasing the intensity and duration of droughts [2]. Other factors, such as, atmospheric thermodynamics and dynamics play important roles in extreme precipitation as well ([3]; and the references therein).
Mukherjee et al. [4] have shown the frequency and intensity of extreme precipitation events have increased in India during the last few decades. Hurricane Harvey in 2017 brought record-breaking precipitation in Texas, USA and the resulting stormwater was observed to cause dramatic changes in hydrodynamics in coastal systems [5].
Hydrologic variability is correlated with the economic development of nations and may have adverse socio-economic impacts, particularly for many developing countries whose economies have already been influenced by climate factors [6]. For example, a study using an economy-wide model that included hydrologic variability effects, found that the occurrence of droughts and floods reduced economic growth by more than one third in Ethiopia [7]. Floods during 1997–1998 associated with El Niño, and the drought during 1998–2000 associated with La Niña caused annual reduction in gross domestic product (GDP) in Kenya by 10 to 16 percent [8].
Meanwhile, precipitation is one of the major inputs for modeling hydrological processes in a watershed. Evapotranspiration, which is also sensitive to air temperature, affects the water budget of a watershed. Soil moisture at the beginning of a flood or a drought will affect its severity. Changing climate regimes also affect coastal hydrology, water quality, and ecosystems [9,10].
Change in climate will significantly affect water cycle in a watershed, which involves non-linear and sophisticated physical processes that occur over a wide range of spatial and temporal scales. A comprehensive analysis is imperative to address climate change impacts on interrelated hydro-climate processes at watershed or regional scales. Therefore, climate change impacts on hydro-climate processes must be taken into account by a robust and holistic approach. In the dynamical downscaling approach, the full equations of mass, energy, and momentum conservation are utilized by the state-of-art Global Circulation Models (GCMs) to model physical interactions of land–atmosphere processes with consideration of the heterogeneity in topography, soil and vegetation over a region [11].
Several investigations of the historical hydro-climatic observations are available in literature over Peninsular Malaysia. Suhaila and Jemain [12] investigated the adjoining wet days during 1975 to 2004 using the daily rainfall data from 50 rain gauge stations which represent east, southwest, west and northwest regions of Peninsular Malaysia. Mayowa et al. [13] investigated rainfall-related extremes (such as, maximum daily rainfall, number of rainy days, average rainfall intensity, heavy rainfall days, extreme rainfall days, and precipitation concentration index) during 1971-2010 in the east coast of Peninsular Malaysia using 54 observation stations. Tangang et al. [14] investigated variations in precipitation extremes associated with El Nino and La Nina events based on the observed daily precipitation dataset of 23 meteorological stations in Malaysia during 1966 to 2011. Syafrina et al. [15] analyzed hourly rainfall data between 1975 and 2010 across the Peninsular Malaysia for trends in extreme rainfall events during the northeast monsoon (November–February), the southwest monsoon (May–August), and the two inter-monsoon seasons. The extreme rainfall events in Peninsular Malaysia showed an increasing trend between the years 1975 and 2010. Wong et al. [16] created a gridded daily hydrometeorological data set (for precipitation, surface pressure, temperature, specific humidity and wind speed) for Peninsular Malaysia at 0.05° spatial resolution for the period 1975–2004 using stations from different sources and interpolating the data using the angular-distance weighting method. Wong et al. also evaluated the data set and found that it generally confirms and extends the findings of earlier studies.
Investigations of the future hydro-climatic processes over Peninsular Malaysia due to climate change are very limited in literature. Shaaban et al. [17] assessed the water resources in Peninsular Malaysia during the 2025–2034 and 2041–2050 periods in comparison to 1984–1993 historical period based on one realization of the Coupled General Circulation Model of the Canadian Center for Climate Modeling and Analysis. Amin et al. [18] investigated future hydrologic conditions over Muda and Dungun watersheds in Peninsular Malaysia, by analyzing the river flows with respect to monthly climatology, long terms trends by time series analysis, and changes in the frequency curves in the first and second halves of the 21st century. Finally, reviewing the literature, Cruz et al. [19] stated that downscaling regional climate data over South East Asia region tends to be performed by using one or a few GCMs for one or two climate scenarios, which may not be enough for impacts assessments and adaptation strategy formulations since they often require a range of possible future climates with a measure of uncertainty.
Within this framework, the aim of this study is to assess watershed-scale hydro-climate conditions in terms of precipitation, temperature, soil water storage, and river flows in Peninsular Malaysia during the 2010–2100 period. In order to account for possible uncertainties within the future climate conditions [20], an ensemble approach was followed by the dynamical downscaling of 15 projections from three GCMs covering four emission scenarios. The findings of this study can be helpful in the management of water resources in Peninsular Malaysia during the 21st century.
2. Study Area
Located in Southeast Asia, Malaysia is composed of Peninsular Malaysia in the west, and Sabah and Sarawak in the east. Peninsular Malaysia, which is located between 1° and 7° north latitudes and 100° to 105° east longitudes, representing approximately 40% of the whole Malaysia, is the focus of this study. Tropical rainforest climate is observed in Peninsular Malaysia with uniform high humidity, hot temperature and moderate rainfall (between 1933 mm and 3080 mm) throughout the year [21]. Precipitation is associated with the Southwest monsoon from May to August and the Northeast monsoon from November to February, and heavy rainfall occurs during inter-monsoon months, i.e., March-April and September-October [12]. Titiwangsa Mountains, covering northern to southern Peninsular Malaysia, divide Peninsular Malaysia into east and west coastal sectors.
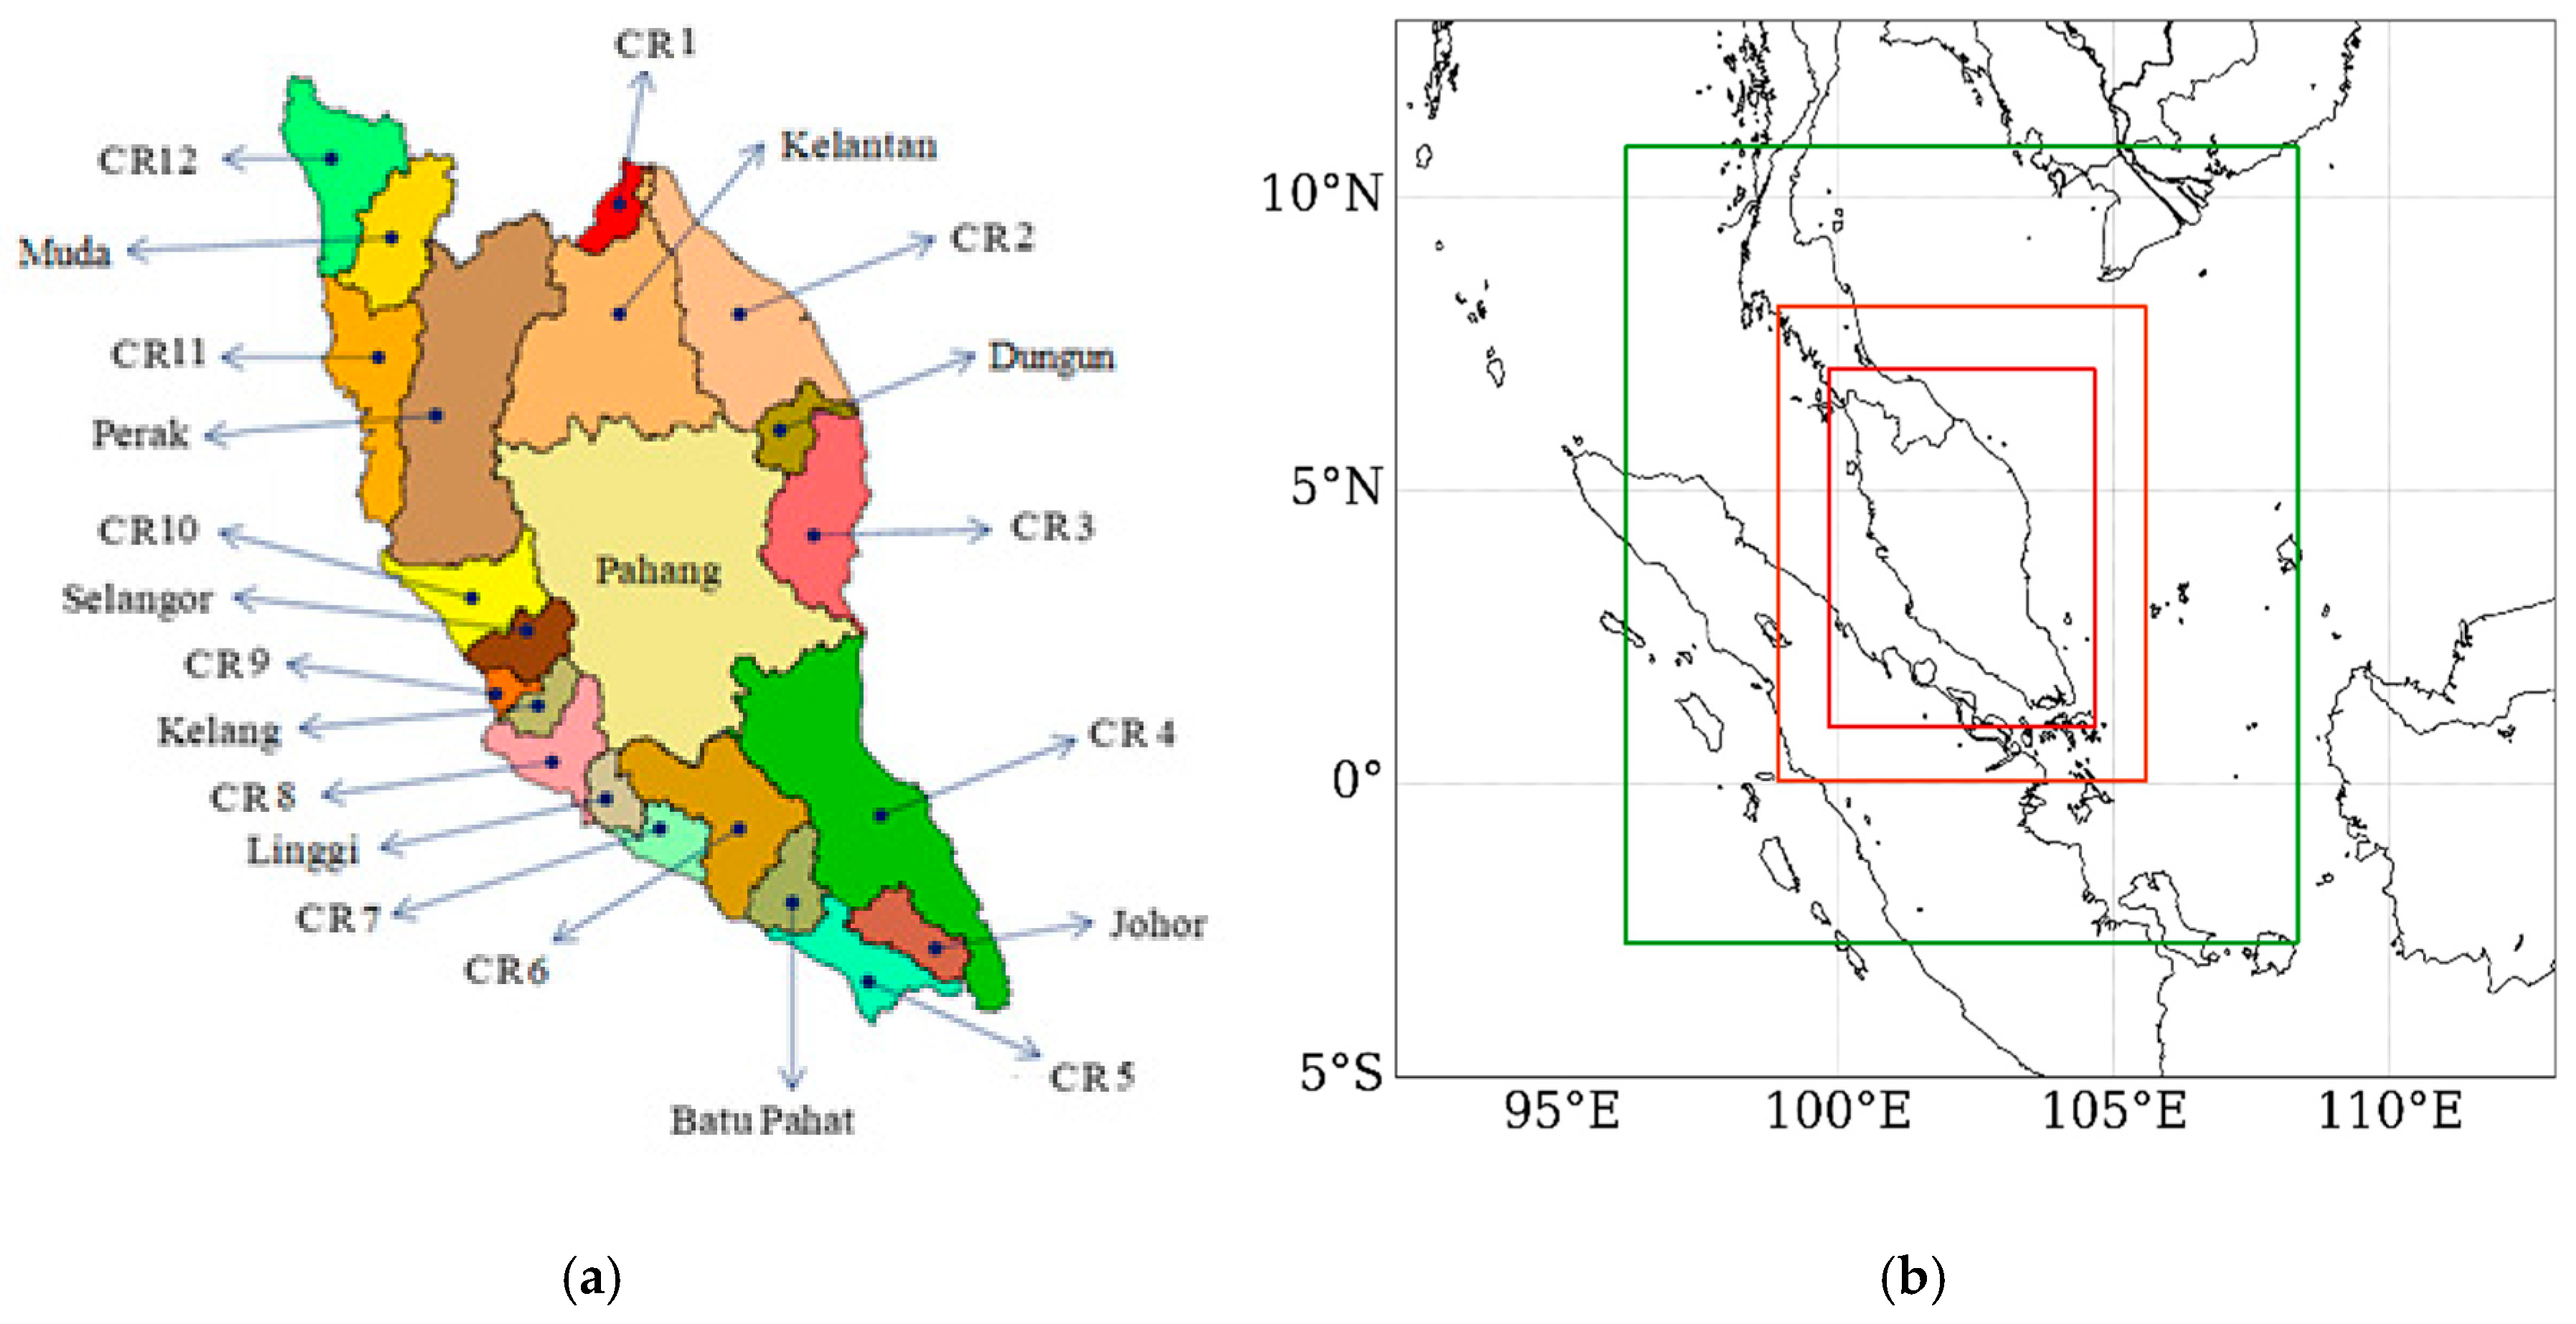
In this study, hydroclimate conditions in the 21st century, with respect to precipitation, air temperature and soil water storage, are investigated over the Batu Pahat, Johor, Muda, Kelang, Kelantan, Linggi, Pahang, Perak, Selangor, and Dungun watersheds and 12 coastal regions of Peninsular Malaysia as shown in Figure 1a. The impacts of the climate change on river flows are assessed for the selected 10 watersheds. Being at east, west, north, south, and inland of Peninsular Malaysia, the selected watersheds represent the climate, topography, and land use/cover conditions of the whole Peninsular Malaysia.
3. Methodology
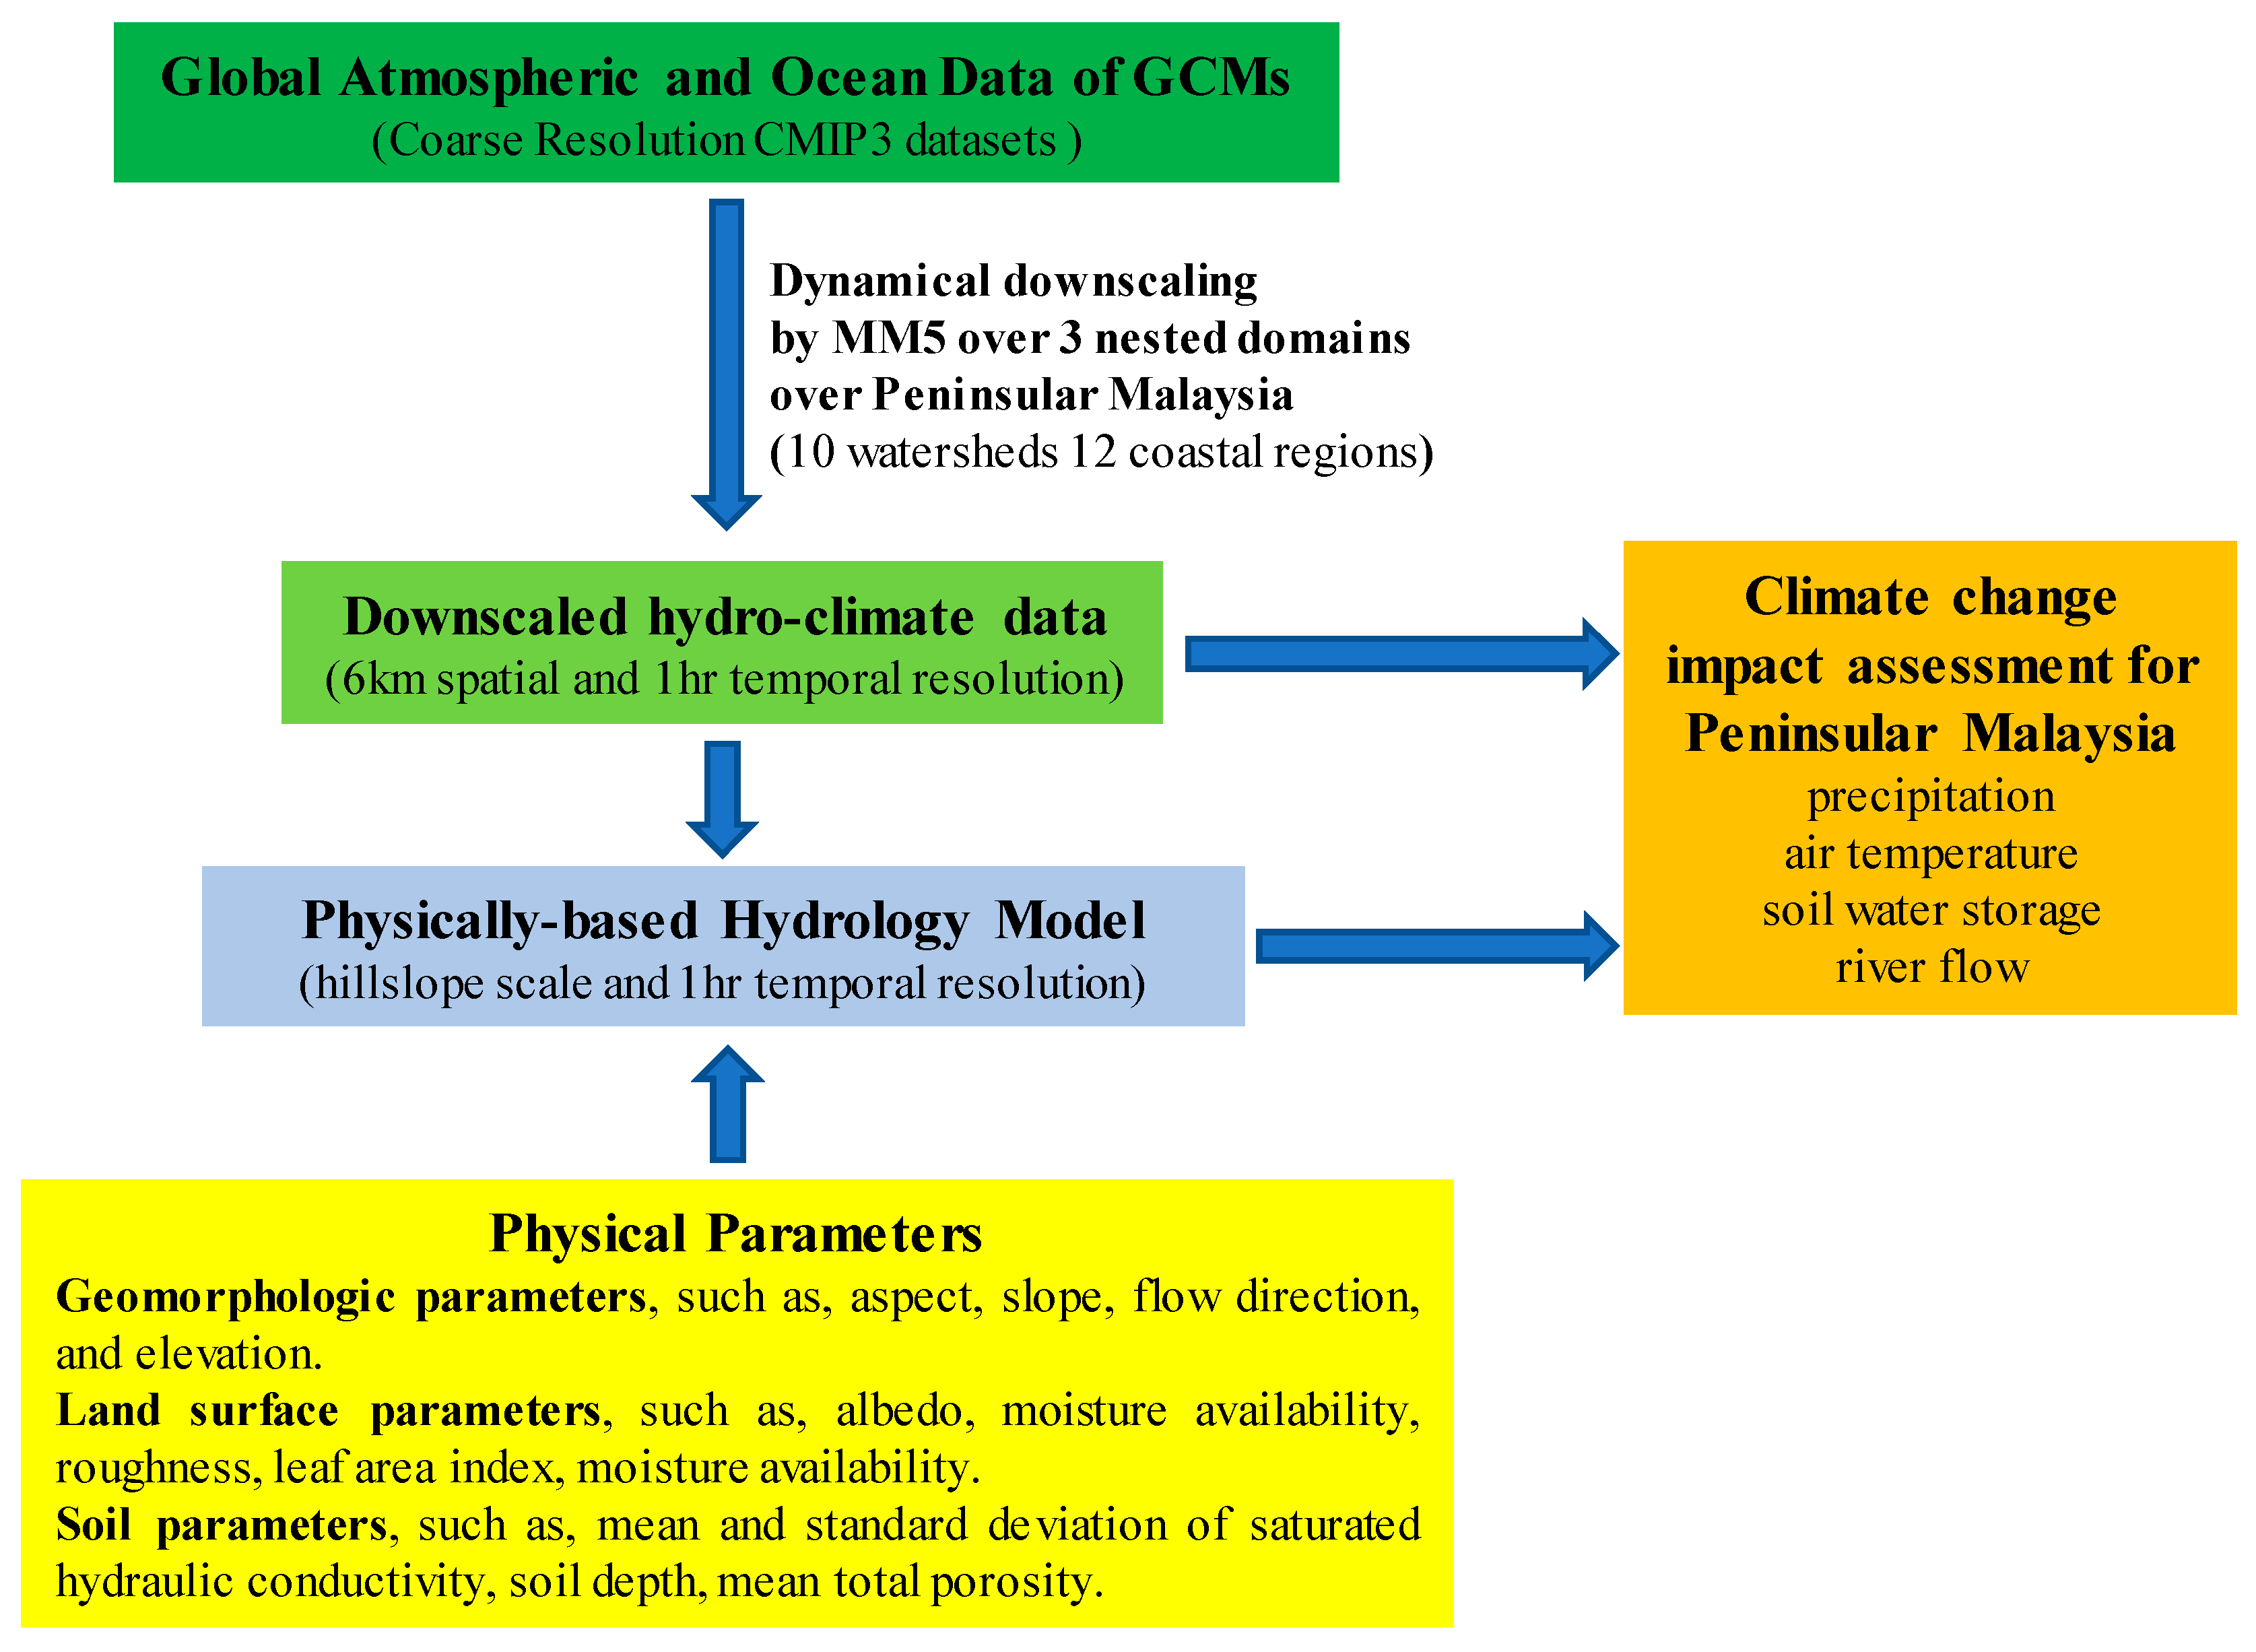
As Kavvas et al. [22] stated, modeling interactions between the atmosphere and hydrologic processes in heterogeneous domains are among the key problems in atmospheric and hydrologic sciences. Coupling land surface hydrologic processes with atmospheric processes is a necessity for accurate estimation of the land surface fluxes [22,23]. As such, a physically-based hydrology model, Watershed Environmental Hydrology Model (WEHY; Kavvas et al. [24]; Chen et al. [25,26]), and a regional climate model, MM5 (Fifth Generation Penn State/NCAR Mesoscale Model), were coupled in this study. Schematic description of the modeling approach is depicted in Figure 2. A unique feature of WEHY model is that it utilizes the upscaled hydrologic conservation equations which enable the estimation of the model parameters that are capable of describing the heterogeneity within the natural watersheds by taking into account areal averages, variances, and covariances of the original point-scale parameters [24]. This study extends the modeling approach utilized in Amin et al. [18], which assessed the impacts of climate change on river flows over Muda and Dungun watersheds, and reports the impacts of climate change on the hydro-climate (i.e., precipitation, temperature, soil water storage, and river flows) over the whole Peninsular Malaysia during the whole 2010–2100 period of the 21st century.
The GCM simulations do not provide reliable information at regional and watershed scales due to their spatially coarse resolution. Therefore, these simulations need to be downscaled at fine spatial grid resolution over a target region in order to account for the impact of local topography and land use conditions on the region’s climate [27,28,29,30,31]. Statistical and dynamical downscaling are the two approaches to downscaling the coarse resolution data of GCM simulations [30,31]. Recently, computational speed has increased considerably and the dynamical downscaling of GCM data is possible at fine temporal (hourly) and spatial grid resolutions (3/9-km) [11]. The dynamical downscaling approach utilizes the full equations of mass, energy, and momentum conservation laws in the atmosphere and account for the physical interactions of land–atmosphere processes with consideration of the heterogeneity in topography, soil, vegetation, and climate variables [11]. Kure et al. [32] showed that coupling a hydro climate model with a physically based hydrology model, such as WEHY, may be useful in producing both atmospheric data and runoff simulations over ungauged and sparsely gauged watersheds.
Performing dynamic downscaling over Northern California by both Weather Research and Forecasting Model (WRF) and MM5 model based on NCEP/NCAR Reanalysis I, Ishida et al. [33] concluded that MM5 model has generally faster computational speed and the WRF model does not have an obvious advantage over the MM5 model in simulating watershed-scale precipitation. Hence, MM5 model was used in this study to dynamically downscale 15 future climate projections (Table 1) from three GCMS, i.e., ECHAM5 [34], MRI-CGCM2.3.2 [35], and CCSM3 [36] at coarse grid resolutions of about 1.8°, 2.8° and 1.4°, to 6 km spatial resolution over the Peninsular Malaysia region. The coarse resolution climate data under consideration are from Coupled Model Intercomparison Project Phase 3 (CMIP3). Assumptions and limitations of CMIP3 dataset are described in IPCC Fourth Assessment Report [37].
In the last decade, typical horizontal grid resolution of Regional Climate Models has decreased from 50 km to 25 km [30,31]. Evaluating the performance of dynamical downscaling, Jang et al. [38] investigated the performance of a regional climate model with respect to the simulation of historical climatic conditions at various grid resolutions, and concluded that the banded structures and orographic effects on precipitation and wind fields can be well described by a mesoscale model at 3 km and 9 km grid resolutions while 27 km and 81 km grid model simulation may not be sufficient for watershed-scale or sub-watershed-scale studies. As such, an ensemble of 15 climate projections over the entire Peninsular Malaysia was dynamically downscaled to a fine spatial resolution of 6 km over the entire 21st century.
An ensemble approach that involves simulations of 15 future projections covering four emission scenarios (i.e., best possible SRES B1, the worst possible A1FI, the most likely A1B, and the second worst possible A2) was utilized to address the uncertainties in the climate projections (Table 1). The future scenarios are based on different future projections of economic and social development, population increase, technological change, and energy resources, etc. [39]. These uncertainties include the climate model uncertainty, the emission scenario uncertainty, and the internal variability of the climate system [20]. Three nested domains were constructed over Peninsular Malaysia to dynamically downscale global scale GCM data as depicted in Figure 1b: The outer domain has a 54-km grid size and covers the Southeast Asia region, the intermediate domain has a grid size of 18-km, and the inner domain covers the entire Peninsular Malaysia with a grid size of 6-km.
WEHY watershed hydrology model [24,25,26] was then coupled with the MM5 atmospheric model through the atmospheric boundary layer. The grid point fluxes of the regional climate model, MM5, were translated to the average flux values over each Model Computational Unit (MCU, or hillslope) of a modeled watershed based on the weighted average of the fraction of the MCU area occupied by the corresponding MM5 grids [40]. WEHY model is a physically based spatially distributed watershed hydrology model that is based upon upscaled conservation equations for interception, evapotranspiration, infiltration, unsaturated flow, subsurface stormflow, and overland flow at each hilllslope, and interacting channel network flow and regional groundwater flow over the whole modeled watershed. One of the advantages of WEHY model is that it can quantify the subsurface stormflow-rill flow interaction, and the variable source area flow mechanism by modeling explicitly the subsurface stormflow dynamics in terms of upscaled equations. Water to rill flow may be supplied both by overland sheet flow from interrill areas, and by subsurface stormflow where these contributions will vary with climate, vegetation, and soil characteristics. As such, WEHY is very suitable for modeling the hydrologic processes at densely vegetated tropical regions, such as Peninsular Malaysia, due to the fundamental importance of subsurface stormflow in these regions.
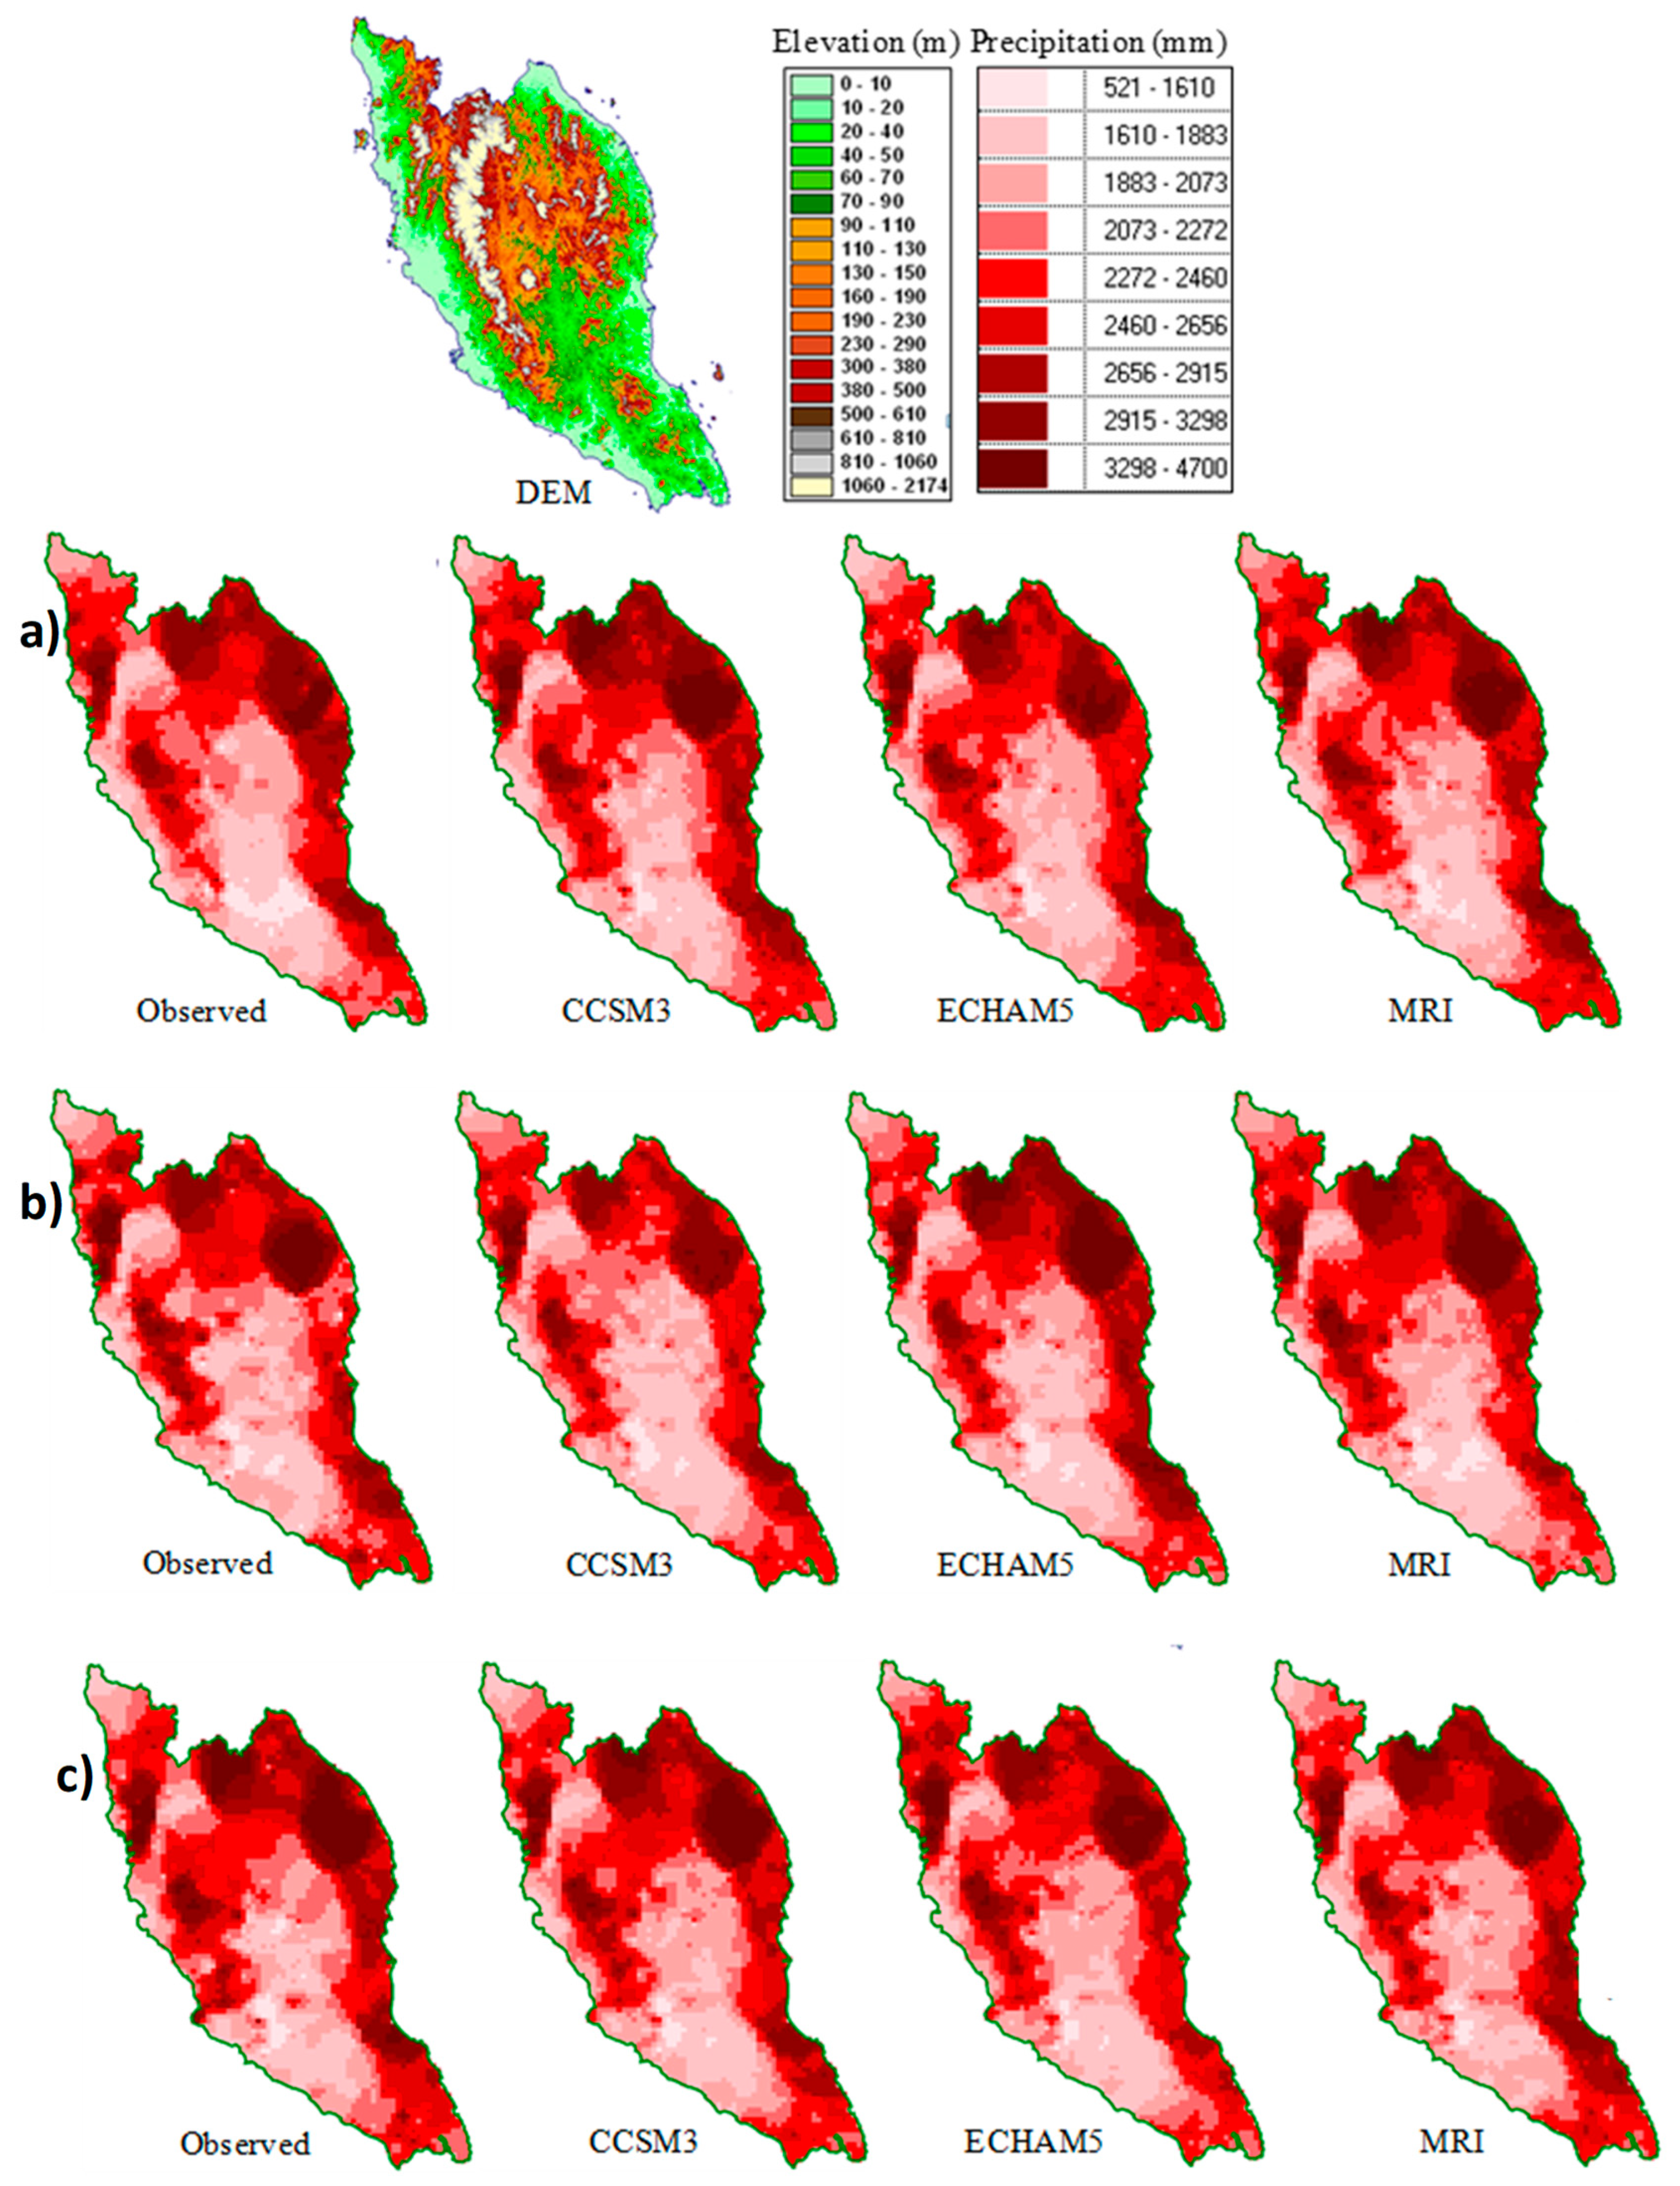
Biases in the precipitation simulations were obtained by comparing mean monthly values between gauge observations and downscaled control simulations during 1970 and 2000. Bias correction factors for each GCM were then applied to future projections. After bias correction, MM5-simulated 10-year average annual precipitation during 1970–1980, 1980–1990, and 1990–2000 by downscaling the control run data from CCSM3, ECHAM5 and MRI-CGCM2.3.2 global climate models were compared with the observations, as shown in Figure 3. Simulations captured well the observed spatial distribution of high and low precipitation areas, which is consistent with the topography, as shown by the top figure in Figure 3.
WEHY’s geomorphologic parameters (such as, aspect, slope, flow direction, and elevation), soil hydraulic parameters (such as, mean and standard deviation of saturated hydraulic conductivity, soil depth, mean total porosity), and land surface parameters model parameters (such as, albedo, moisture availability, roughness, leaf area index, moisture availability) are estimated from the DEM, land use/land cover map, soil map, and other physical data sources (such as MODIS satellite images to obtain leaf area index) of the study area. Besides these physical model parameters, other parameters such as Chézy roughness coefficients and initial soil moisture conditions at each MCU were calibrated and validated based on the observed river discharge data, utilizing the observed rainfall conditions through a trial and error exercise.
In this study, in order to assess the impact of climate change on river flows at the 10 selected watersheds of Peninsular Malaysia, the WEHY watershed hydrology model was calibrated and validated over the specified watersheds at the streamflow stations as presented in Table 2. Quality of the WEHY model simulations is affected by the quality and resolutions of the physical model parameters, which are derived from the DEM, land use/land cover map, soil map, and other physical data sources (such as MODIS satellite images to obtain leaf area index).
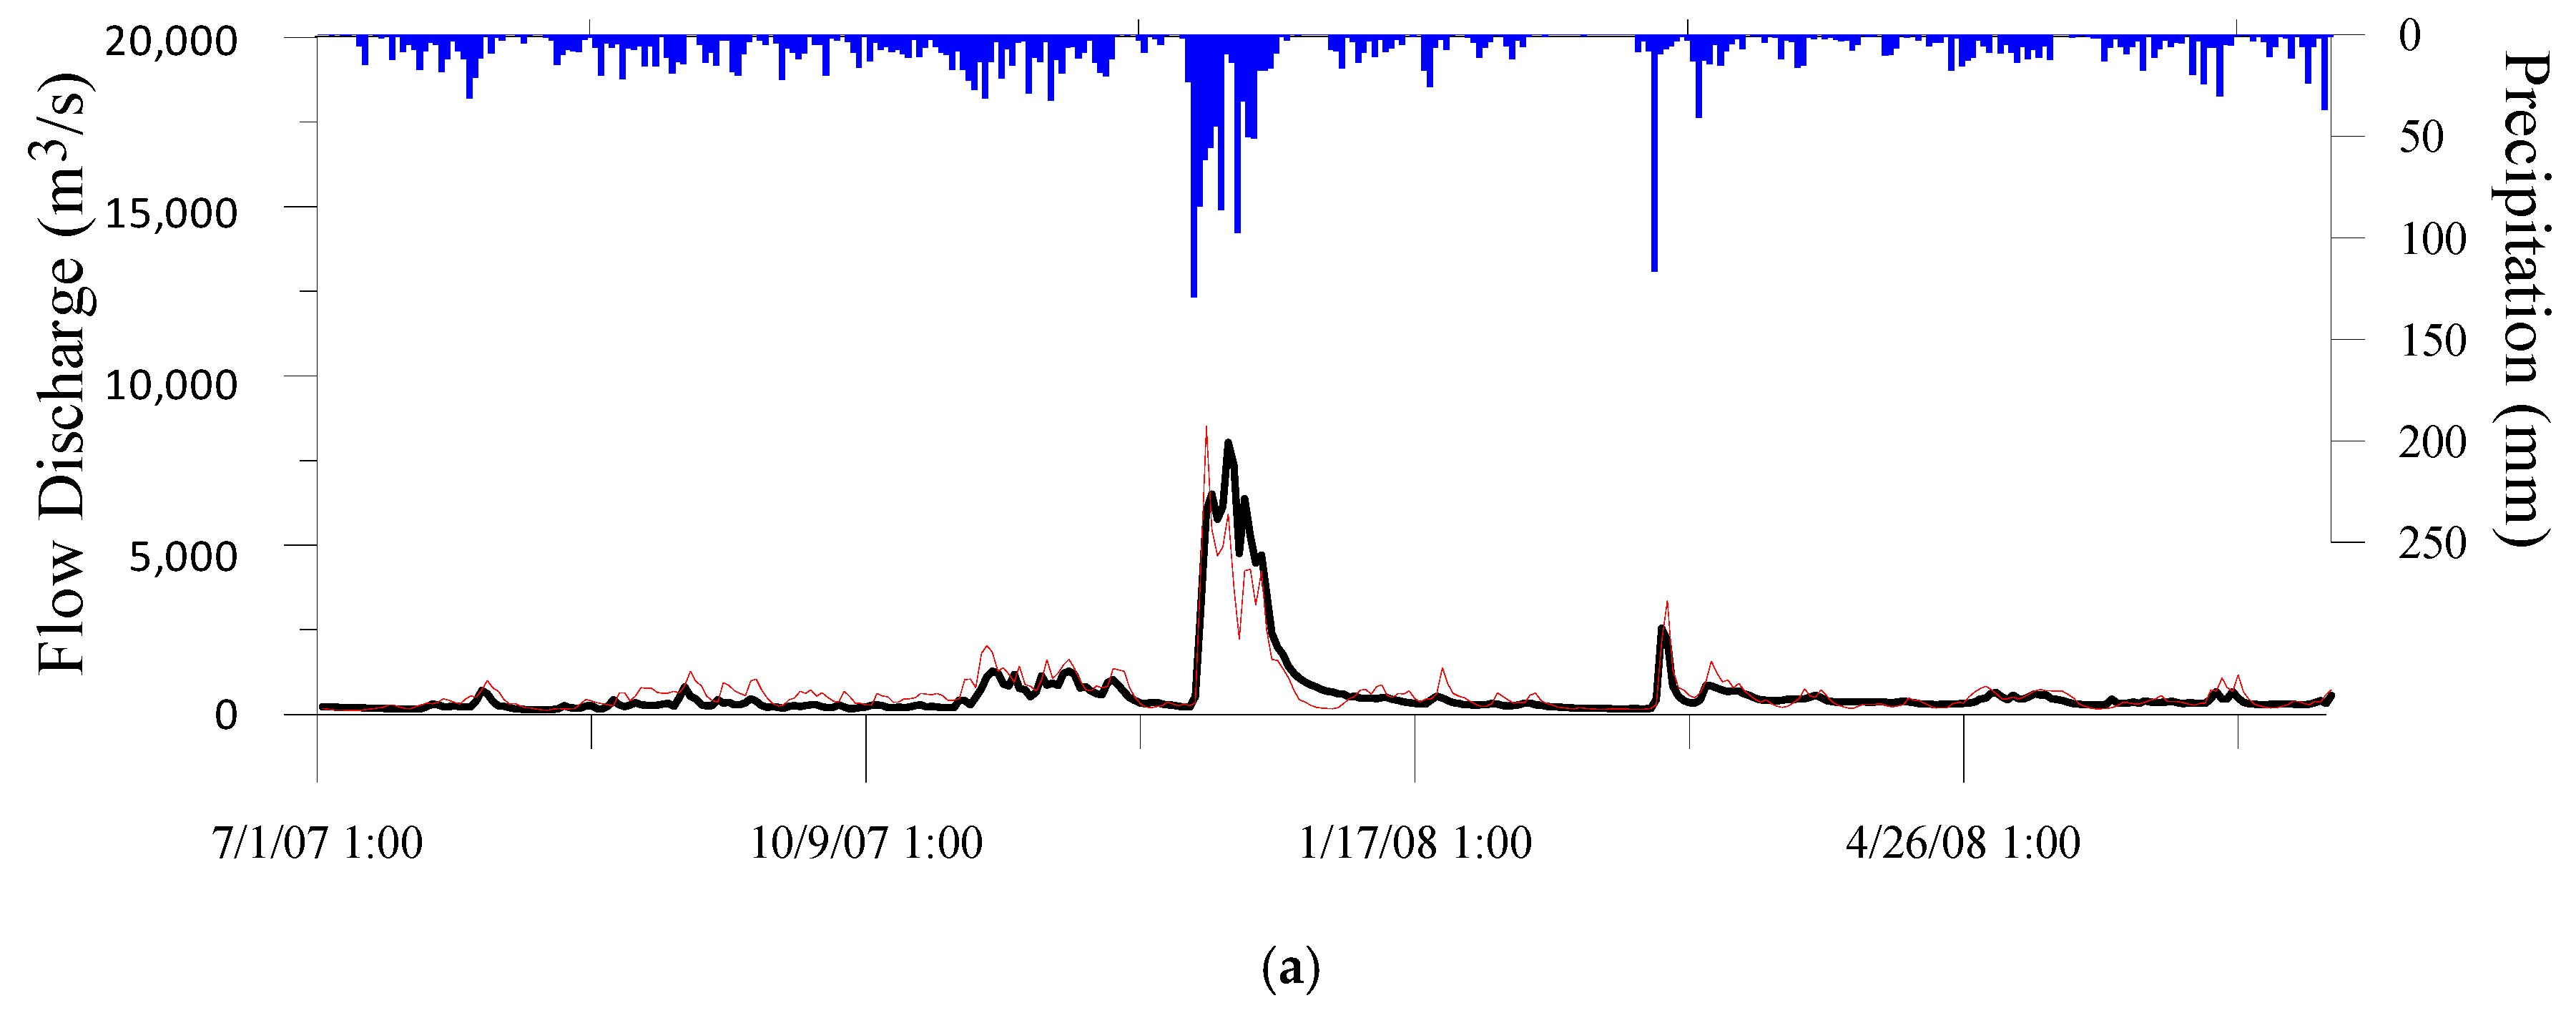
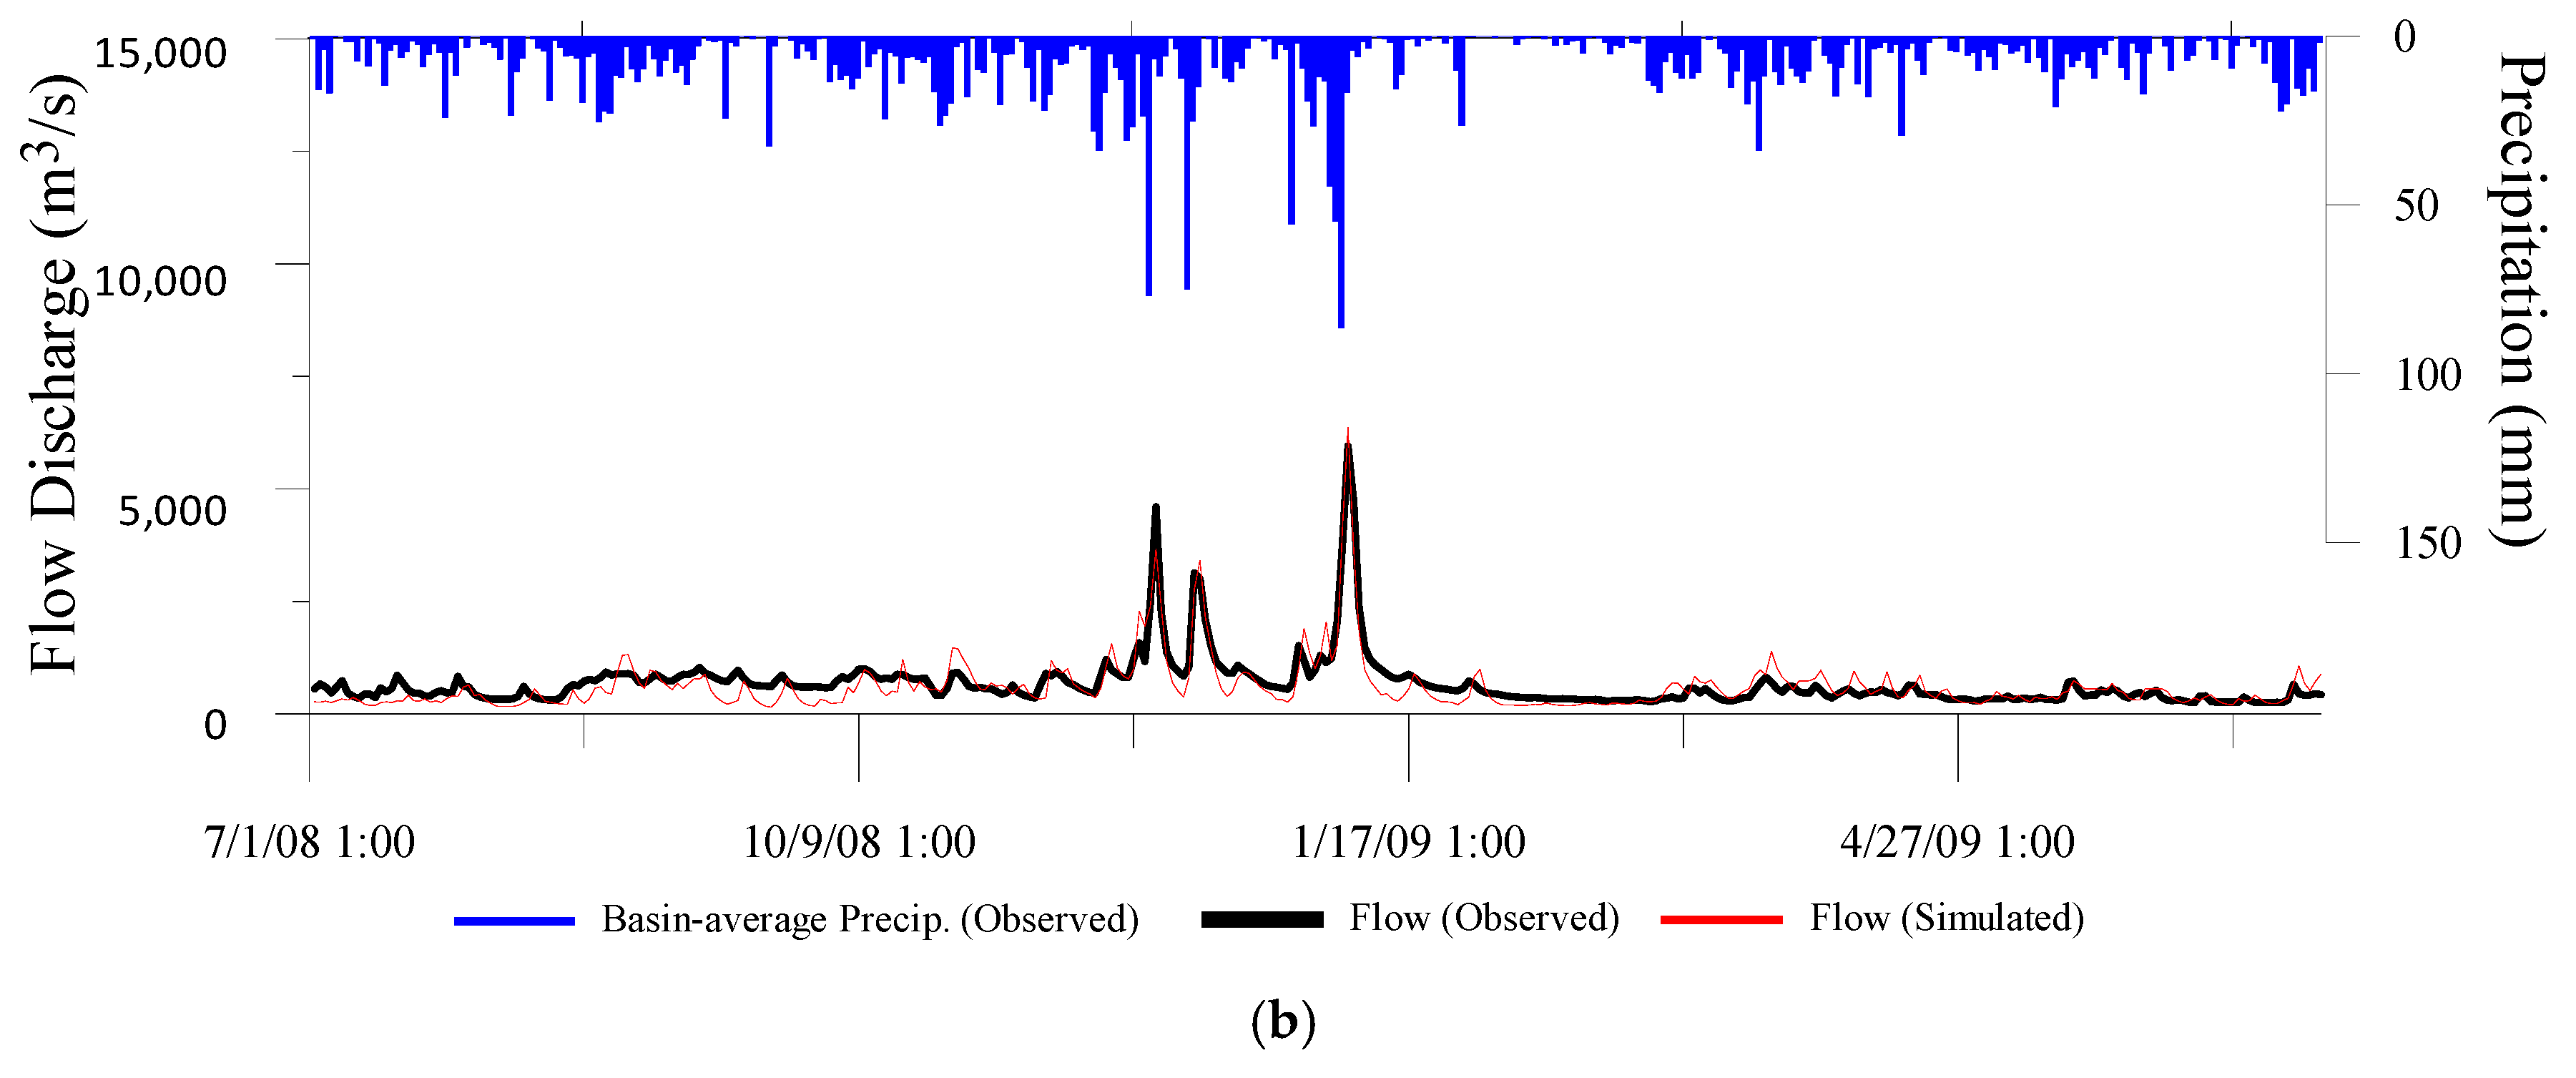
The calibration and validation of the river flow discharges, which are the ultimate product of the physical hydrology model coupled with the regional climate model, show credible stream discharge hydrographs in the study watersheds when compared to the corresponding observations. As an example, the hourly time series of the observed and model simulated stream discharges at Jambatan Guillemard station in Kelantan for the one-year calibration and one-year validation periods are depicted in Figure 4. The Nash-Sutcliffe coefficients are larger than 0.5 for all of the 10 watersheds both for the calibration and validation durations. Values of Nash–Sutcliffe coefficients that are typically greater than 0.5 are considered acceptable for the hydrologic applications [41]. Details of the calibration and validation process were discussed for Muda and Dungun watersheds in Amin et al. [18].
4. Results and Discussion
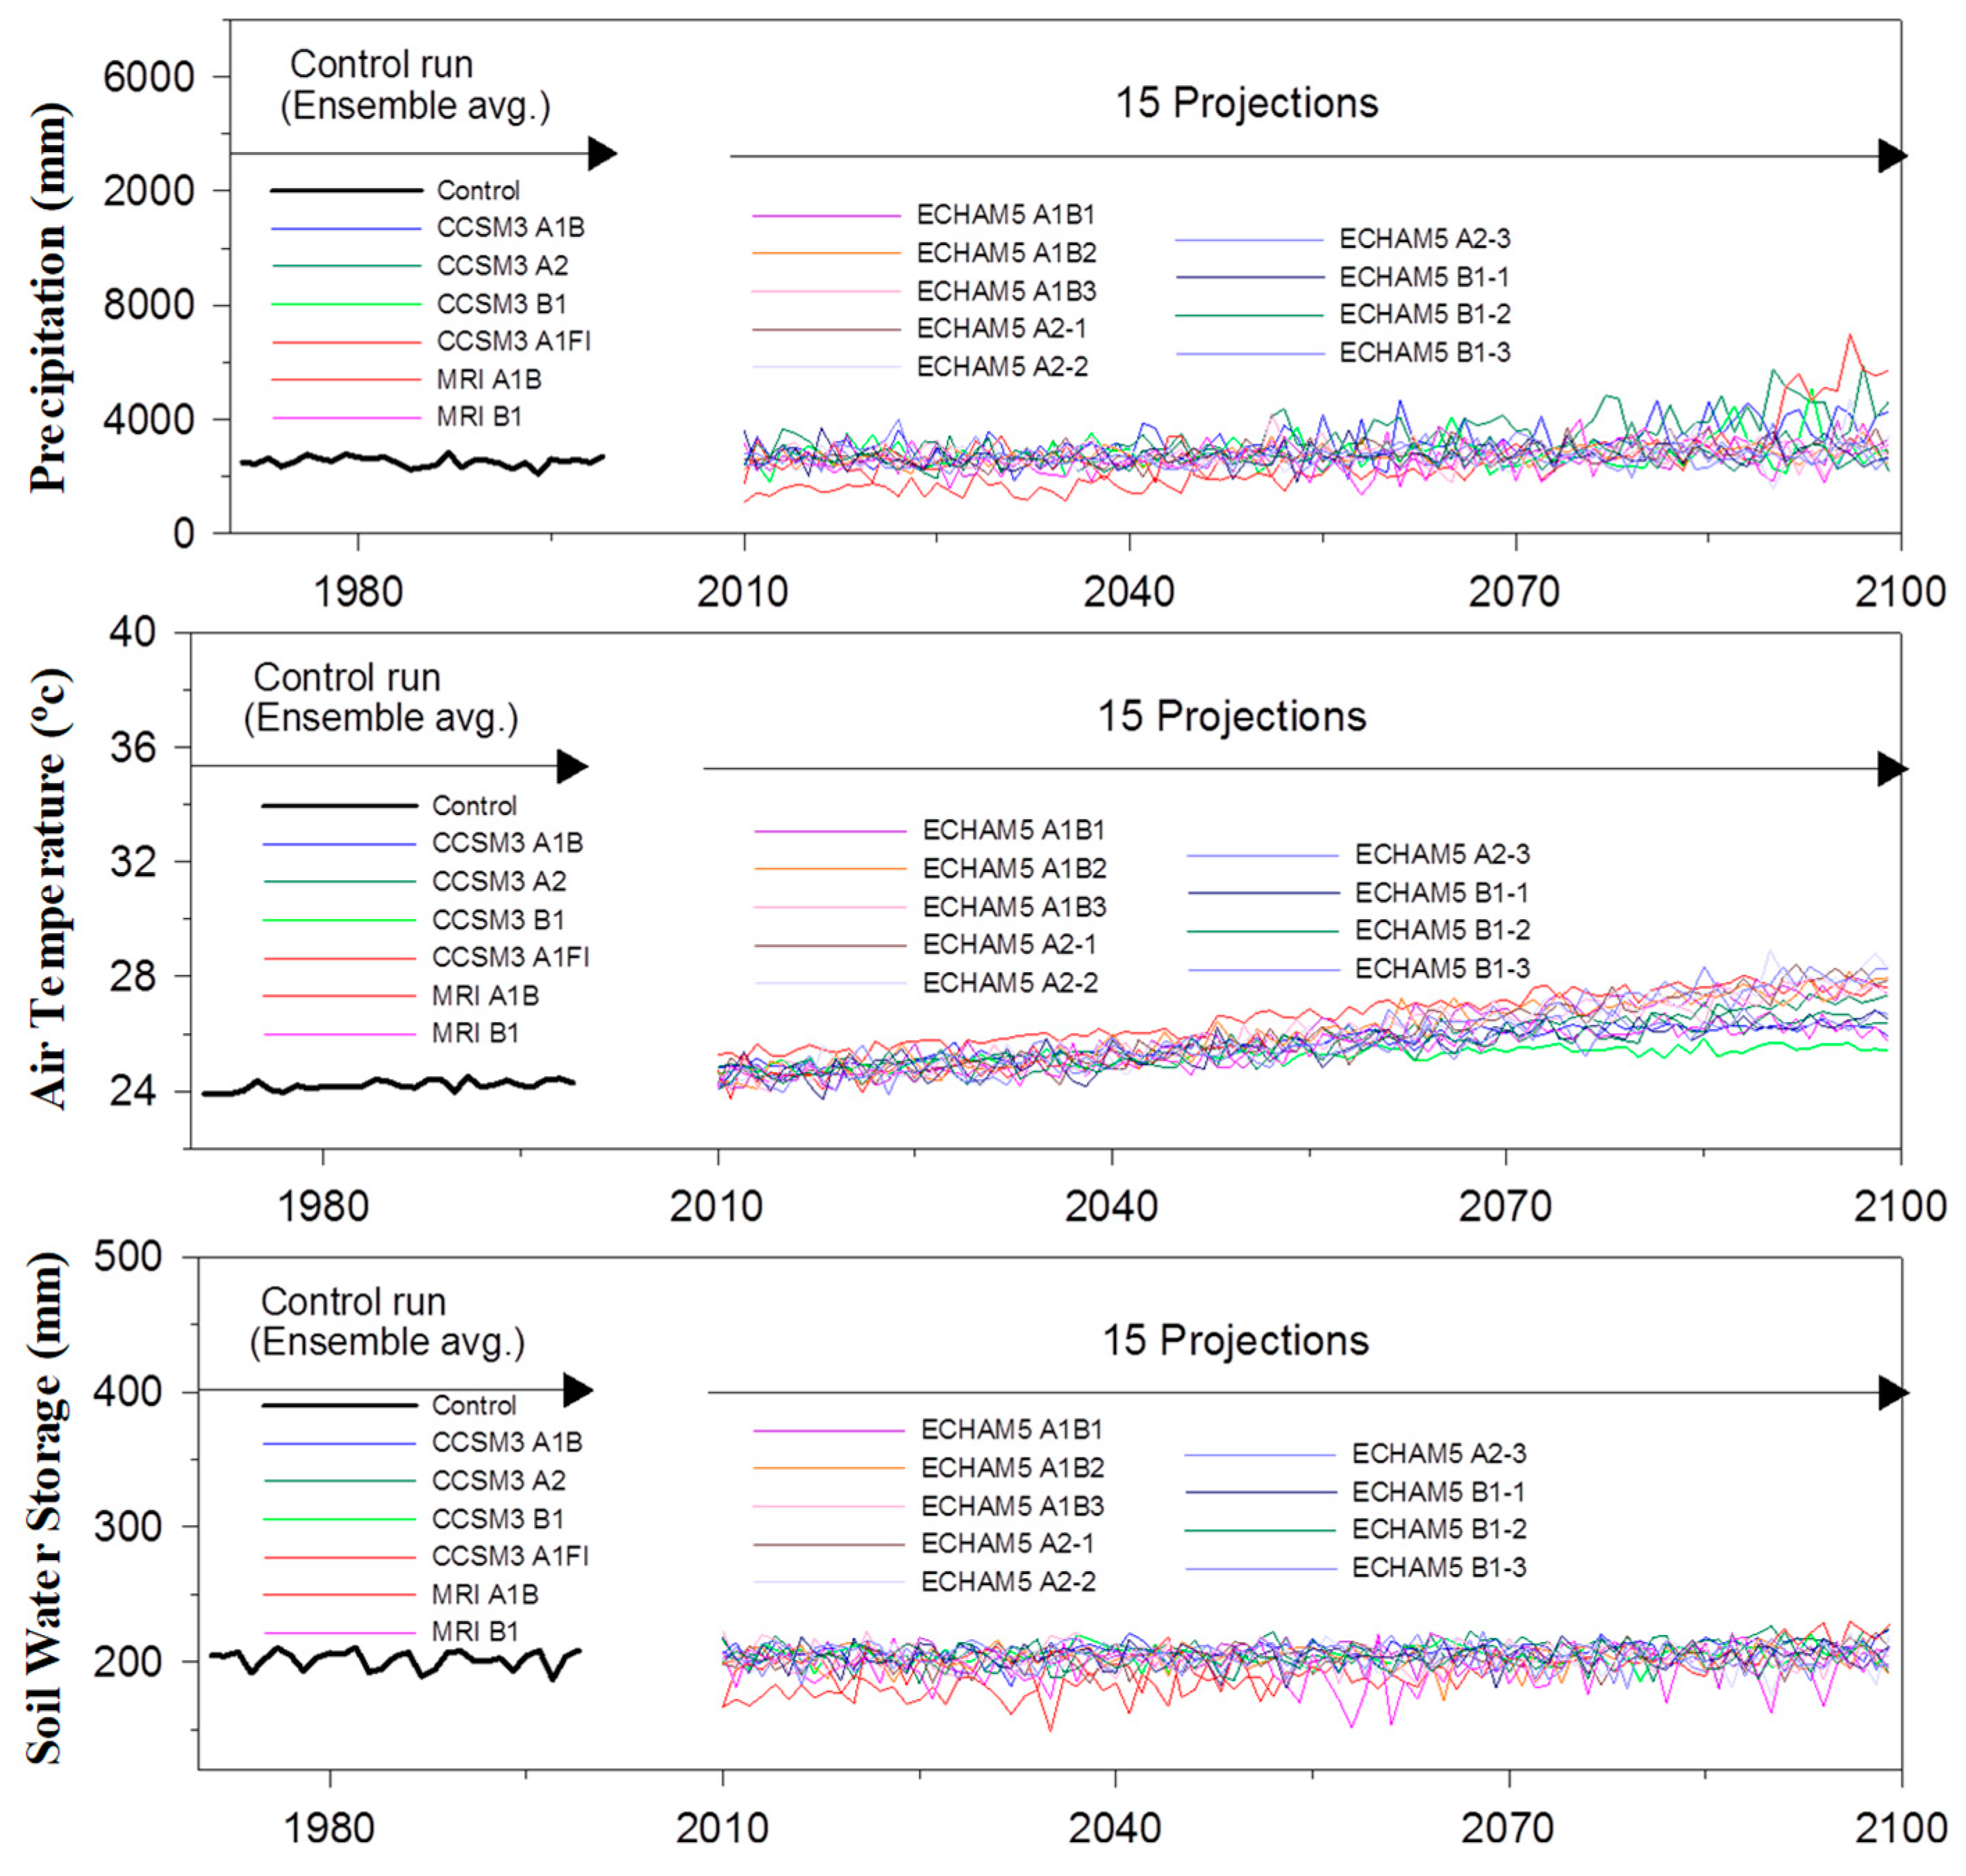
The assessment in this section is based on ensemble averages of the basin-average values of precipitation, air temperature, soil water storage, and river flow for the historical (1970–2000), the early 21st century (2010–2040), the middle 21st century (2040–2070), and the end of 21st century (2070–2100). As a demonstration of the variability of each of the 15 future projections, basin-average annual hydro-climate variables (i.e., precipitation, air temperature, and soil water storage) for each of the 15 projections during 2010–2100 are shown in Figure 5 for Kelantan Watershed.
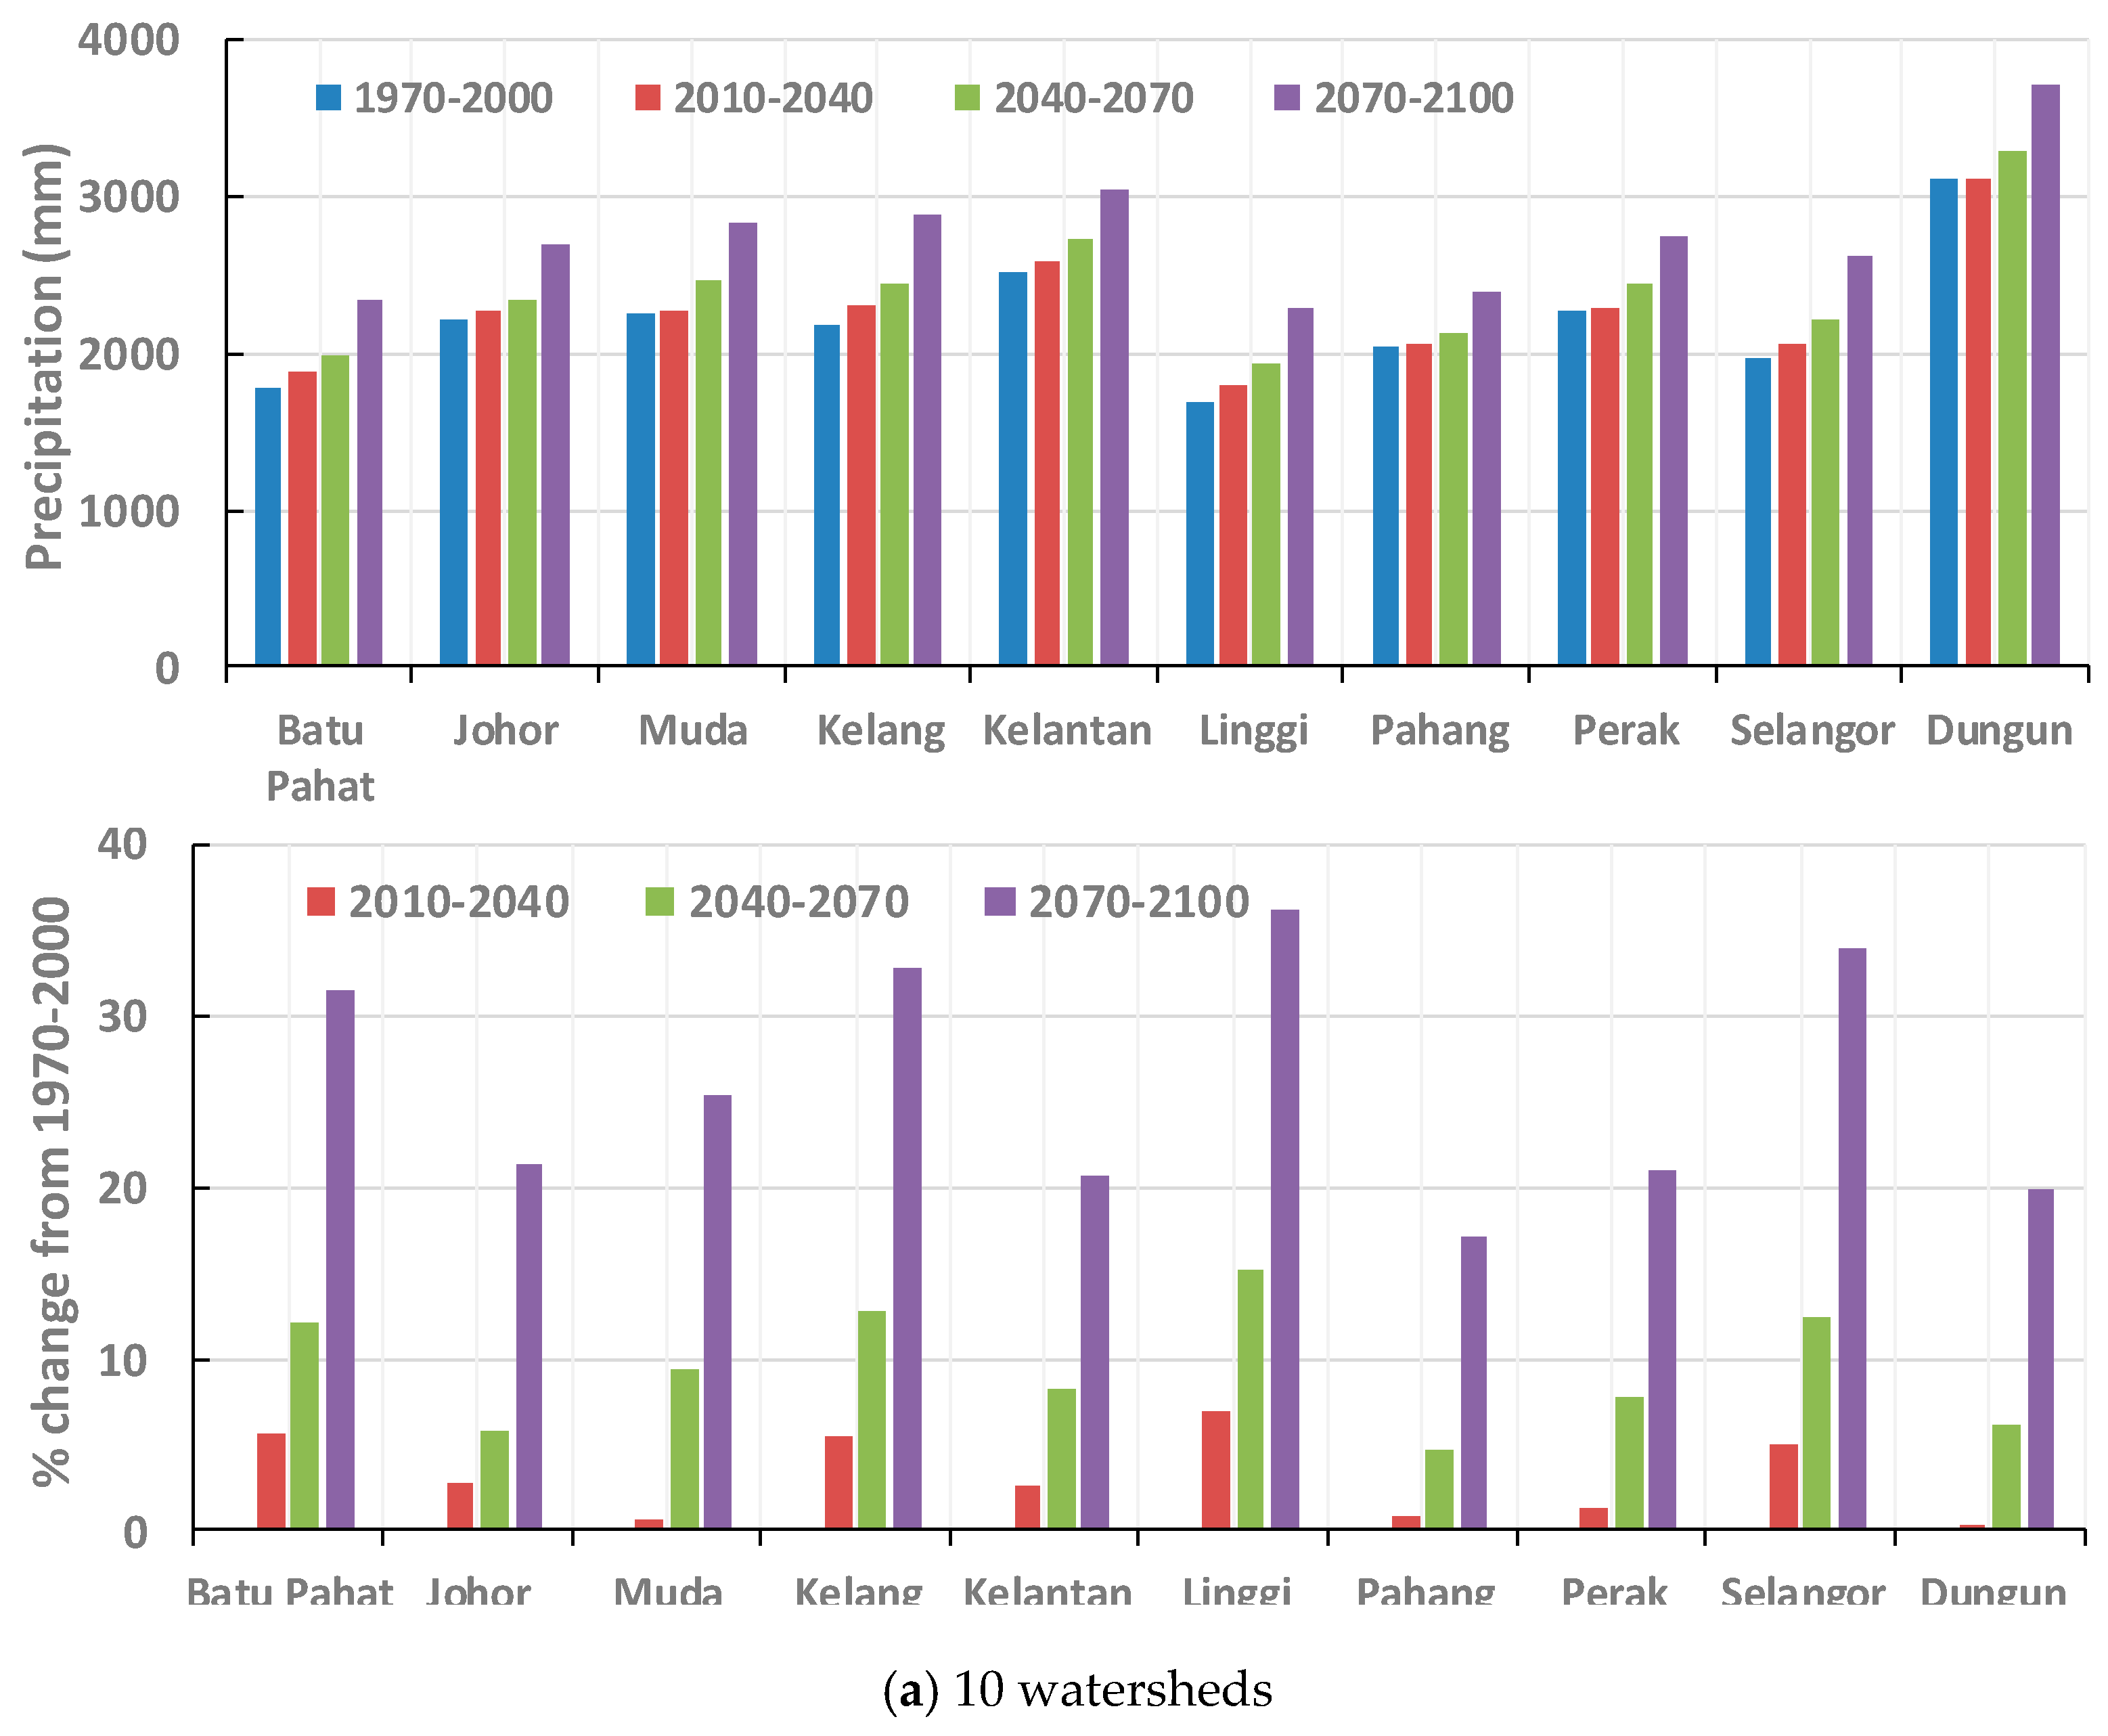
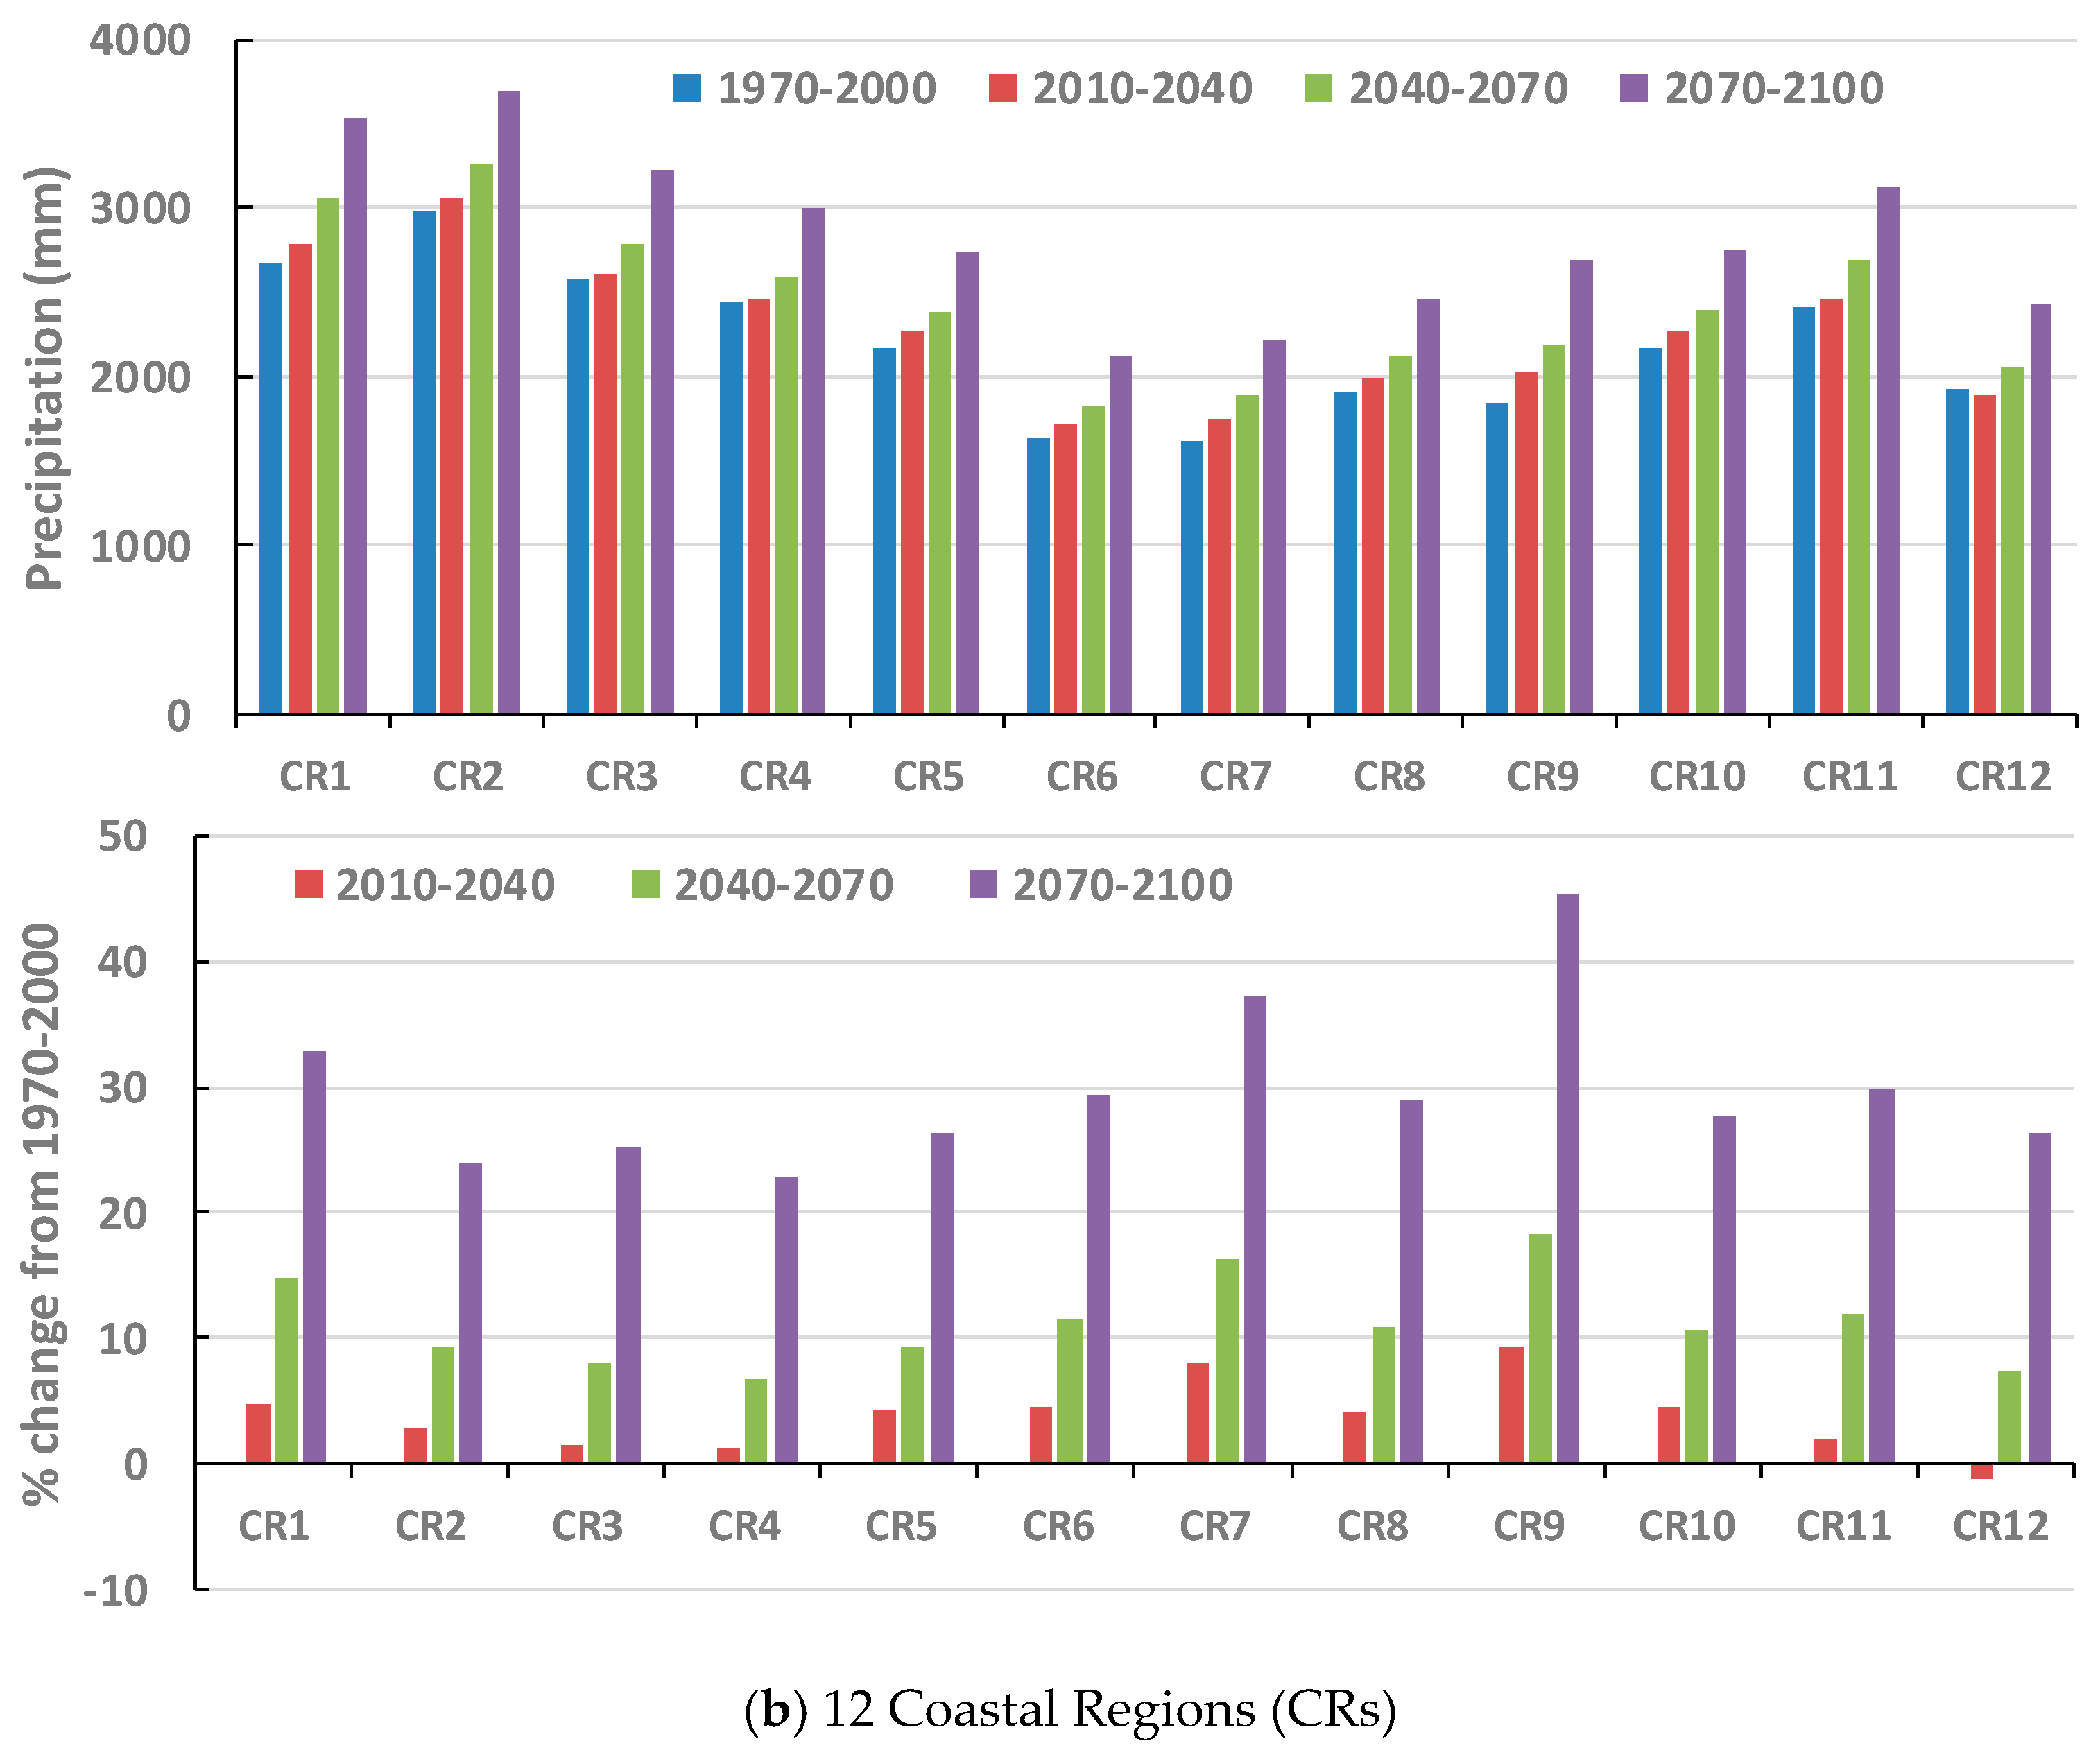
Figure 6 shows the 30-year mean of the basin-average annual precipitation during the historical (1970–2000), early 21st century (2010–2040), middle 21st century (2040–2070), end of 21st century (2070–2100) periods, and the percent change in the 30-year mean of the annual precipitation from the historical period. The 30-year mean annual precipitation gradually increases toward the end of the 21st century over each of the 10 watersheds and 12 coastal regions, with the only exception of 1.3 percent reduction in CR12 between the historical period and the early 21st century. In CR12, the 30-year mean of the annual precipitation increases 7.3 percent at the middle of 21st century and 26.3 percent at the end of 21st century when compared with the historical period. The change in the 30-year mean annual precipitation from the historical period over the 10 watersheds varies from 0.4 percent in Dungun to 6.9 percent in Linggi at the early 21st century, from 4.7 percent in Pahang to 15.1 percent in Linggi at the middle 21st century, and 17.1 percent in Pahang to 36.3 percent in Linggi at the end of 21st century. The change in from the historical period over the 12 coastal regions varies from −1.3 percent in CR12 to 9.3 percent in CR9 at the early 21st century, from 6.6 percent in CR4 to 18.2 percent in CR9 at the middle 21st century, and 22.9 percent in CR4 to 45.4 percent in CR9 at the end of 21st century.
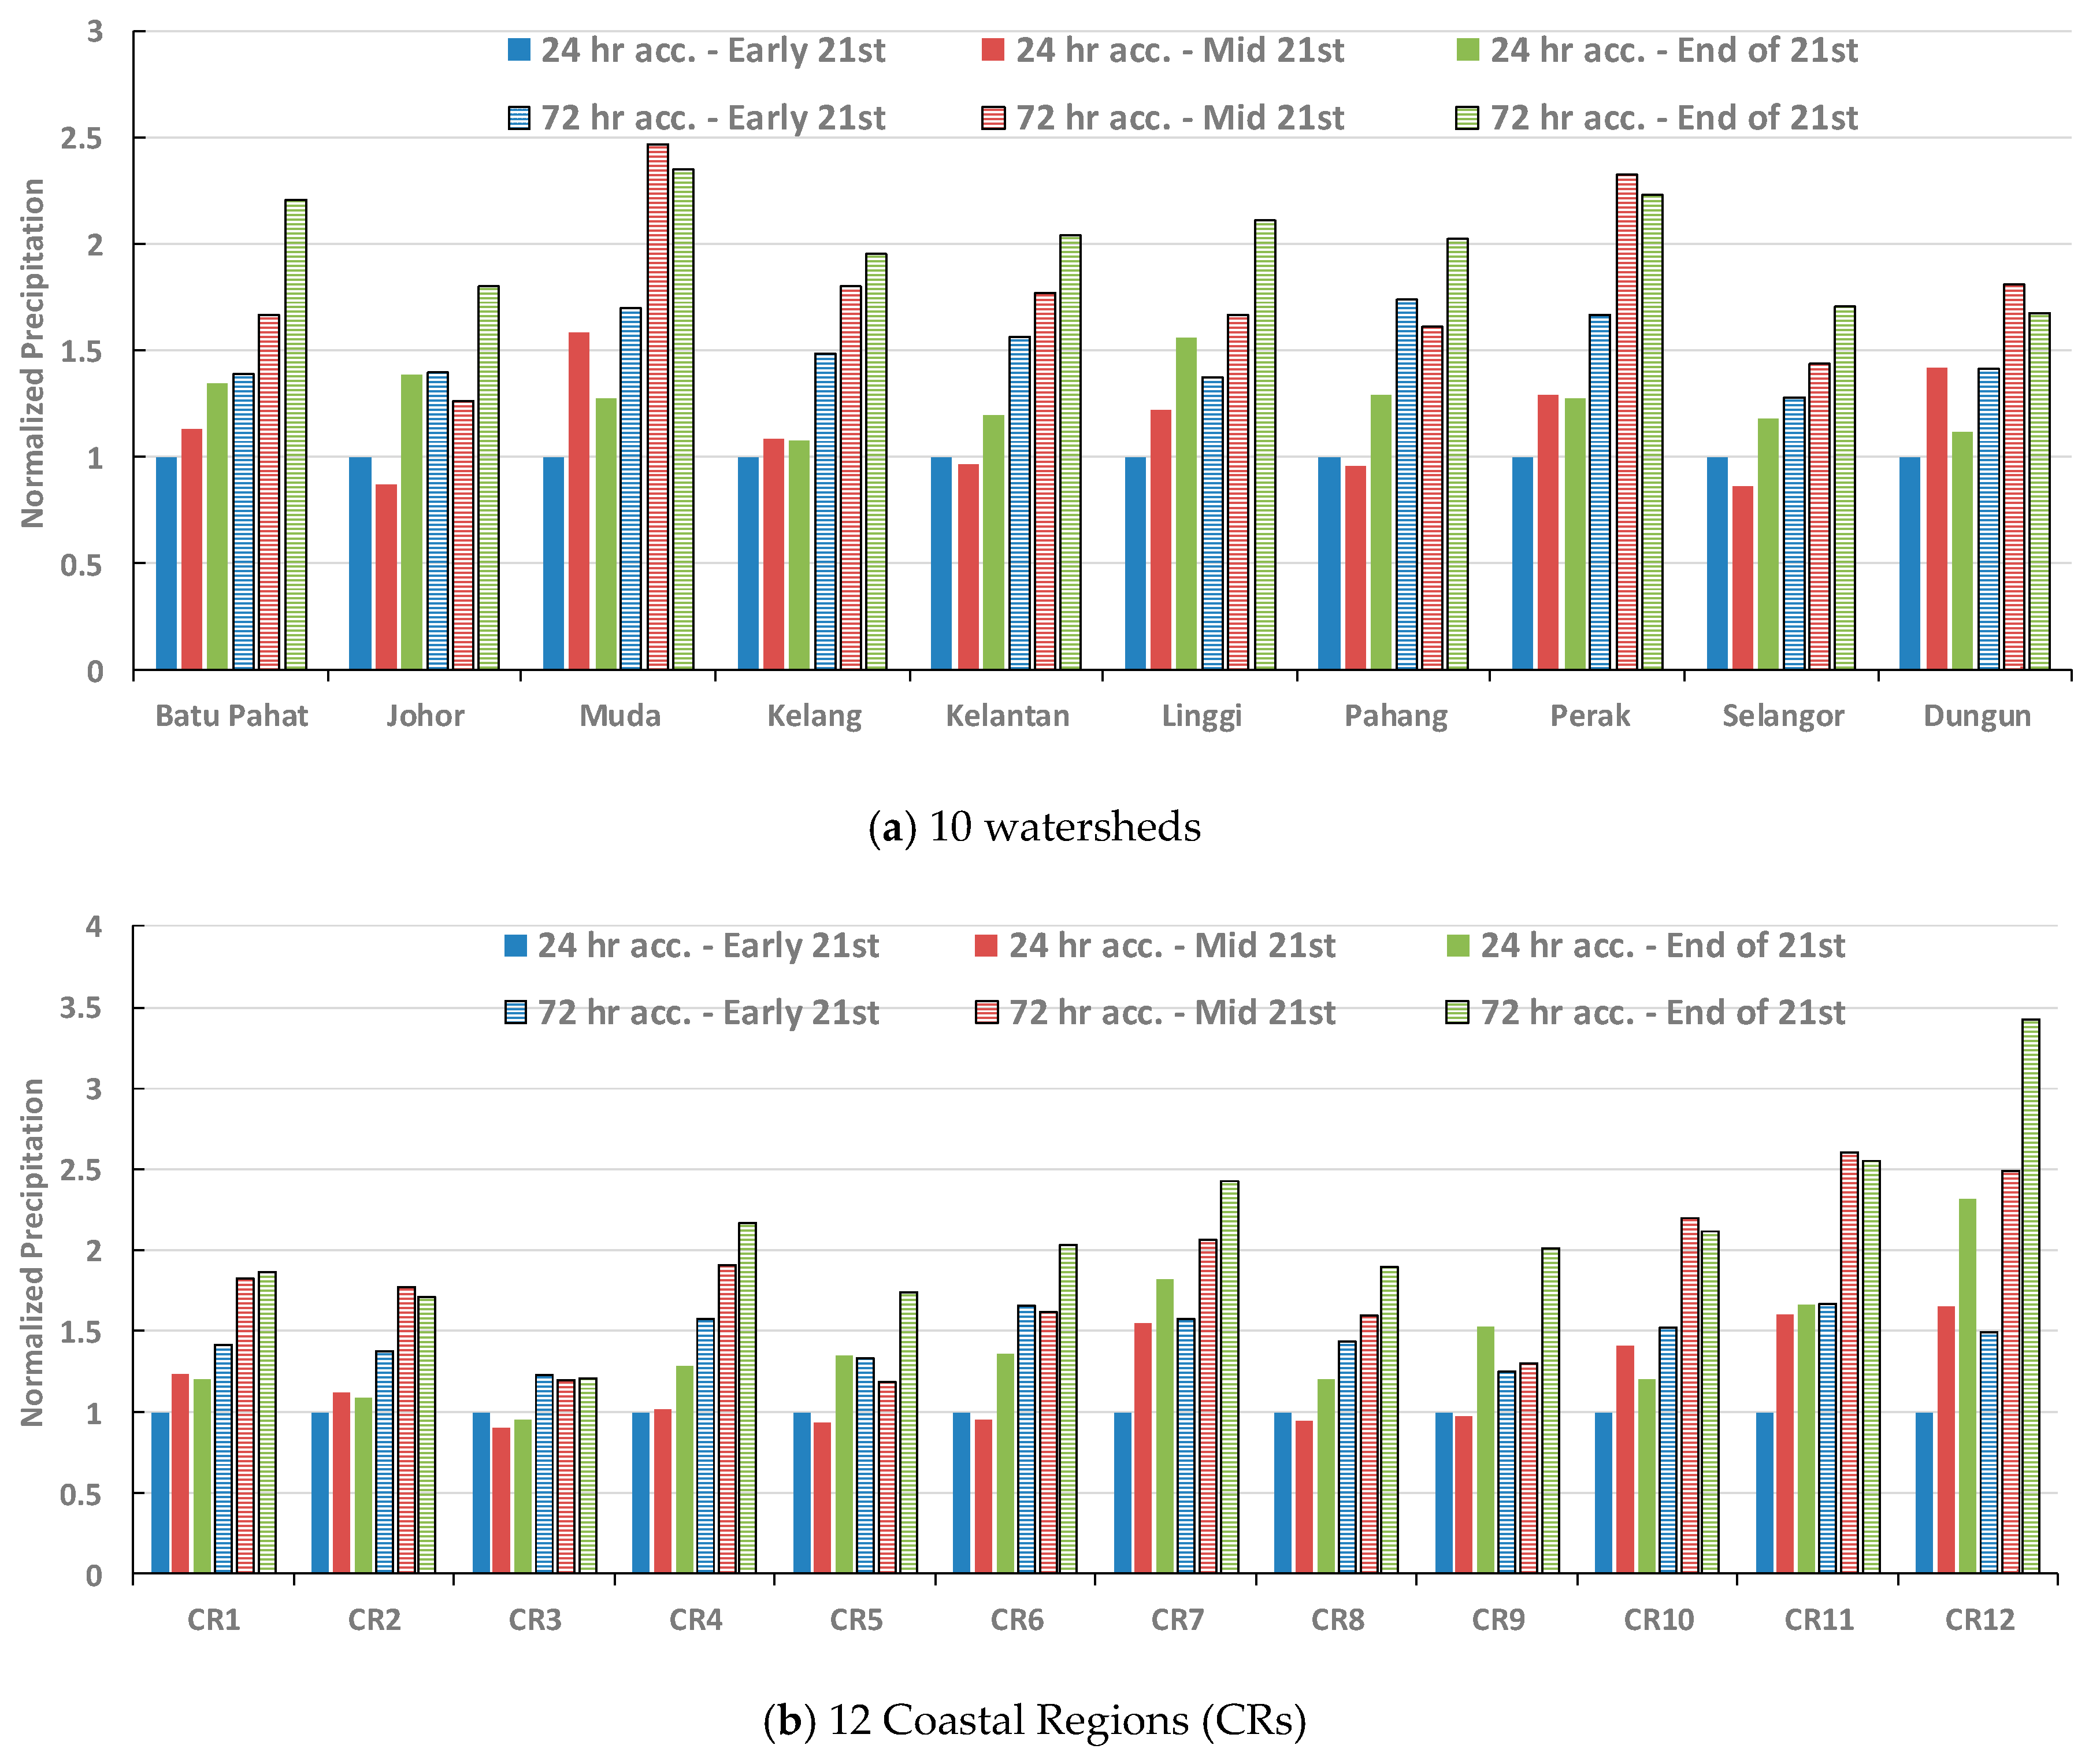
According to American Meteorological Society [42], probable maximum precipitation (PMP) is defined as the greatest depth of precipitation for a given duration that is physically possible over a given size storm area at a particular geographical location at a certain time of year. PMP values are calculated in an area for durations 6- to 72-h [43]. As such, the normalized values of 24- and 72-h accumulated precipitation for the 100-year return period values through the 21st century (for the periods of 2010–2040, 2040–2070, and 2070–2100) were investigated in this study as indicators of the relative change in extreme precipitation potential in the watersheds and coastal regions of Peninsular Malaysia.
Normalized 24-h and 72-h accumulated precipitation for 100-year return period over the selected watersheds and coastal regions through the 21st century is depicted in Figure 7. This figure represents the relative change in 24-h and 72-h accumulated precipitation through the 21st century with respect to 24-hour accumulated precipitation in the early 21st century. The maximum increase in the 24-h accumulated precipitation is 59 percent in Muda and 65 percent in CR12 at the middle 21st century, and 56 percent in Linggi and 131 percent in CR12 at the end of 21st century. The maximum increase in 72-h accumulated precipitation is 74 percent in Pahang and 66 percent in CR11 at the early 21st century, 147 percent in Muda and 160 percent in CR11 at the middle 21st century, and 135 percent in Muda and 243 percent in CR12 at the end of 21st century.
The accumulated precipitation values for 100-year return period do not always increase through the 21st century. The 24-h accumulated precipitation values increase through the 21st century in Batu Pahat, and Linggi watersheds, and in CR4, CR7, CR11, and CR12. Similarly, the 72-h accumulated precipitation values increase through the 21st century in Batu Pahat, Kelang, Kelantan, Linggi, and Selangor watersheds, and in CR1, CR4, CR7, CR8, CR9, and CR12. Both 24-h and 72-h accumulated precipitation values are higher in Johor, and Pahang watersheds, and in CR3, and CR5 during the early 21st century as compared to the middle 21st century. They are also higher in Muda, Perak, and Dungun watersheds, and in CR2, and CR10 during the middle 21st century as compared to the end of 21st century.
Reviewing the literature on historical and future hydro-climate over Malaysia, Tang [44] concluded that days with extreme rainfall events have been on the rise since 1980s, and future projections point to continuous rise of temperature in the 21st century, highly variable rainfall, and increased frequency of extreme weather events. Furthermore, climate models project a general intensification of extreme precipitation events during the twenty-first century on continental to global spatial scales [3,45]. Partly due to the natural variability, and local differences in atmospheric thermodynamics and dynamics, change in extreme precipitation in regional to local scales can vary from the global increase [3,45]. The findings on the local variability of precipitation and rising precipitation extremes in this study is consistent with the literature. Such regional variation in precipitation will also influence variations in soil water storage and river flows, as discussed below.
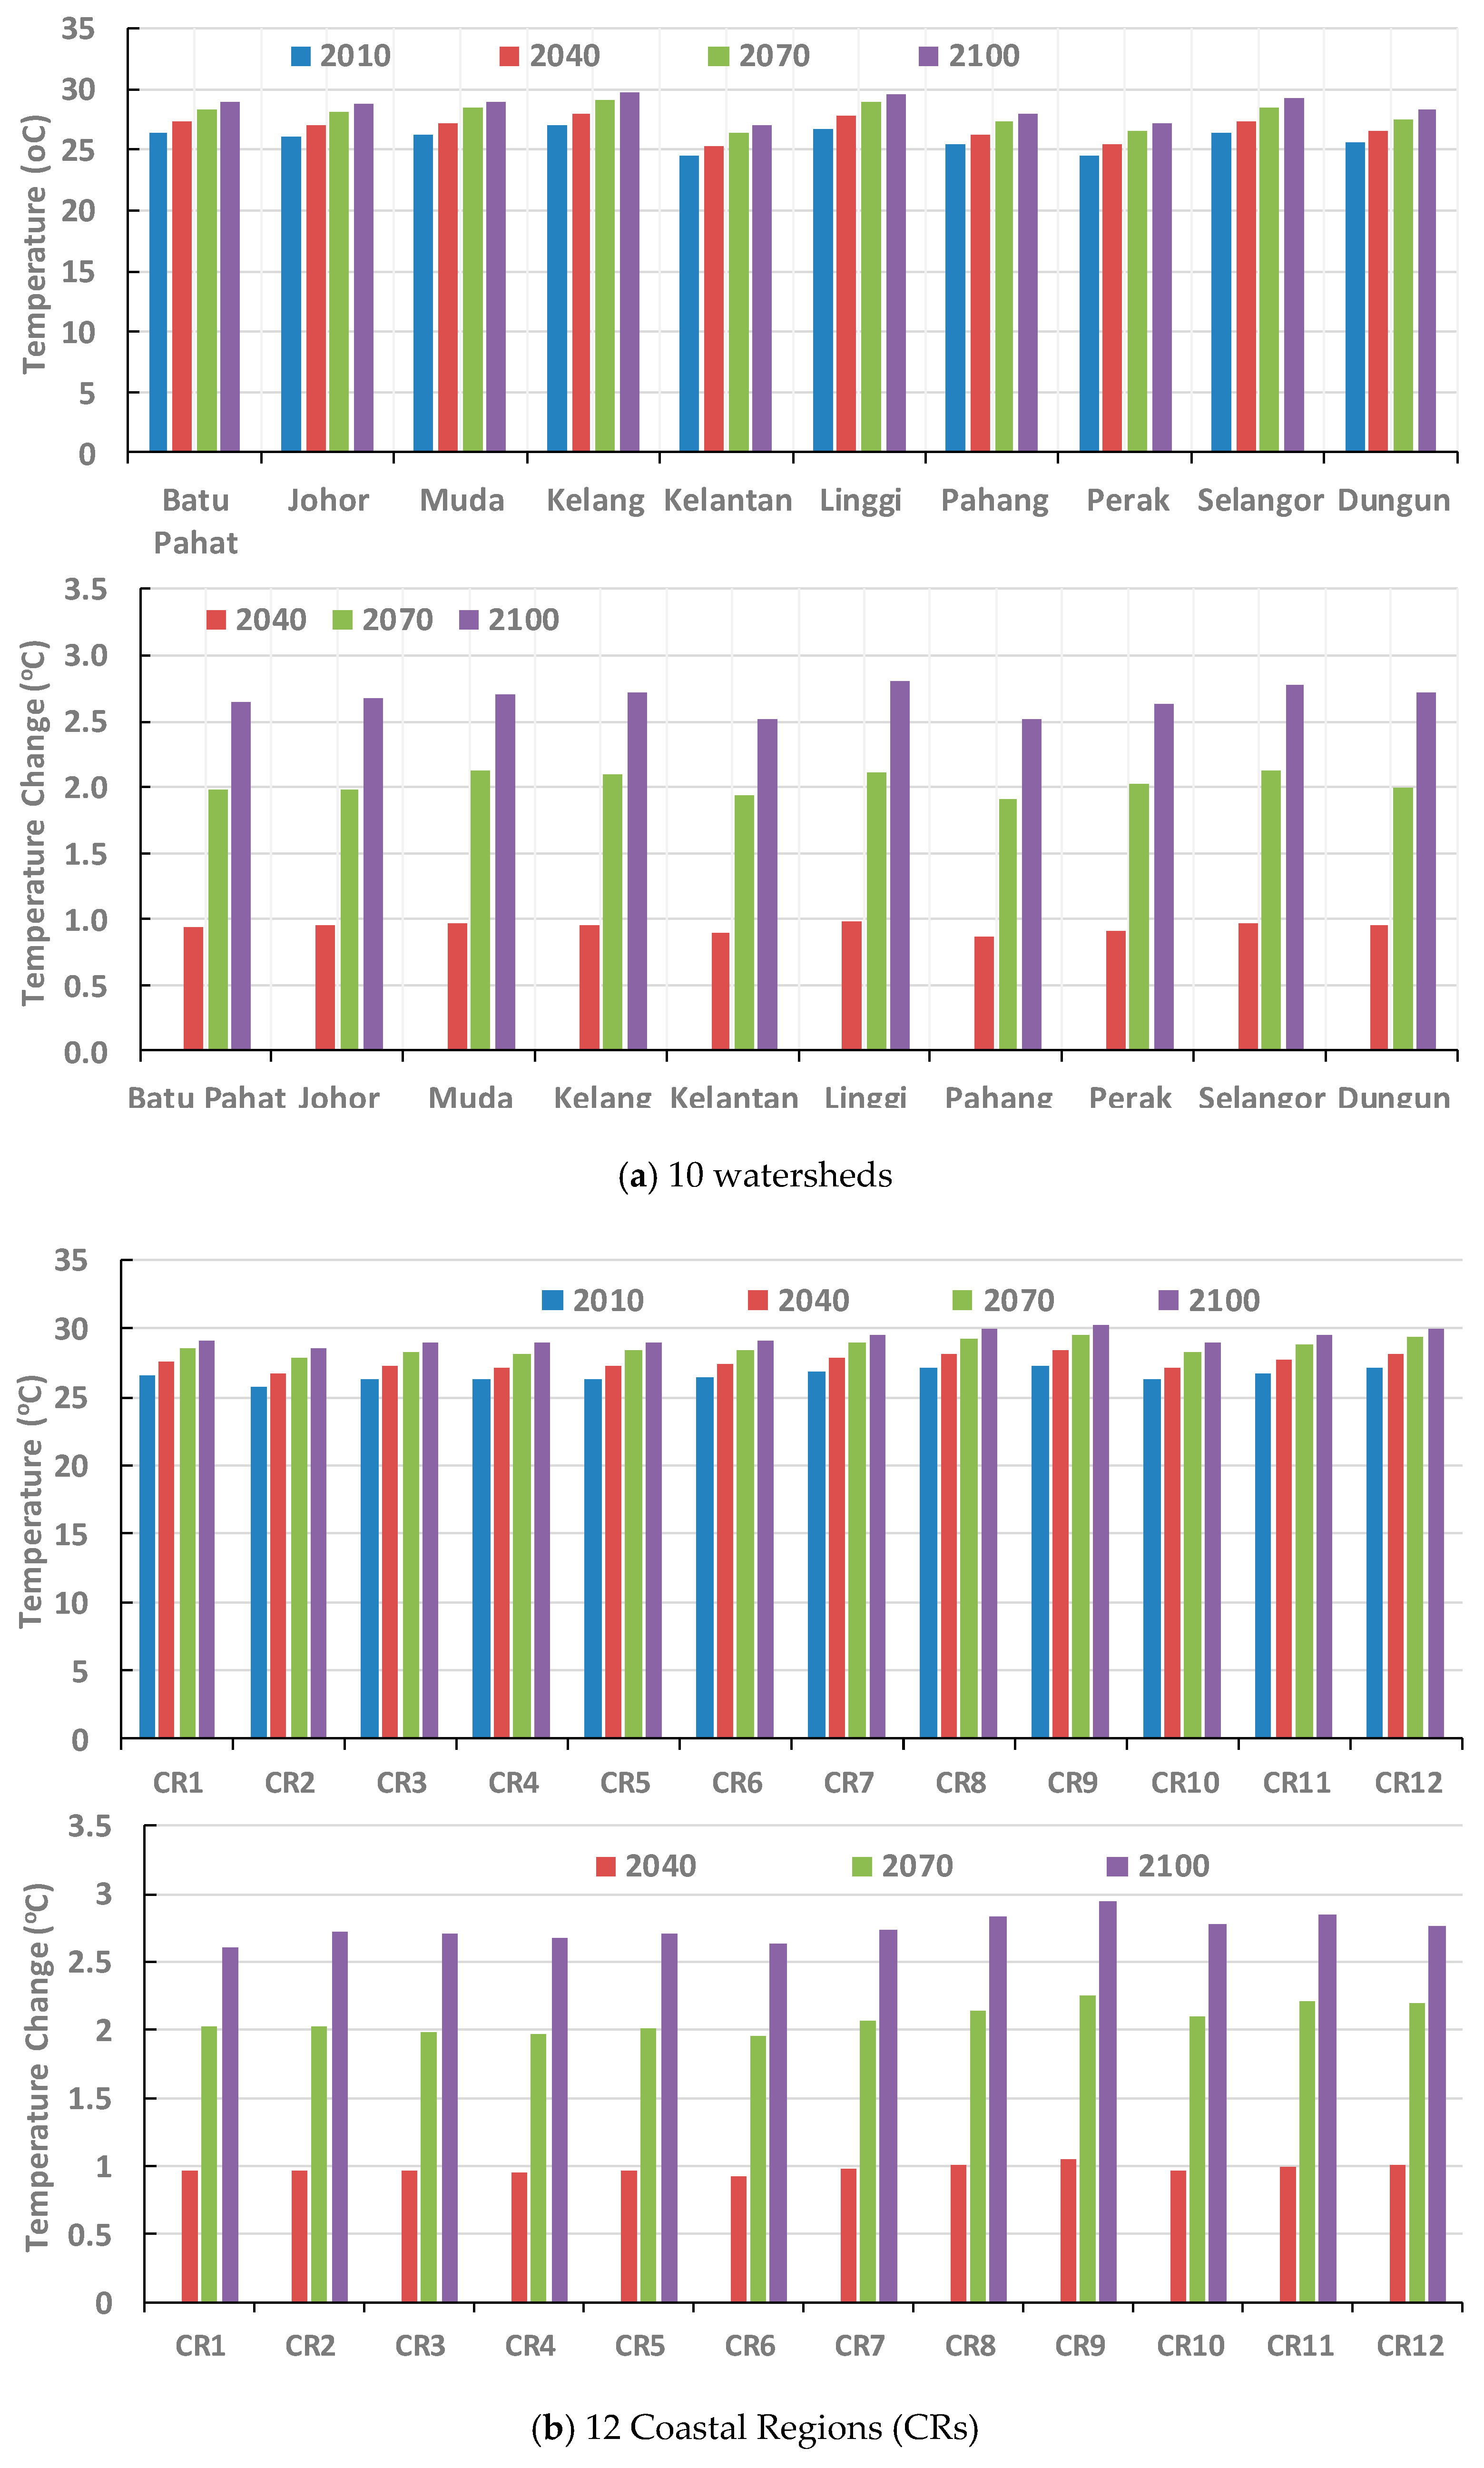
As demonstrated in Figure 8, the ensemble average of the basin-average annual mean air temperature will increase over all of the 10 watersheds and 12 coastal regions during the 21st century. The increase during the period 2010–2100 will vary from 2.52 °C in Kelantan and Pahang to 2.80 °C in Linggi for the 10 watersheds, and from 2.60 °C in CR1 to 2.95 °C in CR9 for the 12 coastal regions.
The annual mean air temperature increases about 1 °C over all of the selected watersheds and coastal regions from 2010 to 2040, and from 2040 to 2070. The increase in the annual mean air temperature from 2040 to 2070 is slightly larger than that from 2010 to 2040. Moreover, the change in the annual mean air temperature from 2070 to 2100 is less than the other 30-year periods in the 21st century. The annual mean air temperature increases the most in the west coast area, and the least in the mountainous area. Estimates of temperature increase over Peninsular Malaysia in the 21st century is consistent with the likely range of the projected global average surface temperature increase, as presented in Figure 10.5 and Table 10.5 in Meehl et al. [46].
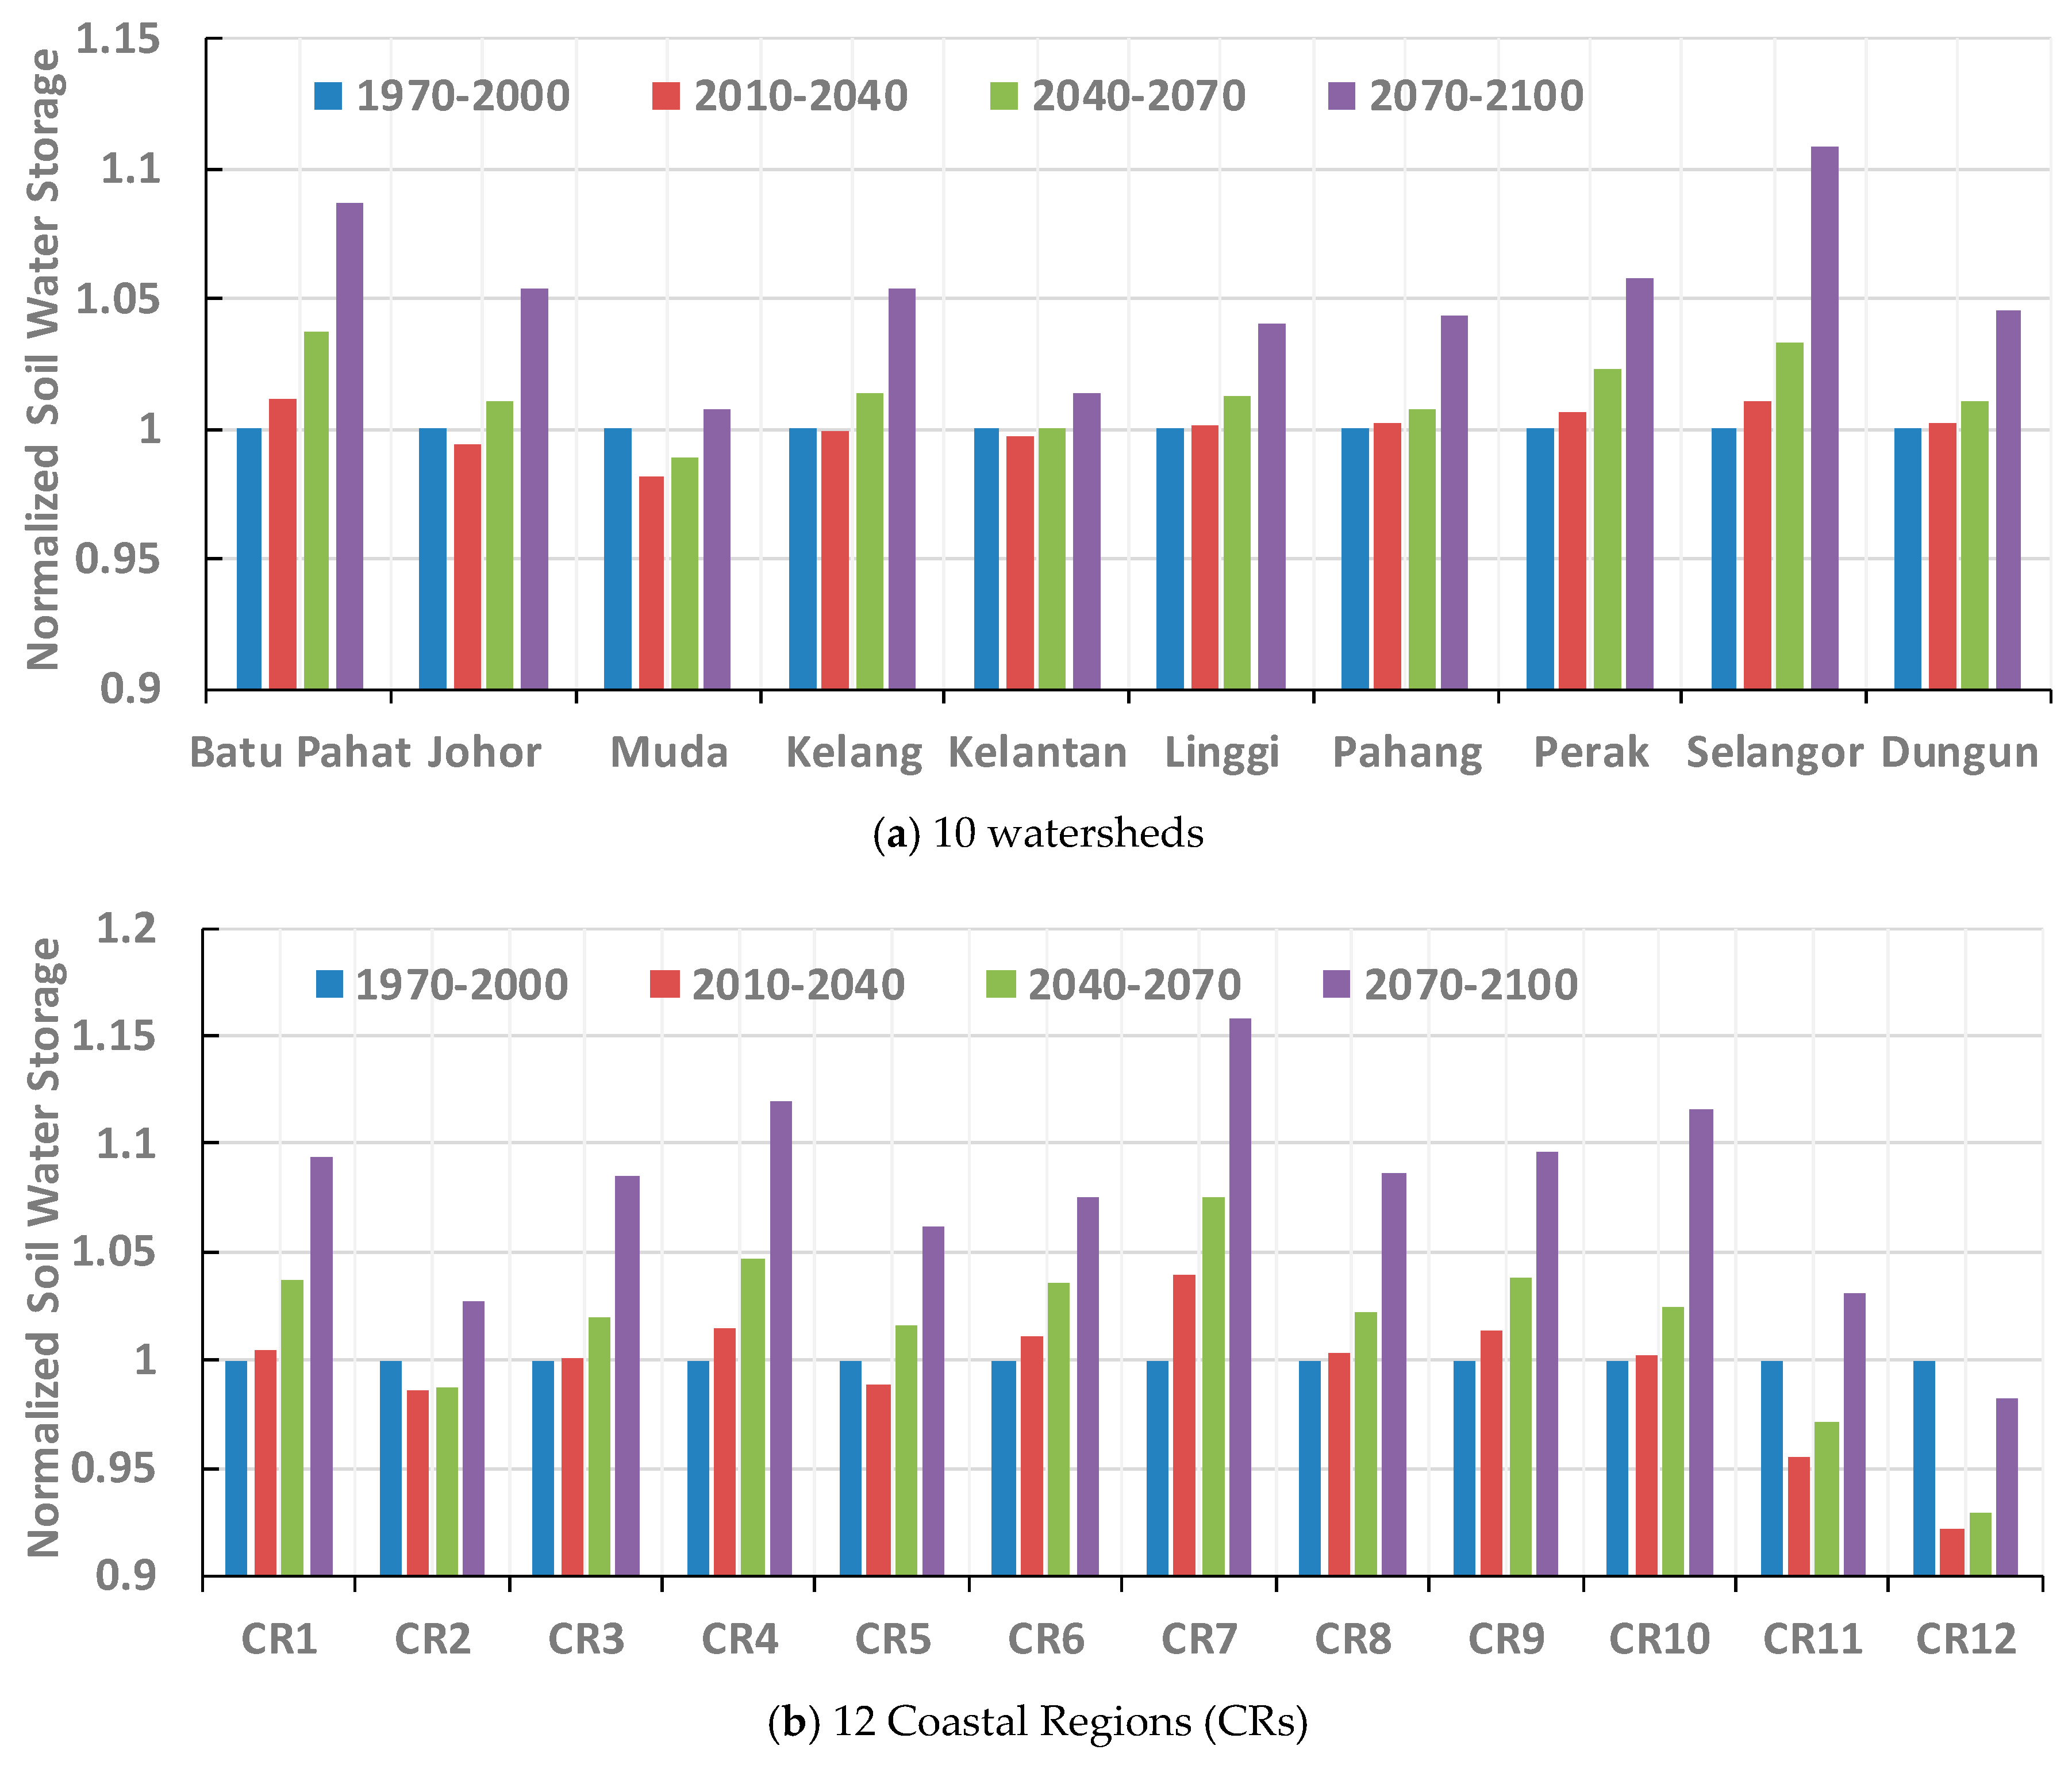
Soil water storage is a function of the nonlinear processes in the atmosphere, land use/land cover, and soil. Since there was no soil water storage observation at the scale of Peninsular Malaysia, the calibration and validation of the simulations for this variable were not possible. Therefore, the comparison of the water storage in each watershed and coastal region was performed based on the relative change from the historical 1970-2000 period, as shown in Figure 9. In comparison to the historical period, the change in the 30-year mean of the basin-average annual mean soil water storage over the 10 watersheds will vary from −1.8 percent in Muda to 1.2 percent in Batu Pahat during the early 21st century, −1.1 percent in Muda to 3.7 percent in Batu Pahat during the middle 21st century, and 0.7 percent in Muda to 10.9 percent in Selangor during the end of 21st century. On other hand, the change over the 12 coastal regions will vary from −7.8 percent in CR12 to 3.9 percent in CR7 in the early 21st century, −7.1 percent in CR12 to 7.5 percent in CR7 in the middle 21st century, and −1.7 percent in CR12 to 15.8 percent in CR7 during the end of the 21st century.
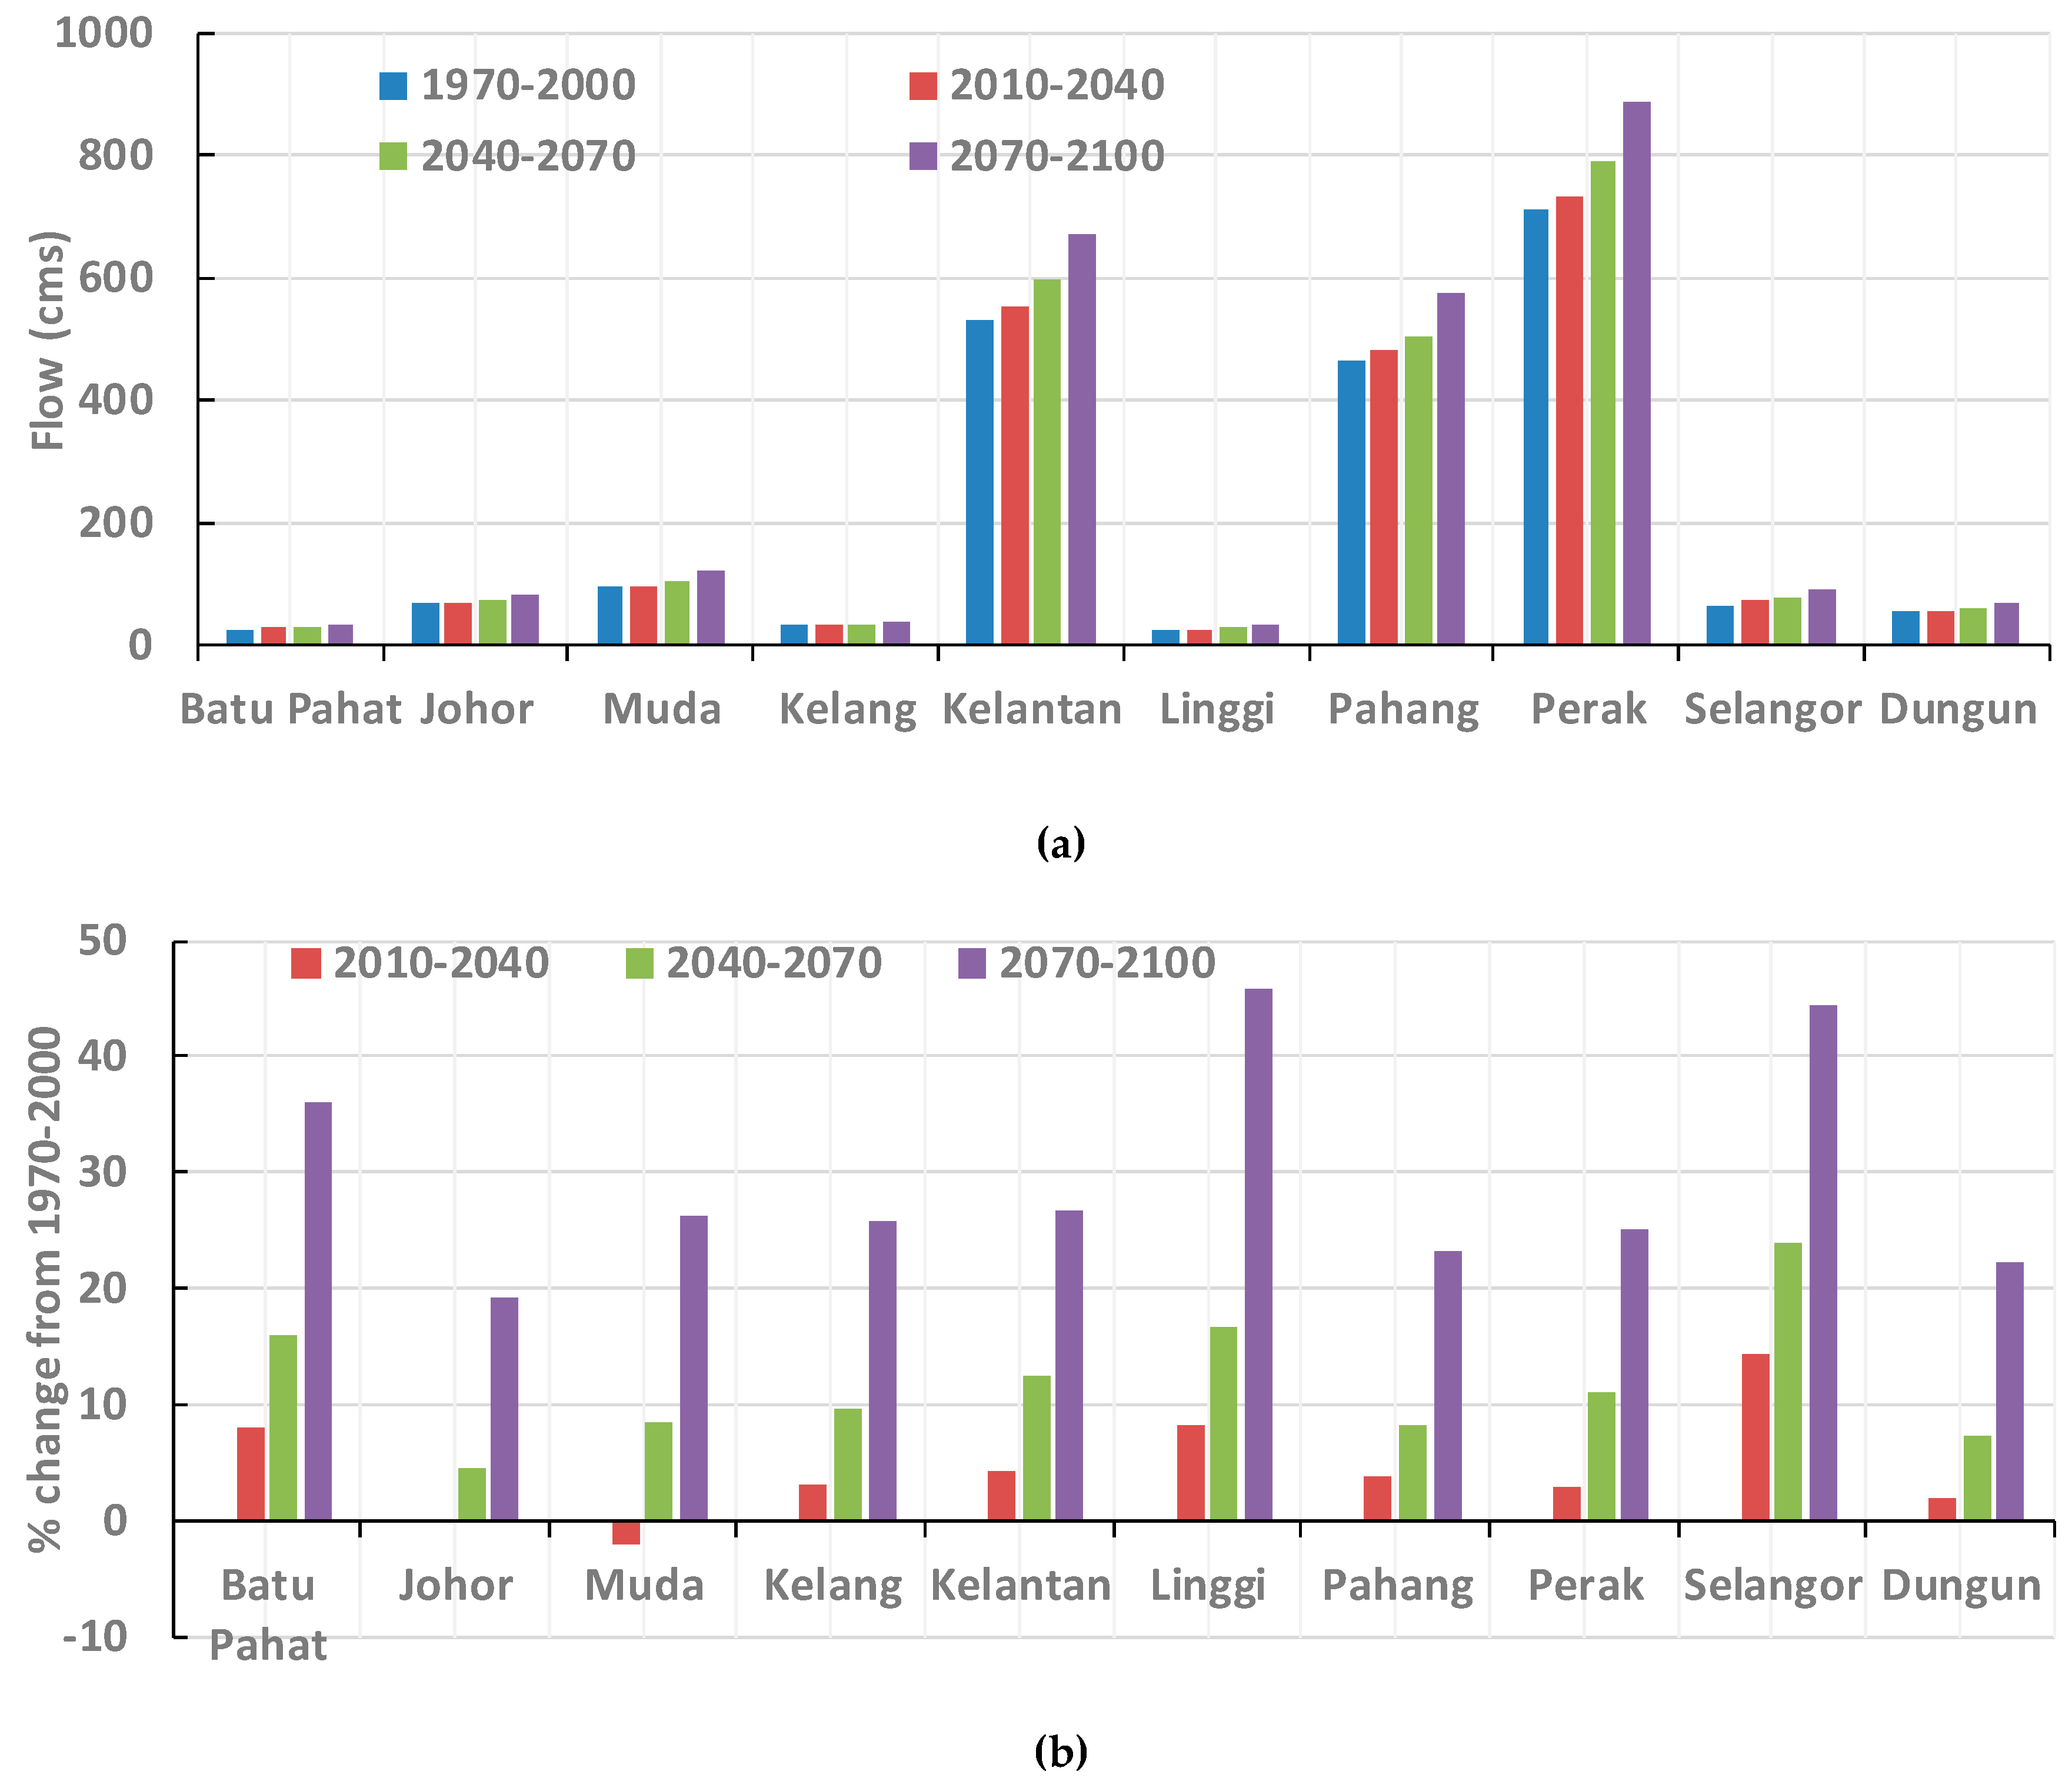
Analyzing monthly river flow observations (6 stations in Peninsular Malaysia and 7 stations in Sabah and Sarawak), Rao et al. [47] concluded that Malaysian runoff data do not have statistically significant trends in the observed 20- to 30-year duration after year 1978. Employing statistical downscaling by A2 and B2 scenarios and using HEC-HMS hydrological modeling, Kabiri et al. [48] predicted that the mean annual discharge in Kelang watershed will be decreasing by 9. percent, and increasing by 3.4 percent for the A2 scenario; and decreasing by 17.3, 14.3 and 6.2 percent for the B2 scenario, respectively, in the 2020s, 2050s, and 2080s. On the other hand, our analysis showed that each of the 15 projections may result in different flow conditions over the 10 watersheds. Therefore, selecting a limited number of projections may undermine the flow analyses. Ensemble averages of the annual mean flows of the 15 dynamically downscaled GCM projections show increasing trends for the selected watersheds, especially during the second half of the 21st century. 30-year average annual mean flows during the historical and projected future periods, for each of the 10 watersheds are shown in Figure 10. In comparison to the historical period, the change in the 30-year average annual mean flows will vary from −2.1 percent in Muda to 14.3 percent in Selangor during the early 21st century, 4.4 percent in Johor to 23.8 percent in Selangor during the middle 21st century, and 19.1 percent in Johor to 45.8 percent in Linggi during the end of 21st century.
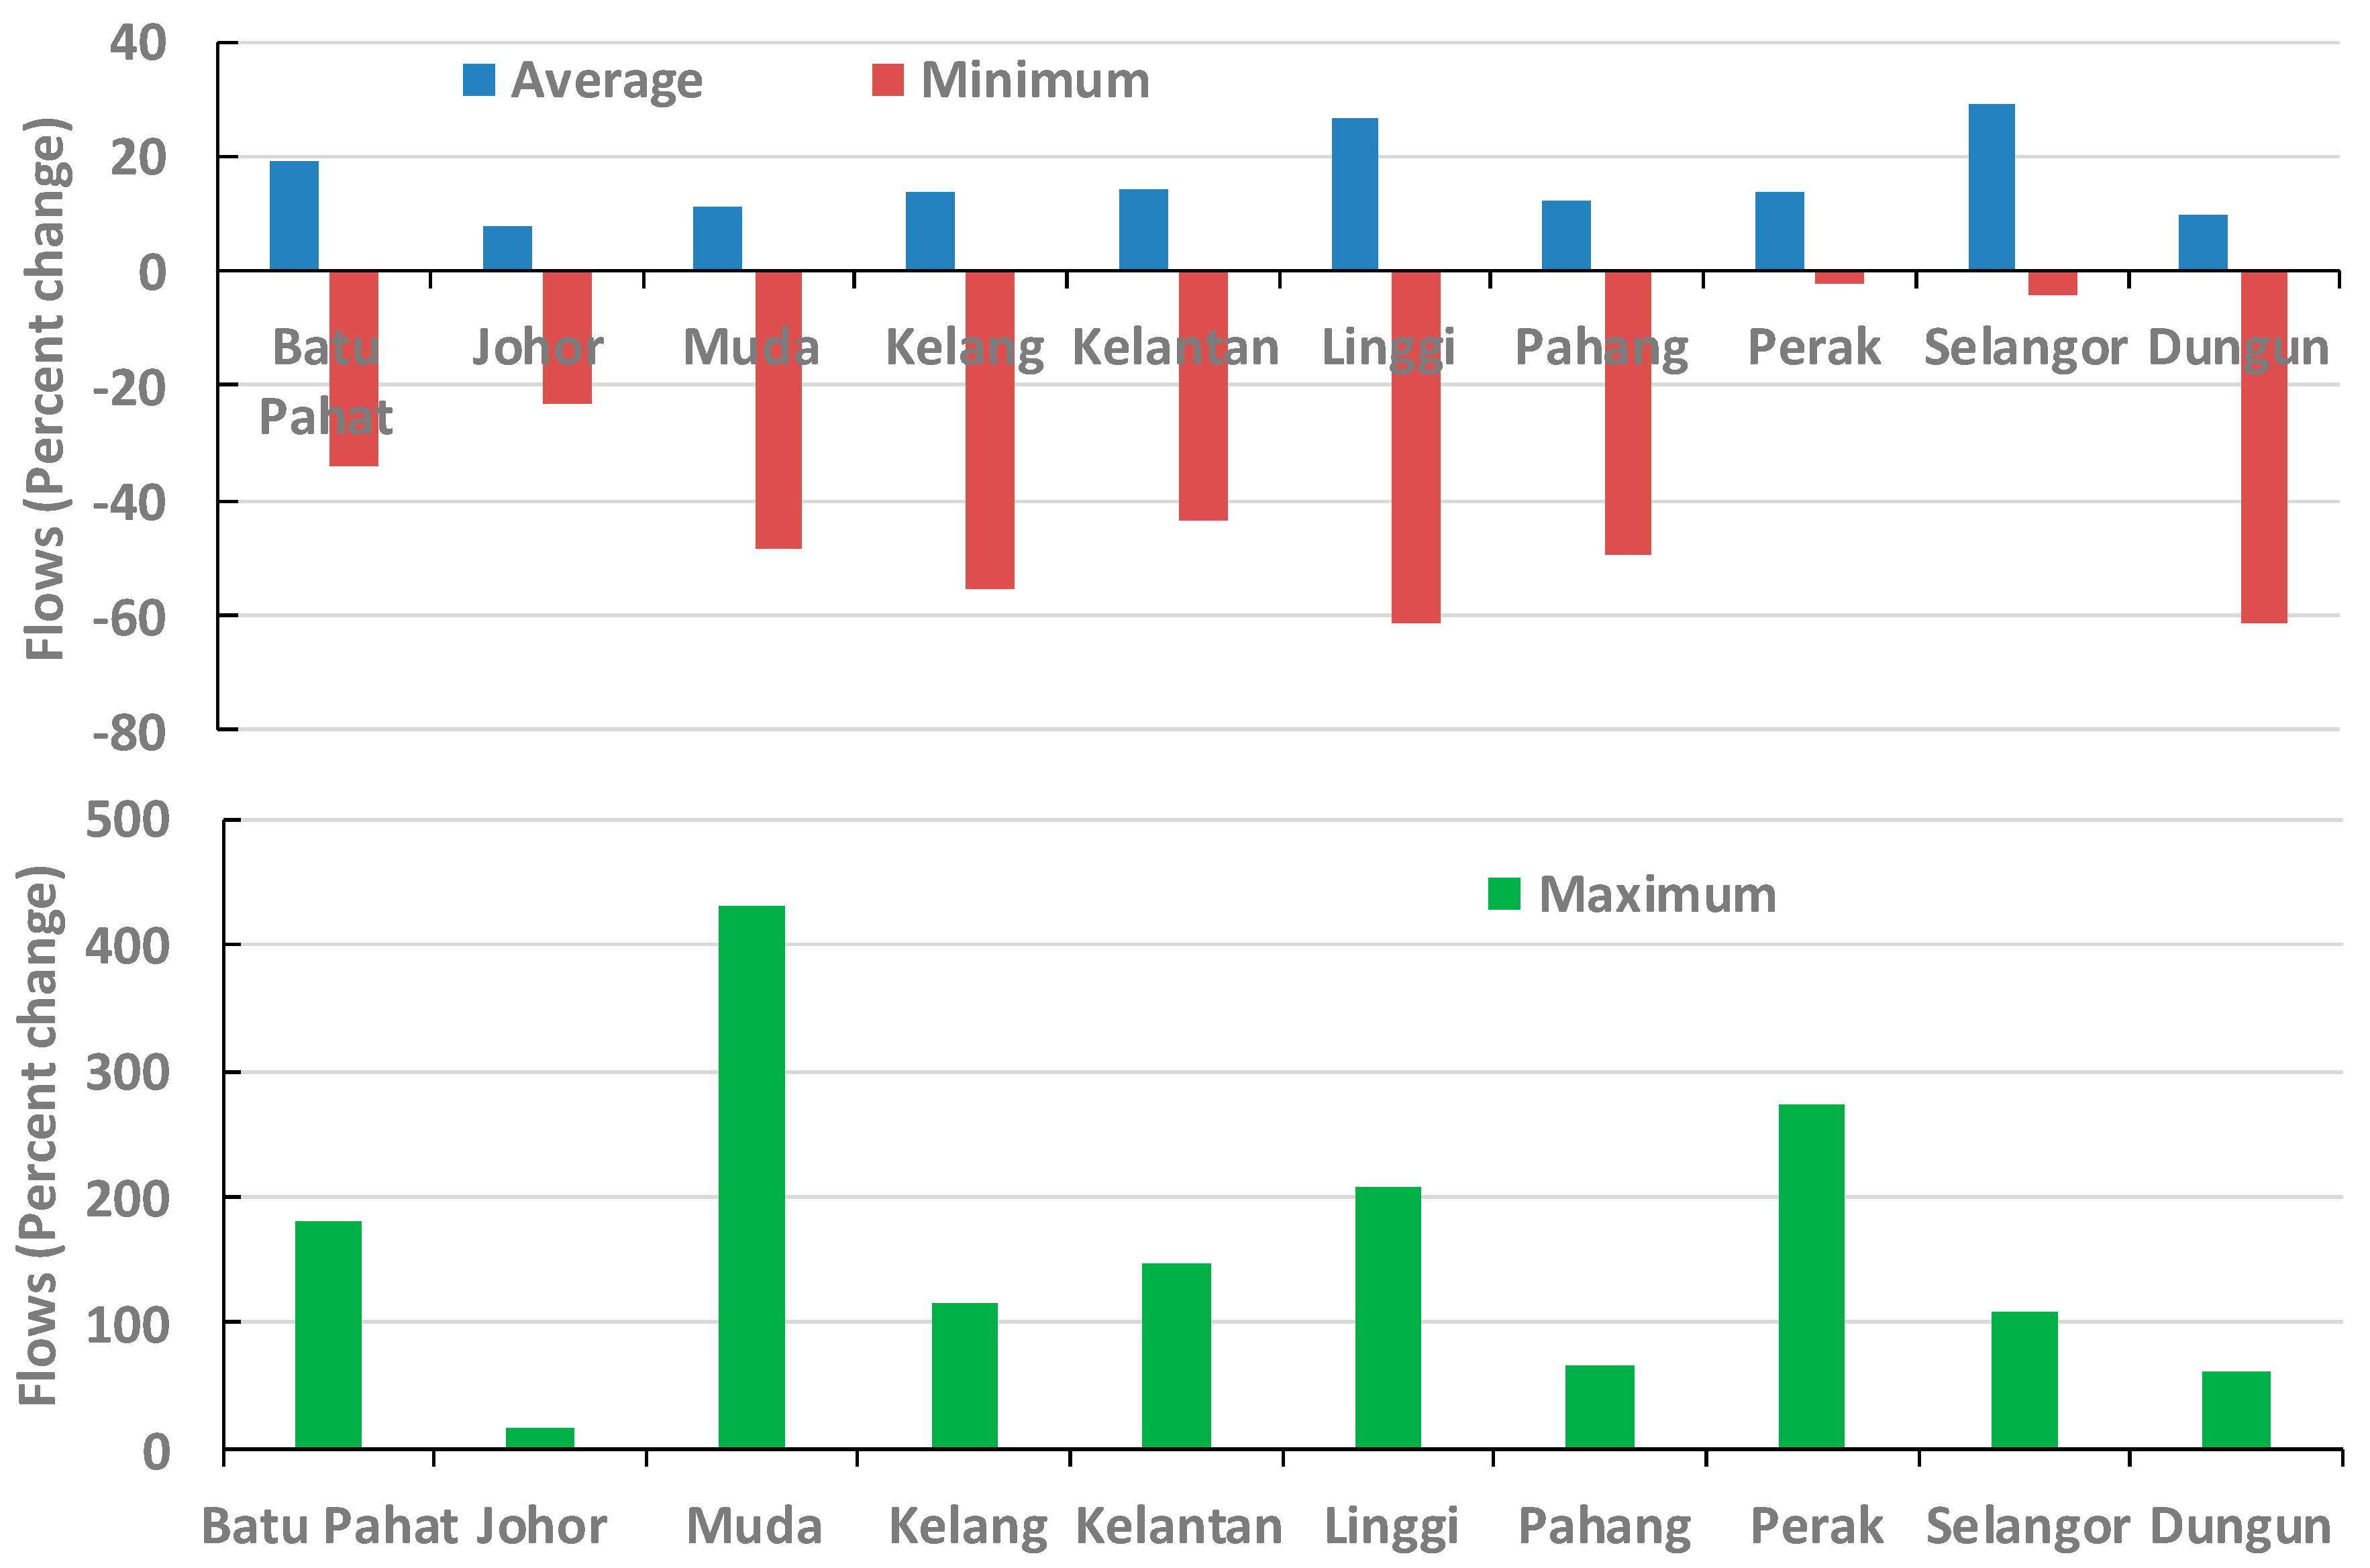
Relative change in minimum, average, and maximum mean monthly river flows during the future 2010–2100 period in comparison to those during the historical 1970–2000 period shows how the low, average, and high flows are affected by the future climate change. Figure 11 shows the percent change values in the mean monthly river flows during the future 2010–2100 period (based on downscaled GCM projections) from those during the historical 1970–2000 period (based on downscaling of GCM control runs). The average mean monthly flows will increase between 8 percent (in Johor) to 29 percent (in Selangor), and the maximum mean monthly flows will increase between 17 percent (in Johor) to 430 percent (in Muda). On the other hand, the minimum mean monthly flows will decrease between 2 percent (in Perak) to 62 percent (in Linggi).
Conventionally, water management systems and infrastructure have been designed according to historical observations of hydro-climate and consumption trends, and the main assumption in such calculations is that climate and hydrological systems behave as stationary systems [49]. However, recent studies showed that historical observations of the hydro-climate are no longer adequate to meaningfully plan for climate variability and extremes [1,37,49]. Within this framework, the findings of the current study may provide important results and analysis for water resources of Peninsular Malaysia in the 21st century. When water supply information, presented above as precipitation and river flow, is combined with water demand projections, water resources sustainability within major watersheds of Peninsular Malaysia can be assessed comprehensibly. Furthermore, due to changing climate regimes [9,10], the results of this study have also implications on coastal hydrology, water quality, and ecosystems over Peninsular Malaysia.
5. Conclusions
A physically-based hydrology model, WEHY, was coupled with a regional climate model, MM5, to investigate the impacts of climate change on the hydroclimate conditions of Peninsular Malaysia during the 21st century for an ensemble of 15 climate projections by 3 different GCMs under 4 different greenhouse gas emission scenarios. It was found that the change in the 30-year mean annual precipitation from 1970–2000 period to 2070–2100 period will vary from 17.1 percent to 36.3 percent among the 10 watersheds of Peninsular Malaysia, and 22.9 percent to 45.4 percent among its 12 coastal regions. The increase in the ensemble average of the basin-average annual mean air temperature during 2010–2100 will vary from 2.52 °C to 2.80 °C for the 10 watersheds, and from 2.60 °C to 2.95 °C for the 12 coastal regions. The annual mean air temperature increases the most in the west coast area, and the least in the mountainous area.
In comparison to the 1970–2000 historical period, the change in the 30-year mean of the basin-average annual mean soil water storage over the 10 watersheds will vary from 0.7 percent to 10.9 percent during the 2070–2100 period, and that over the twelve coastal regions will vary from −1.7 percent to 15.8 percent. On the other hand, in comparison to the 1970–2000 historical period, the change in the 30-year average annual mean flows will vary from −2.1 percent to 14.3 percent during the 2010–2040 period, 4.4 percent to 23.8 percent during the 2040–2070 period, and 19.1 percent to 45.8 percent during the 2070–2100 period. Furthermore, compared to the 1970–2000 period, the maximum mean monthly flows during the 2010–2100 period will increase between 17 to 430 percent, and the minimum mean monthly flows during 2010–2100 will decrease between 2 to 62 percent.
Author Contributions
Conceptualization, formal analysis, original draft, and revisions: I.M.Z.b.M.A., A.E., K.I., M.L.K., S.-H.J., and Z.Q.C. Visualization: A.E., K.I., S.-H.J.
Funding
This research was funded by National Hydraulic Research Institute of Malaysia (NAHRIM).
Acknowledgments
Authors thank the Department of Irrigation and Drainage of Malaysia for the hydrological data; Malaysia Meteorological Department for climate data; and the Department of Agriculture of Malaysia for land use and soil data.
Conflicts of Interest
The authors declare no conflict of interest.
References
- IPCC. Climate Change 2013: The Physical Science Basis. Contribution of Working Group I to the Fifth Assessment Report of the Intergovernmental Panel on Climate Change; Stocker, T.F., Qin, D., Plattner, G.K., Tignor, M., Allen, S.K., Boschung, J., Nauels, A., Xia, Y., Bex, V., Midgley, P.M., Eds.; Cambridge University Press: Cambridge, UK; New York, NY, USA, 2013; p. 1535. [Google Scholar]
- Trenberth, K.E. Changes in precipitation with climate change. Clim. Res. 2011, 47, 123–138. [Google Scholar] [CrossRef] [Green Version]
- Pfahl, S.; O’Gorman, P.A.; Fischer, E.M. Understanding the regional pattern of projected future changes in extreme precipitation. Nat. Clim. Chang. 2017, 7, 423–427. [Google Scholar] [CrossRef]
- Mukherjee, S.; Saran, A.; Stone, D.; Mishra, V. Increase in extreme precipitation events under anthropogenic warming in India. Weather Clim. Extrem. 2018, 20, 45–53. [Google Scholar] [CrossRef]
- Du, J.B.; Park, K.; Dellapenna, T.M.; Clay, J.M. Dramatic hydrodynamic and sedimentary responses in Galveston Bay and adjacent inner shelf to Hurricane Harvey. Sci. Total Environ. 2019, 653, 554–564. [Google Scholar] [CrossRef] [PubMed]
- Brown, C.; Lall, U. Water and economic development: The role of variability and a framework for resilience. Nat. Resour. Forum 2006, 30, 306–317. [Google Scholar] [CrossRef]
- Grey, D.; Sadoff, C. Water for Growth and Development. A Theme Document of the Fourth World Water Forum; The World Bank: Washington, DC, USA, 2006. [Google Scholar]
- Bank, W. Towards a Water-Secure Kenya. Water Resources Sector Memorandum; The World Bank: Washington, DC, USA, 2004. [Google Scholar]
- Scavia, D.; Field, J.C.; Boesch, D.F.; Buddemeier, R.W.; Burkett, V.; Cayan, D.R.; Fogarty, M.; Harwell, M.A.; Howarth, R.W.; Mason, C.; et al. Climate change impacts on US coastal and marine ecosystems. Estuaries 2002, 25, 149–164. [Google Scholar] [CrossRef]
- Du, J.B.; Shen, J.; Park, K.; Wang, Y.P.; Yu, X. Worsened physical condition due to climate change contributes to the increasing hypoxia in Chesapeake Bay. Sci. Total Environ. 2018, 630, 707–717. [Google Scholar] [CrossRef]
- Jang, S.; Kavvas, M.L. Downscaling Global Climate Simulations to Regional Scales: Statistical Downscaling versus Dynamical Downscaling. J. Hydrol. Eng. 2015, 20. [Google Scholar] [CrossRef]
- Suhaila, J.; Jemain, A.A. Investigating the impacts of adjoining wet days on the distribution of daily rainfall amounts in Peninsular Malaysia. J. Hydrol. 2009, 368, 17–25. [Google Scholar] [CrossRef]
- Mayowa, O.O.; Pour, S.H.; Shahid, S.; Mohsenipour, M.; Bin Harun, S.; Heryansyah, A.; Ismail, T. Trends in rainfall and rainfall-related extremes in the east coast of peninsular Malaysia. J. Earth Syst. Sci. 2015, 124, 1609–1622. [Google Scholar] [CrossRef] [Green Version]
- Tangang, F.; Farzanmanesh, R.; Mirzaei, A.; Supari; Salimun, E.; Jamaluddin, A.F.; Juneng, L. Characteristics of precipitation extremes in Malaysia associated with El Nino and La Nina events. Int. J. Climatol. 2017, 37, 696–716. [Google Scholar] [CrossRef]
- Syafrina, A.H.; Zalina, M.D.; Juneng, L. Historical trend of hourly extreme rainfall in Peninsular Malaysia. Theor. Appl. Climatol. 2015, 120, 259–285. [Google Scholar] [CrossRef]
- Wong, C.L.; Venneker, R.; Jamil, A.B.M.; Uhlenbrook, S. Development of a gridded daily hydrometeorological data set for Peninsular Malaysia. Hydrol. Process. 2011, 25, 1009–1020. [Google Scholar] [CrossRef]
- Shaaban, A.J.; Amin, M.Z.M.; Chen, Z.Q.; Ohara, N. Regional Modeling of Climate Change Impact on Peninsular Malaysia Water Resources. J. Hydrol. Eng. 2011, 16, 1040–1049. [Google Scholar] [CrossRef]
- Amin, M.Z.M.; Shaaban, A.J.; Ercan, A.; Ishida, K.; Kavvas, M.L.; Chen, Z.Q.; Jang, S. Future climate change impact assessment of watershed scale hydrologic processes in Peninsular Malaysia by a regional climate model coupled with a physically-based hydrology modelo. Sci. Total. Environ. 2017, 575, 12–22. [Google Scholar] [CrossRef] [PubMed]
- Cruz, F.T.; Narisma, G.T.; Dado, J.B.; Singhruck, P.; Tangang, F.; Linarka, U.A.; Wati, T.; Juneng, L.; Phan-Van, T.; Ngo-Duc, T.; et al. Sensitivity of temperature to physical parameterization schemes of RegCM4 over the CORDEX-Southeast Asia region. Int. J. Climatol. 2017, 37, 5139–5153. [Google Scholar] [CrossRef]
- Hawkins, E.; Sutton, R. The Potential to Narrow Uncertainty in Regional Climate Predictions. Bull. Am. Meteorol. Soc. 2009, 90, 1095. [Google Scholar] [CrossRef]
- Nashwan, M.S.; Shahid, S.; Chung, E.S.; Ahmed, K.; Song, Y.H. Development of Climate-Based Index for Hydrologic Hazard Susceptibility. Sustainability-Basel 2018, 10, 2182. [Google Scholar] [CrossRef]
- Kavvas, M.L.; Kure, S.; Chen, Z.Q.; Ohara, N.; Jang, S. WEHY-HCM for Modeling Interactive Atmospheric-Hydrologic Processes at Watershed Scale. I: Model Description. J. Hydrolog Eng. 2013, 18, 1262–1271. [Google Scholar] [CrossRef]
- Kavvas, M.L.; Chen, Z.Q.; Tan, L.; Soong, S.T.; Terakawa, A.; Yoshitani, J.; Fukami, K. A regional-scale land surface parameterization based on areally-averaged hydrological conservation equations. Hydrolog. Sci. J. 1998, 43, 611–631. [Google Scholar] [CrossRef]
- Kavvas, M.L.; Chen, Z.Q.; Dogrul, C.; Yoon, J.Y.; Ohara, N.; Liang, L.; Aksoy, H.; Anderson, M.L.; Yoshitani, J.; Fukami, K.; et al. Watershed Environmental Hydrology (WEHY) model based on upscaled conservation equations: Hydrologic module. J. Hydrol. Eng. 2004, 9, 450–464. [Google Scholar] [CrossRef]
- Chen, Z.Q.; Kavvas, M.L.; Fukami, K.; Yoshitani, J.; Matsuura, T. Watershed Environmental Hydrology (WEHY) model: Model application. J. Hydrol. Eng. 2004, 9, 480–490. [Google Scholar] [CrossRef]
- Chen, Z.Q.; Kavvas, M.L.; Yoon, J.Y.; Dogrul, E.C.; Fukami, K.; Yoshitani, J.; Matsuura, T. Geomorphologic and soil hydraulic parameters for Watershed Environmental Hydrology (WEHY) model. J. Hydrol. Eng. 2004, 9, 465–479. [Google Scholar] [CrossRef]
- Grotch, S.L.; Maccracken, M.C. The Use of General-Circulation Models to Predict Regional Climatic-Change. J. Clim. 1991, 4, 286–303. [Google Scholar] [CrossRef]
- Christensen, J.H.; Christensen, O.B. Climate modelling: Severe summertime flooding in Europe. Nature 2003, 421, 805–806. [Google Scholar] [CrossRef] [PubMed]
- Fowler, H.J.; Blenkinsop, S.; Tebaldi, C. Linking climate change modelling to impacts studies: Recent advances in downscaling techniques for hydrological modelling. Int. J. Climatol. 2007, 27, 1547–1578. [Google Scholar] [CrossRef]
- Maraun, D.; Wetterhall, F.; Ireson, A.M.; Chandler, R.E.; Kendon, E.J.; Widmann, M.; Brienen, S.; Rust, H.W.; Sauter, T.; Themessl, M.; et al. Precipitation Downscaling under Climate Change: Recent Developments to Bridge the Gap between Dynamical Models and the End User. Rev. Geophys. 2010, 48. [Google Scholar] [CrossRef]
- Flato, G.; Marotzke, J.; Abiodun, B.; Braconnot, P.; Chou, S.C.; Collins, W.; Cox, P.; Driouech, F.; Emori, S.; Eyring, V.; et al. Evaluation of Climate Models. In Climate Change 2013: The Physical Science Basis. Contribution of Working Group I to the Fifth Assessment Report of the Intergovernmental Panel on Climate Change; Stocker, T.F., Qin, D., Plattner, G.K., Tignor, M., Allen, S.K., Boschung, J., Nauels, A., Xia, Y., Bex, V., Midgley, P.M., Eds.; Cambridge University Press: Cambridge, UK; New York, NY, USA, 2013. [Google Scholar]
- Kure, S.; Jang, S.; Ohara, N.; Kavvas, M.L.; Chen, Z.Q. WEHY-HCM for Modeling Interactive Atmospheric-Hydrologic Processes at Watershed Scale. II: Model Application to Ungauged and Sparsely Gauged Watersheds. J. Hydrol. Eng. 2013, 18, 1272–1281. [Google Scholar] [CrossRef]
- Ishida, K.; Jang, S.; Kavvas, M.L. Comparison of Performance on Watershed-Scale Precipitation between WRF and MM5. In Proceedings of the World Environmental and Water Resources Congress, 17–21 May 2015. [Google Scholar]
- Roeckner, E.; Brokopf, R.; Esch, M.; Giorgetta, M.; Hagemann, S.; Kornblueh, L.; Manzini, E.; Schlese, U.; Schulzweida, U. Sensitivity of simulated climate to horizontal and vertical resolution in the ECHAM5 atmosphere model. J. Clim. 2006, 19, 3771–3791. [Google Scholar] [CrossRef]
- Yukimoto, S.; Noda, A.; Kitoh, A.; Sugi, M.; Kitamura, Y.; Hosaka, M.; Shibata, K.; Maeda, S.; Uchiyama, T. The New Meteorological Research Institute Coupled GCM (MRI-CGCM2). Pap. Meteorol. Geophys. 2001, 51, 47–88. [Google Scholar] [CrossRef]
- Collins, W.D.; Bitz, C.M.; Blackmon, M.L.; Bonan, G.B.; Bretherton, C.S.; Carton, J.A.; Chang, P.; Doney, S.C.; Hack, J.J.; Henderson, T.B.; et al. The Community Climate System Model version 3 (CCSM3). J. Clim. 2006, 19, 2122–2143. [Google Scholar] [CrossRef]
- IPCC. Climate Change 2007: The Physical Science Basis. Contribution of Working Group I to the Fourth Assessment Report of the Intergovernmental Panel on Climate Change; Solomon, S., Qin, D., Manning, M., Chen, Z., Marquis, M., Averyt, K.B., Tignor, M., Miller, H.L., Eds.; Cambridge University Press: Cambridge, UK; New York, NY, USA, 2007; p. 996. [Google Scholar]
- Jang, S.; Kavvas, M.L.; Ishida, K.; Trinh, T.; Ohara, N.; Kure, S.; Chen, Z.Q.; Anderson, M.L.; Matanga, G.; Carr, K.J. A Performance Evaluation of Dynamical Downscaling of Precipitation over Northern California. Sustainability-Basel 2017, 9, 1457. [Google Scholar] [CrossRef]
- Nakicenovic, N.; Alcamo, J.; Davis, G.; de Vries, B.; Fenhann, J.V.; Gaffin, S.; Gregory, K.; Grübler, A.; Jung, T.Y.; Kram, T.; et al. Special Report on Emissions Scenarios (SRES); Intergovernmental Panel on Climate Change: Cambridge, UK, 2000. [Google Scholar]
- Yoshitani, J.; Chen, Z.Q.; Kavvas, M.L.; Fukami, K. Atmospheric Model-Based Streamflow Forecasting at Small, Mountainous Watersheds by a Distributed Hydrologic Model: Application to a Watershed in Japan. J. Hydrol. Eng. 2009, 14, 1107–1118. [Google Scholar] [CrossRef]
- Moriasi, D.N.; Arnold, J.G.; Van Liew, M.W.; Bingner, R.L.; Harmel, R.D.; Veith, T.L. Model evaluation guidelines for systematic quantification of accuracy in watershed simulations. Trans. Asabe 2007, 50, 885–900. [Google Scholar] [CrossRef]
- American Meteorological Society. Glossary of Meteorology. 1959. Available online: https://www.ametsoc.org/ams/index.cfm/publications/glossary-of-meteorology (accessed on 1 July 2019).
- Schreiner, L.C.; Riedel, J.T. Probable Maximum Precipitation Estimates, United States East of the 105th Meridian; U.S. Department of Commerce: Washington, DC, USA, 1978.
- Tang, K.H.D. Climate change in Malaysia: Trends, contributors, impacts, mitigation and adaptations. Sci. Total Environ. 2019, 650, 1858–1871. [Google Scholar] [CrossRef] [PubMed]
- Fischer, E.M.; Beyerle, U.; Knutti, R. Robust spatially aggregated projections of climate extremes. Nat. Clim. Chang. 2013, 3, 1033–1038. [Google Scholar] [CrossRef]
- Meehl, G.A.; Stocker, T.F.; Collins, W.D.; Friedlingstein, P.; Gaye, A.T.; Gregory, J.M.; Kitoh, A.; Knutti, R.; Murphy, J.M.; Noda, A.; et al. Global Climate Projections. In Climate Change 2007: The Physical Science Basis. Contribution of Working Group I to the Fourth Assessment Report of the Intergovernmental Panel on Climate Change; Solomon, S., Qin, D., Manning, M., Chen, Z., Marquis, M., Averyt, K.B., Tignor, M., Miller, H.L., Eds.; Cambridge University Press: Cambridge, UK; New York, NY, USA, 2007. [Google Scholar]
- Rao, A.R.; Azli, M.; Pae, L.J. Identification of trends in Malaysian monthly runoff under the scaling hypothesis. Hydrol. Sci. J. 2011, 56, 917–929. [Google Scholar] [Green Version]
- Kabiri, R.; Bai, V.R.; Chan, A. Assessment of hydrologic impacts of climate change on the runoff trend in Klang Watershed, Malaysia. Environ. Earth Sci. 2015, 73, 27–37. [Google Scholar] [CrossRef]
- Cosgrove, W.J.; Loucks, D.P. Water management: Current and future challenges and research directions. Water Resour. Res. 2015, 51, 4823–4839. [Google Scholar] [CrossRef] [Green Version]
Figure 1.
(a) 10 target watersheds and the remaining 12 coastal regions in Peninsular Malaysia (b) The modeling domains of Peninsular Malaysia hydroclimate model: The large outer domain shown by green box is covered by 54 km × 54 km grids; the intermediate domain shown by orange box is covered by 18 km × 18 km grids; and the inner modeling domain shown by red box is covered by 6 km × 6 km grids.

Figure 2.
Schematic description of the modeling approach.

Figure 3.
MM5-Simulated 10-year average annual precipitation during (a) 1970–1980, (b) 1980–1990, and (c) 1990–2000 by dynamically downscaling the control run data from CCSM3, ECHAM5 and MRI-CGCM2.3.2 global climate models, compared against observations.
Figure 3.
MM5-Simulated 10-year average annual precipitation during (a) 1970–1980, (b) 1980–1990, and (c) 1990–2000 by dynamically downscaling the control run data from CCSM3, ECHAM5 and MRI-CGCM2.3.2 global climate models, compared against observations.

Figure 4.
Calibration and validation results in hourly time series of the observed and model simulated stream discharges in m3/s (cubic meters per second, cms) at Jambatan Guillemard station in Kelantan watershed for the (a) calibration, and (b) validation periods. Basin average precipitation is given as the secondary Y-axis.


Figure 5.
Basin-average annual precipitation, air temperature, and soil water storage during the historical period (1970–2000) and during each of the projected future (2010–2100) conditions in Kelantan Watershed.
Figure 5.
Basin-average annual precipitation, air temperature, and soil water storage during the historical period (1970–2000) and during each of the projected future (2010–2100) conditions in Kelantan Watershed.

Figure 6.
30-year mean of the basin-average annual precipitation in Peninsular Malaysia during the historical period, and through the 21st century. The percent changes are provided from the historical 1970–2000 period. (a) 10 watersheds; (b) 12 Coastal Regions (CRs).
Figure 6.
30-year mean of the basin-average annual precipitation in Peninsular Malaysia during the historical period, and through the 21st century. The percent changes are provided from the historical 1970–2000 period. (a) 10 watersheds; (b) 12 Coastal Regions (CRs).


Figure 7.
Normalized values of 24-h and 72-h accumulated precipitation for 100-year return period during the early, middle, and end of 21st century for the (a) 10 watersheds and (b) 12 coastal regions (CRs) of Peninsular Malaysia. Precipitation values are normalized with the 24 h accumulated precipitation value in the early 21st century. (a) 10 watersheds; (b) 12 Coastal Regions (CRs).

Figure 8.
Basin-average annual mean air temperatures in water years 2010, 2040, 2070, and 2100, and the change in annual mean air temperature from water year 2010 to water years 2040, 2070, and 2100 in Peninsular Malaysia. (a) 10 watersheds; (b) 12 Coastal Regions (CRs).
Figure 8.
Basin-average annual mean air temperatures in water years 2010, 2040, 2070, and 2100, and the change in annual mean air temperature from water year 2010 to water years 2040, 2070, and 2100 in Peninsular Malaysia. (a) 10 watersheds; (b) 12 Coastal Regions (CRs).

Figure 9.
Normalized values of 30-year mean of the basin-average annual mean soil water storage during the historical period (1970−2000) and through the 21st century for the a) 10 watersheds, and b) 12 coastal regions in Peninsular Malaysia. 30-year mean of the basin-average annual mean soil water storage values are normalized by the values of the 1970−2000 period. (a) 10 watersheds; (b) 12 Coastal Regions (CRs).

Figure 10.
(a) The 30-year average annual mean flow during the historical period, and through the 21st century; (b) the change in the 30-year average of the annual mean flow from the historical period to the early, middle, and end of the 21st century for each of the 10 watersheds of Peninsular Malaysia.

Figure 11.
Percent change in values of the mean monthly river flows during the 2010–2100 period from those during the 1970–2000 period. The percent changes are calculated for average, minimum, and maximum mean monthly flows.
Figure 11.
Percent change in values of the mean monthly river flows during the 2010–2100 period from those during the 1970–2000 period. The percent changes are calculated for average, minimum, and maximum mean monthly flows.


Table 1.
Summary of the Climate Projections Dynamically Downscaled Over Peninsular Malaysia.
| GCM | Time Period | Simulation/Scenario Description |
|---|---|---|
| Historical Conditions | ||
| ECHAM5 | 1970–2000 | 20th century reconstruction (20C3M) |
| MRI-CGCM2.3.2 | 1970–2000 | 20th century reconstruction (20C3M) |
| CCSM3 | 1970–2000 | 20th century reconstruction (20C3M) |
| Future Conditions | ||
| ECHAM5 | 2010–2100 | SRES A1B_1, SRES A1B_2, SRES A1B_3, SRES A2_1, SRES A2_2, SRES A2_3, SRES B1_1, SRES B1_2, SRES B1_3 |
| MRI-CGCM2.3.2 | 2010–2100 | SRES A1B, SRES B1 |
| CCSM3 | 2010–2100 | SRES A1B, SRES A1FI, SRES A2, SRES B1 |
Table 2.
Summary of the streamflow stations that were used for the calibration and validation of the WEHY watershed hydrology model for the 10 watersheds under consideration.
Table 2.
Summary of the streamflow stations that were used for the calibration and validation of the WEHY watershed hydrology model for the 10 watersheds under consideration.
| Watershed | Station ID | Station Name | Latitude | Longitude | Drainage Area (km2) |
|---|---|---|---|---|---|
| Batu Pahat | 2130401 | Lenik River at Ladang Cha’ah | 2.190 | 103.000 | 250 |
| Johor | 1737451 | Johor River at Rantau Panjang | 1.780 | 103.750 | 1138 |
| Muda | 5606410 | Muda River at Jambatan Syed Omar | 5.610 | 100.630 | 3330 |
| Kelang | 3116430 | Kelang River at Jambatan Sulaiman | 3.140 | 101.700 | 489 |
| Kelantan | 5721442 | Kelantan River at Jambatan Guillemard | 5.760 | 102.150 | 11900 |
| Linggi | 2519421 | Linggi River at Sua Betong | 2.508 | 101.964 | 523 |
| Pahang | 3527410 | Pahang River at Lubok Paku | 5.610 | 100.630 | 26449 |
| Perak | 4310401 | Kinta River at Weir G at Tg. Tualang | 1.900 | 103.690 | 1781 |
| Selangor | 3414421 | Selangor River at Rantau Panjang | 3.400 | 101.440 | 1448 |
| Dungun | 4832441 | Dungun River at Jambatan Jerangau | 4.840 | 103.200 | 1480 |
© 2019 by the authors. Licensee MDPI, Basel, Switzerland. This article is an open access article distributed under the terms and conditions of the Creative Commons Attribution (CC BY) license (http://creativecommons.org/licenses/by/4.0/).
Share and Cite
MDPI and ACS Style
Amin, I.M.Z.b.M.; Ercan, A.; Ishida, K.; Kavvas, M.L.; Chen, Z.Q.; Jang, S.-H. Impacts of Climate Change on the Hydro-Climate of Peninsular Malaysia. Water 2019, 11, 1798. https://doi.org/10.3390/w11091798
AMA Style
Amin IMZbM, Ercan A, Ishida K, Kavvas ML, Chen ZQ, Jang S-H. Impacts of Climate Change on the Hydro-Climate of Peninsular Malaysia. Water. 2019; 11(9):1798. https://doi.org/10.3390/w11091798
Chicago/Turabian StyleAmin, Ir. Mohd Zaki bin Mat, Ali Ercan, Kei Ishida, M. Levent Kavvas, Z.Q. Chen, and Su-Hyung Jang. 2019. "Impacts of Climate Change on the Hydro-Climate of Peninsular Malaysia" Water 11, no. 9: 1798. https://doi.org/10.3390/w11091798
Note that from the first issue of 2016, this journal uses article numbers instead of page numbers. See further details here.