Factors Controlling the Spatial and Temporal Variability in Groundwater 222Rn and U Levels

1
Groundwater Research Center, Geologic Environment Division, Korea Institute of Geoscience and Mineral Resources, Daejeon 34142, Korea
2
Department of Geoenvironmental Sciences, Kongju National University, Kongju 32588, Korea
3
Division of Earth and Environmental Sciences, Korea Basic Science Institute, Chungbuk 24341, Korea
*
Author to whom correspondence should be addressed.
Water 2019, 11(9), 1796; https://doi.org/10.3390/w11091796
Submission received: 26 July 2019
/
Revised: 26 August 2019
/
Accepted: 28 August 2019
/
Published: 29 August 2019
(This article belongs to the Section Water Quality and Contamination)
Abstract
:Radon (222Rn) and uranium (U) measurements were conducted in 98 groundwater samples in Yongin area, Korea to identify the factors controlling their levels and spatial distributions. Groundwater samples were obtained from the different depth of wells used for drinking water and irrigation. 222Rn and U concentrations were measured using a liquid scintillation counter (LSC) equipped with a pulse-shape analyzer and inductively coupled plasma mass spectrometers (ICP-MS), respectively. Large variations were observed in groundwater concentrations of 222Rn and U, ranging between 0.6 ± 0.1–673.7 ± 8.7 Bq L−1 and 0.02–117.00 µg L−1, respectively. Correlation analysis revealed no significant relationship between field parameters (temperature, electrical conductivity, pH, and dissolved oxygen) and 222Rn or U concentrations. The fact that 222Rn and U concentrations were higher in granite areas than gneiss areas suggests that lithology plays a significant role in controlling the levels and spatial distributions of the two radionuclides. Furthermore, groundwater 222Rn and U behaviors have been affected by the existence of fault and well depth. Especially, the temporal monitoring of 222Rn suggests that 222Rn concentrations in the shallow groundwater may be controlled by variation in rainfall and artificial effects such as water curtain cultivation conducted in the winter season in this study area.
1. Introduction
Groundwater has been a globally essential resource for drinking, industrial, and agricultural purposes throughout history. For example, over 95% of the rural population depends on groundwater for their drinking water in the USA [1]. In Korea, groundwater provides 13% (approximately 3.7 billion m3) of the total annual water supply, and the use of groundwater is increasing continuously [2]. Human consumption of groundwater, however, may be restricted due to quality concerns. Naturally occurring radionuclides in groundwater, such as radon (222Rn) and uranium (U), have become major health issues with previous studies reporting high radionuclide levels [3,4,5].
222Rn is a naturally occurring radionuclide with a half-life of 3.8 days. Due to its suitable half-life and high concentration in groundwater, 222Rn has been used as an excellent tracer for quantifying groundwater discharge and determining groundwater-surface water interaction in aquatic systems such as streams, rivers, wetlands, and estuaries [6,7,8,9,10]. Furthermore, 222Rn in groundwater has been monitored worldwide to predict earthquakes and understand natural processes [11,12,13]. U, a redox sensitive element, has been used to examine the portion of submarine groundwater discharge in coastal zones because its concentration and isotopic ratio (234U/238U) presented different endmembers in seawater and coastal groundwater [14,15]. Although there are various applications of 222Rn and U in the scientific researches, the excess dissolved radionuclides (222Rn and U) in groundwater used for drinking water can impact the human health. Inhaling or ingesting 222Rn is known to cause lung and stomach cancer [16,17]. U can cause kidney problems, and its inhalation presents a chemical toxicity risk to the lungs [18,19].
Previous studies have reported on the spatial distributions and levels of 222Rn and U in groundwater and drinking water in other countries. For example, 222Rn and U concentrations were measured in 5097 wells located in more than 40 principals in USA, showing that 2.7% of the groundwater samples contained 222Rn concentrations which were higher than the alternative maximum contaminant level (AMCL) of 148 Bq L−1 recommended by US EPA (Environmental Protection Agency) [20]. In India, 222Rn and 238U groundwater concentrations from 41 different locations were reported to range from 0.86 to 7.62 Bq L−1 and from 0.26 to 29 µg L−1, respectively, indicating that high levels of these radionuclides were associated with lithology [3]. In Korea, recently, 222Rn concentrations in 3818 groundwater samples were measured and 26.5% of the total samples exceeded the World Health Organization (WHO) radon level limit of 100 Bq L−1 [21]. It is reported that approximately 4% of 4140 wells in South Korea contained U concentrations exceeding the WHO guideline level for drinking water, 30 µg L−1 [22], suggesting that these groundwater wells should be closed immediately to reduce health hazards [23].
With this background, the need to determine 222Rn and U distributions and concentrations in groundwater is significant, especially in regions where residents use groundwater containing high 222Rn and U levels for drinking. Therefore, this study was conducted in Yongin area where high 222Rn concentrations have already been reported [24] and groundwater has been used for drinking water and irrigation. This study aimed (1) to investigate the levels and spatial distributions of 222Rn and U in groundwater and (2) to determine the factors controlling these radionuclides’ behaviors in Yongin area, Korea.
2. Materials and Methods
2.1. Site Description
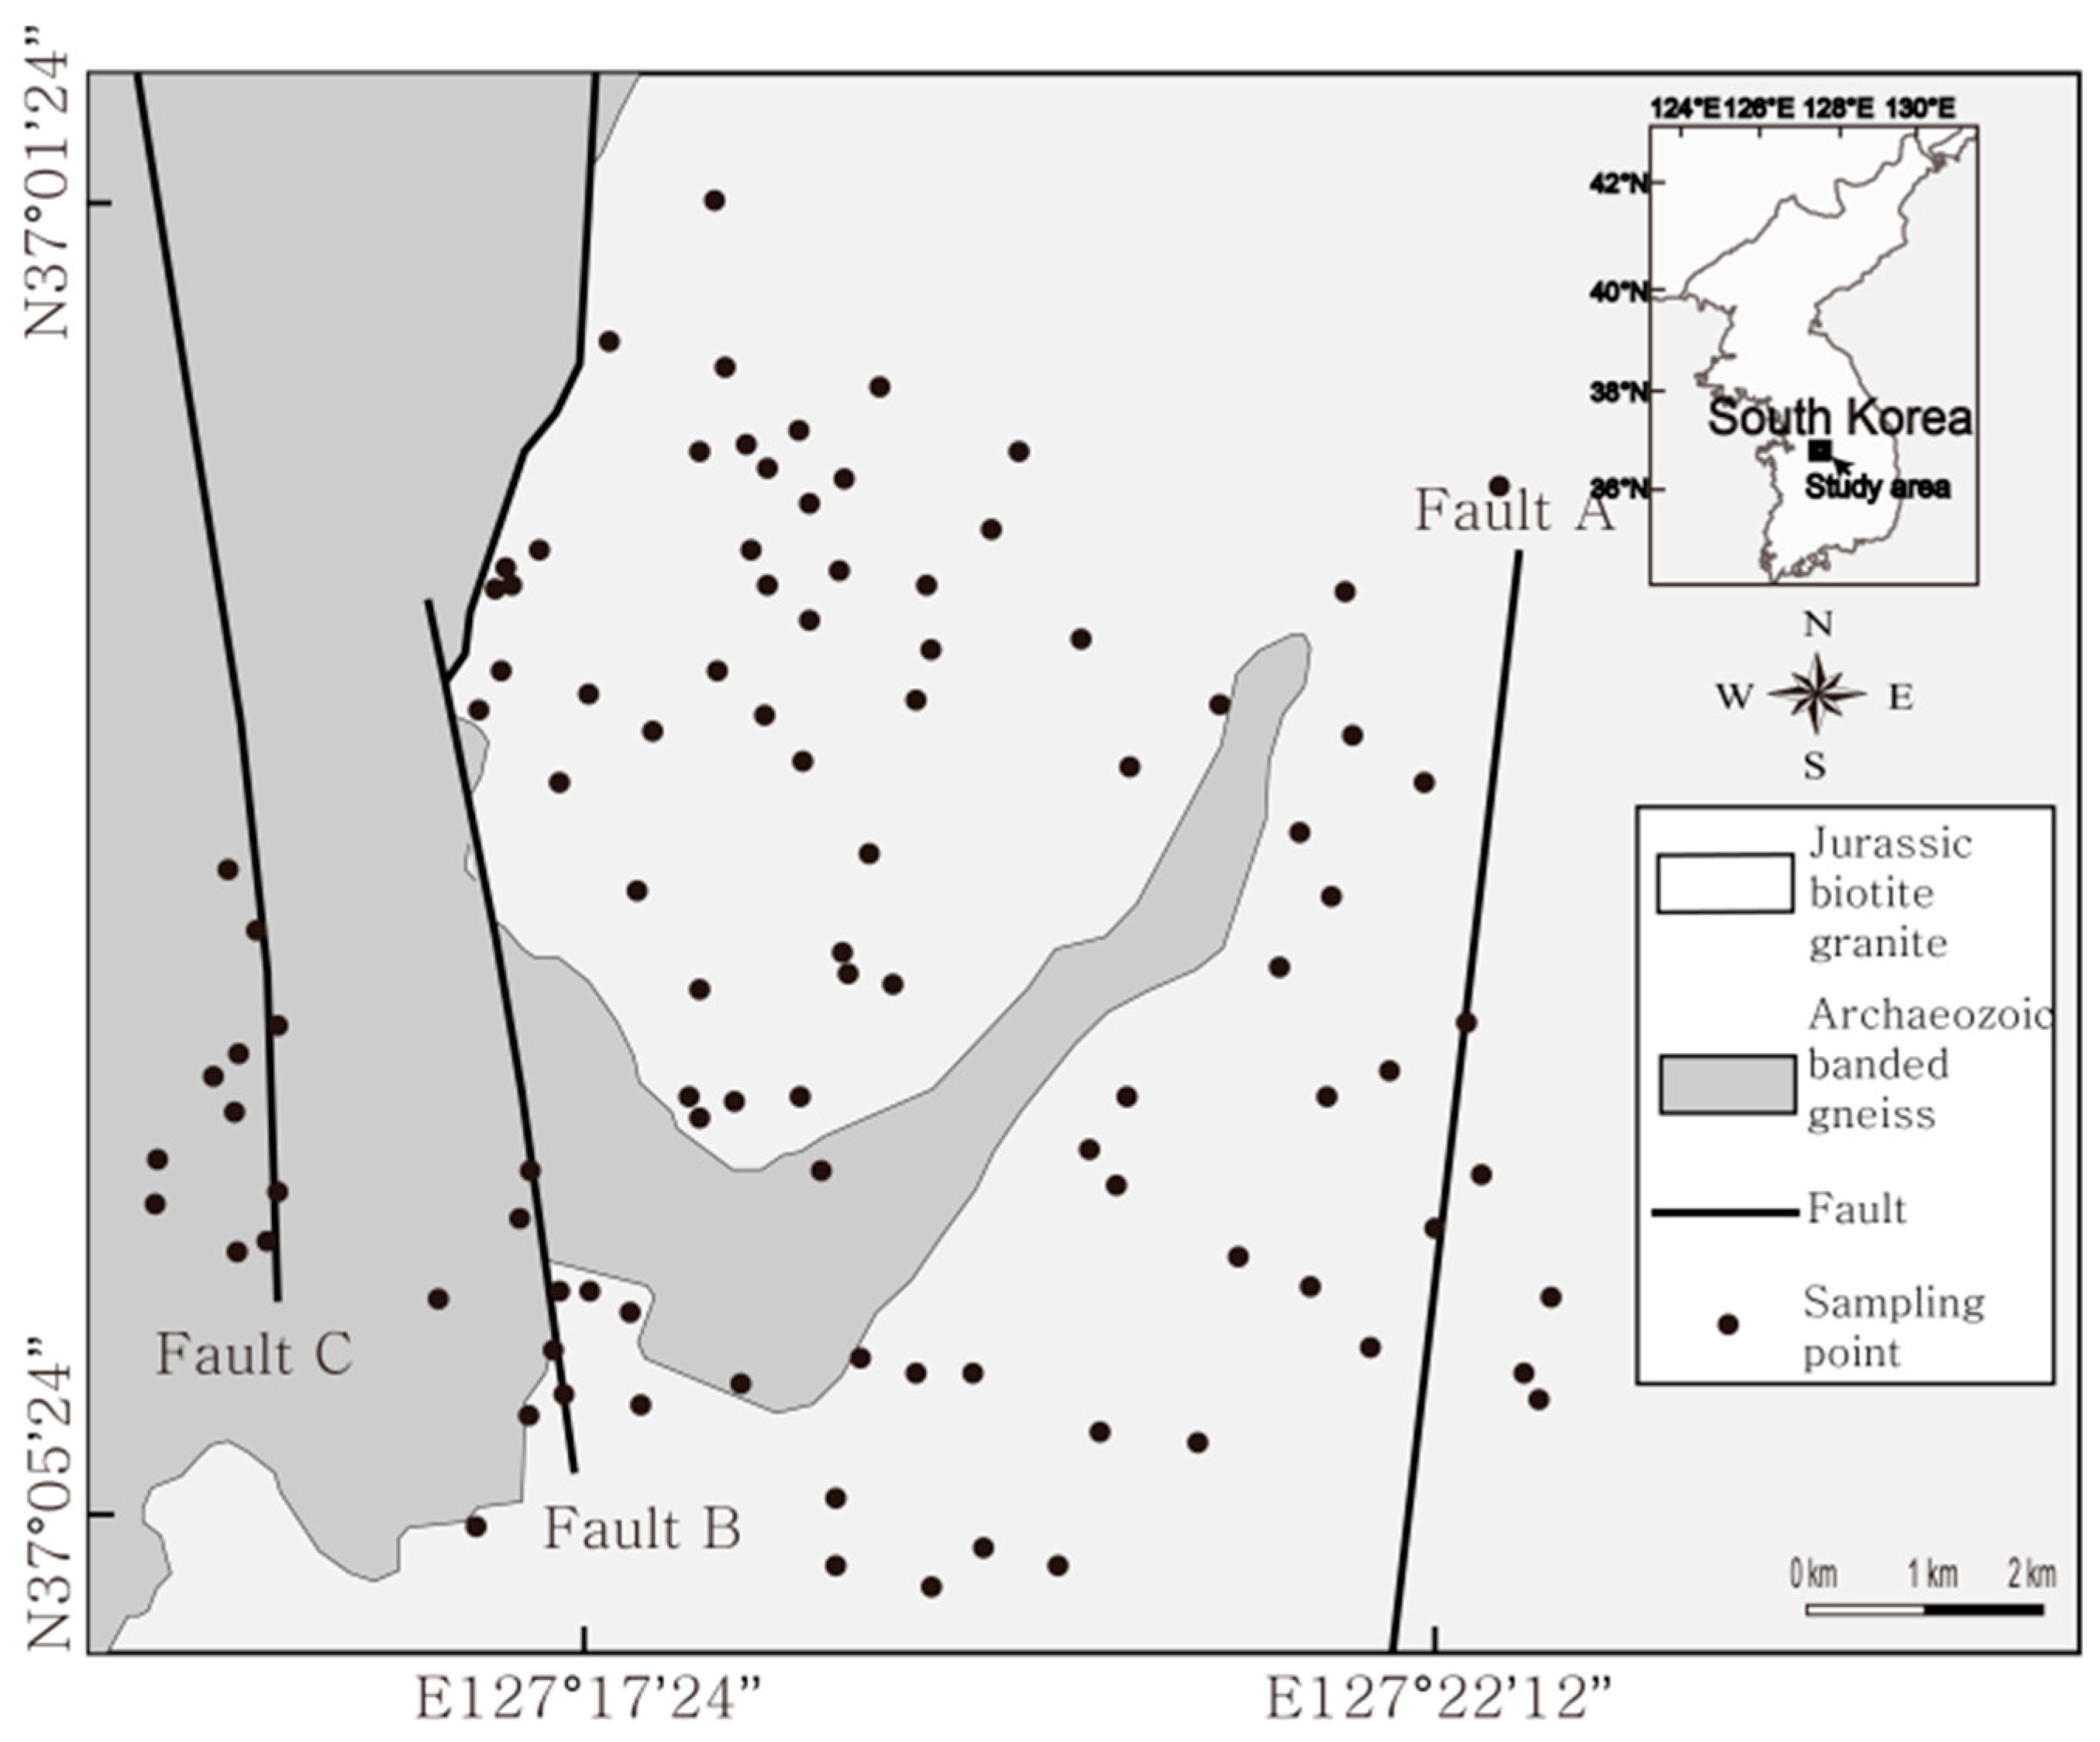
Groundwater samples were collected from wells in Yongin area (185 km2) located in the northwest part of South Korea (Figure 1). The mean annual precipitation and temperature of this region are 1560 mm and 11 °C, respectively, with high precipitation concentrated in the summer monsoon season (June and July). The basement rock primarily consists of Jurassic gneissose biotite granite (over 70% of the study area) and Precambrian banded gneiss [24,25]. Jurassic gneissose biotite granite is composed of biotite and hornblende, and Precambrian banded gneiss is composed of quartz, plagioclase, and biotite [25].
2.2. Groundwater Sampling
Groundwater samples were collected from 98 groundwater wells located in Yongin area in 2013. Samples were taken after the wells were purged by pumping for more than 15 min using a submersible pump to remove well bore storage. Field parameters including temperature, electrical conductivity (EC), pH, and dissolved oxygen (DO) in groundwater were measured in situ using portable meters (Orion 5 Star). Well depths varied from 25 to 200 m.
2.3. 222Rn and U Measurements
Groundwater samples were collected promptly to avoid radon gas loss. A total of 8 mL of each sample were injected and mixed with 12 mL of a commercial liquid scintillator cocktail solution (Optiphase Hisafe3, PerkinElmer). 222Rn concentration was measured after 4 h elapsed for radioactive equilibrium between 222Rn and its daughters. The 222Rn concentration was measured using a liquid scintillation counter (LSC, Perkin Elmer, Wallac 1220 Quantulus) equipped with a pulse-shape analyzer which can electronically separate alpha and beta nuclides into different spectra. This ultra-low-level LSC is able to effectively measure very low-level alpha and beta nuclides, making it possible to optimize measurement conditions for various environmental radioactivity applications. The optimal pulse shape analysis (PSA) level was set to 100, determined using 241Am and 90Sr/90Y standard radioactive solutions to minimize alpha/beta discrimination capabilities [26].
The detection efficiency for 222Rn was determined based on the total peak area of the alpha line at 100 PSA level using the 226Ra standard solution. Detection efficiency was determined in triplicate using three standard samples, demonstrating a mean value of 89% with standard deviation of 0.6%. Background values were measured in the 550–750 channel range, excluding the 214Po peak region because 214Po was immediately formed due to its short half-life.
Previously boiled ultra-pure water was mixed with a scintillation cocktail solution cleaned by argon gas to produce a background sample containing no radon. The background sample was measured for 5 h under the same protocol as actual samples. This background counting value was used to determine both the counting efficiency and detection limit. Based on Equation (1) [27], the minimum detectable activity (MDA, Bq L−1) was calculated to be 0.22 Bq L−1 for the α-ray total peak.
where Cb (cpm) is the background count rate. V (L) and t (min) represent the sample volume (8 mL) and the background counting time, respectively. The 222Rn concentration of the sample was determined using the following equation [28]:
where C (Bq L−1) is the 222Rn concentration of the sample. RS (cpm) and RB (cpm) represent the sample count rate and the background count rate, respectively. E is the counting efficiency. λ (day−1) is the 222Rn decay constant and t (day) is the elapsed time from sampling to the midpoint of the decay correction count.
Groundwater sample for the total U analysis was immediately filtered through 0.45 µm cellulose membrane, and then acidified to ~pH 2 with nitric acid and stored in the vails which were pre-cleaned with nitric acid and de-ionized water. The concentration of U was measured using inductively coupled plasma mass spectrometry (ICP-MS; DRC-II; PerkinElmer). Calibrations were performed using U standard solution (10 µg mL−1, Accustandard). The statistical and spatial analyses were performed using SPSS (SPSS Inc., v. 17, IBM, Armonk, NY, USA) and Grapher (Golden Software Inc., v. 13, Golden, CO, USA) respectively.
3. Results and Discussion
Well depth information, field parameters (temperature, EC, pH, and DO), and 222Rn and U groundwater concentrations are shown in Table A1. We scrutinized the variables used in this study to examine unusual values. Groundwater was sampled from the wells of various depths, showing a temperature range of 11.9‒18.5 °C (mean ± standard deviation; 15.2 ± 1.3 °C). The EC, pH, and DO ranged from 68 to 712 μS cm−1 (192 ± 108 μS cm−1), from 5.1 to 8.9 (6.3 ± 0.6), and from 0.6 to 10.6 mg L−1 (5.1 ± 2.1 mg L−1), respectively. The 222Rn concentration in groundwater fell between 0.6 ± 0.1 and 673.7 ± 8.7 Bq L−1 with a mean value of 208 ± 166 Bq L−1. The U concentration in groundwater ranged from 0.02 to 117.00 µg L−1 with a mean value of 11.5 ± 21.1 µg L−1. The highest concentrations of 222Rn and U were observed at YI21 and YI32, respectively.
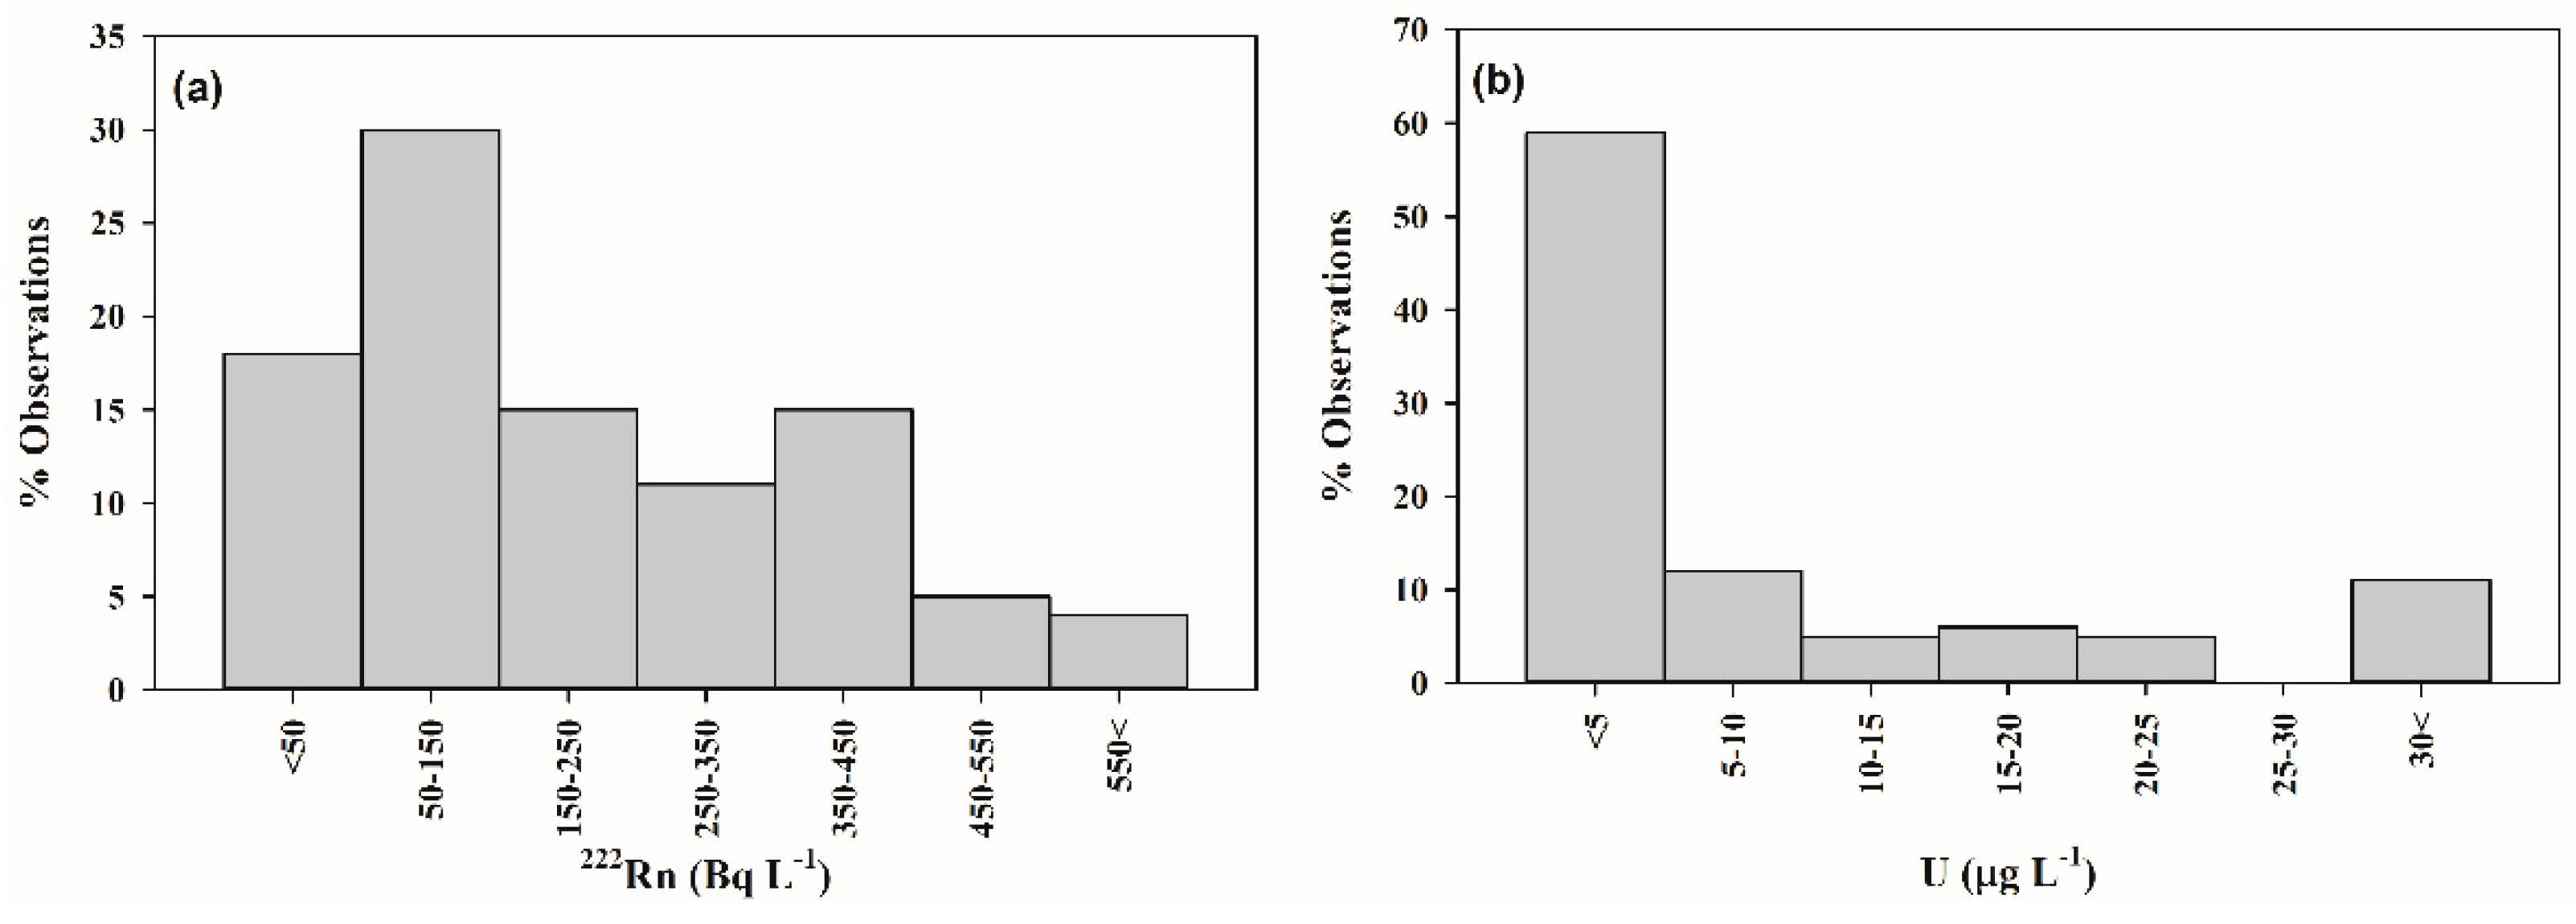
Histograms showing the frequency distributions of 222Rn and U concentrations indicated that the concentrations of these radionuclides were skewed to the left (Figure 2). Approximately 50% of the sampling points showed 222Rn concentrations below 148 Bq L−1, and the distribution of U concentration showed approximately 10% of the sampling points were above 30 µg L−1.
3.1. Correlations between 222Rn or U and Field Parameters
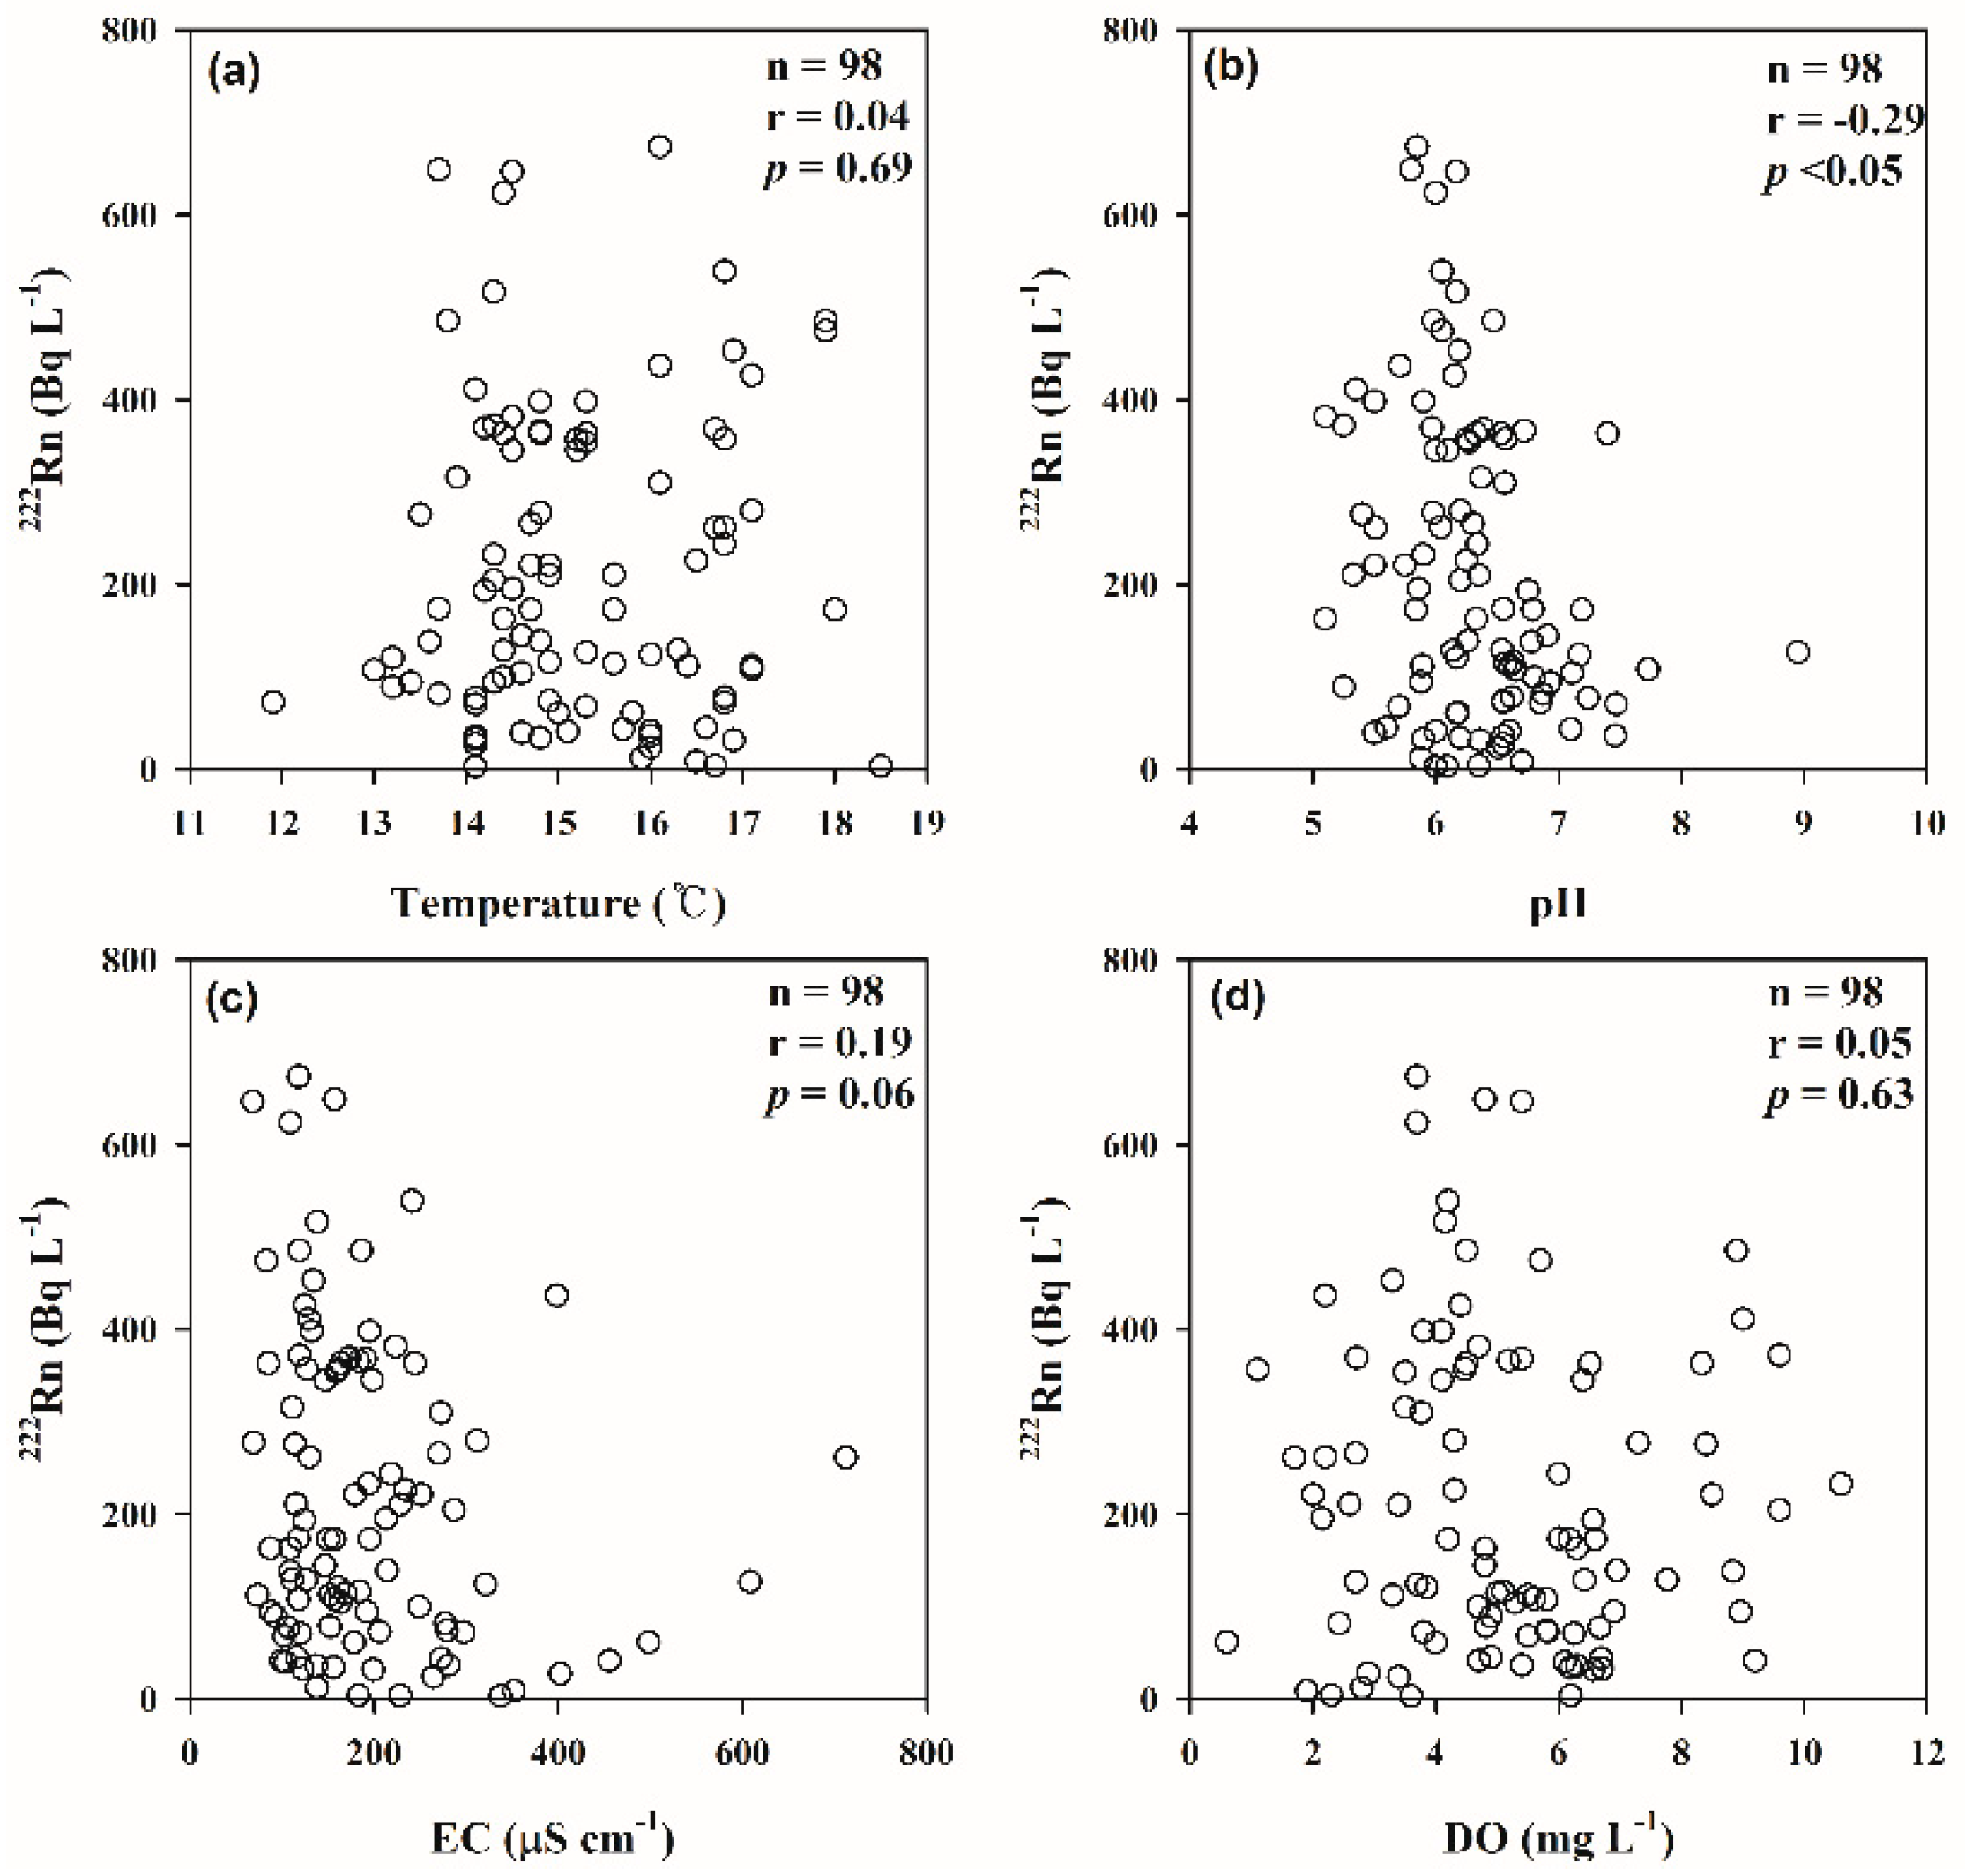
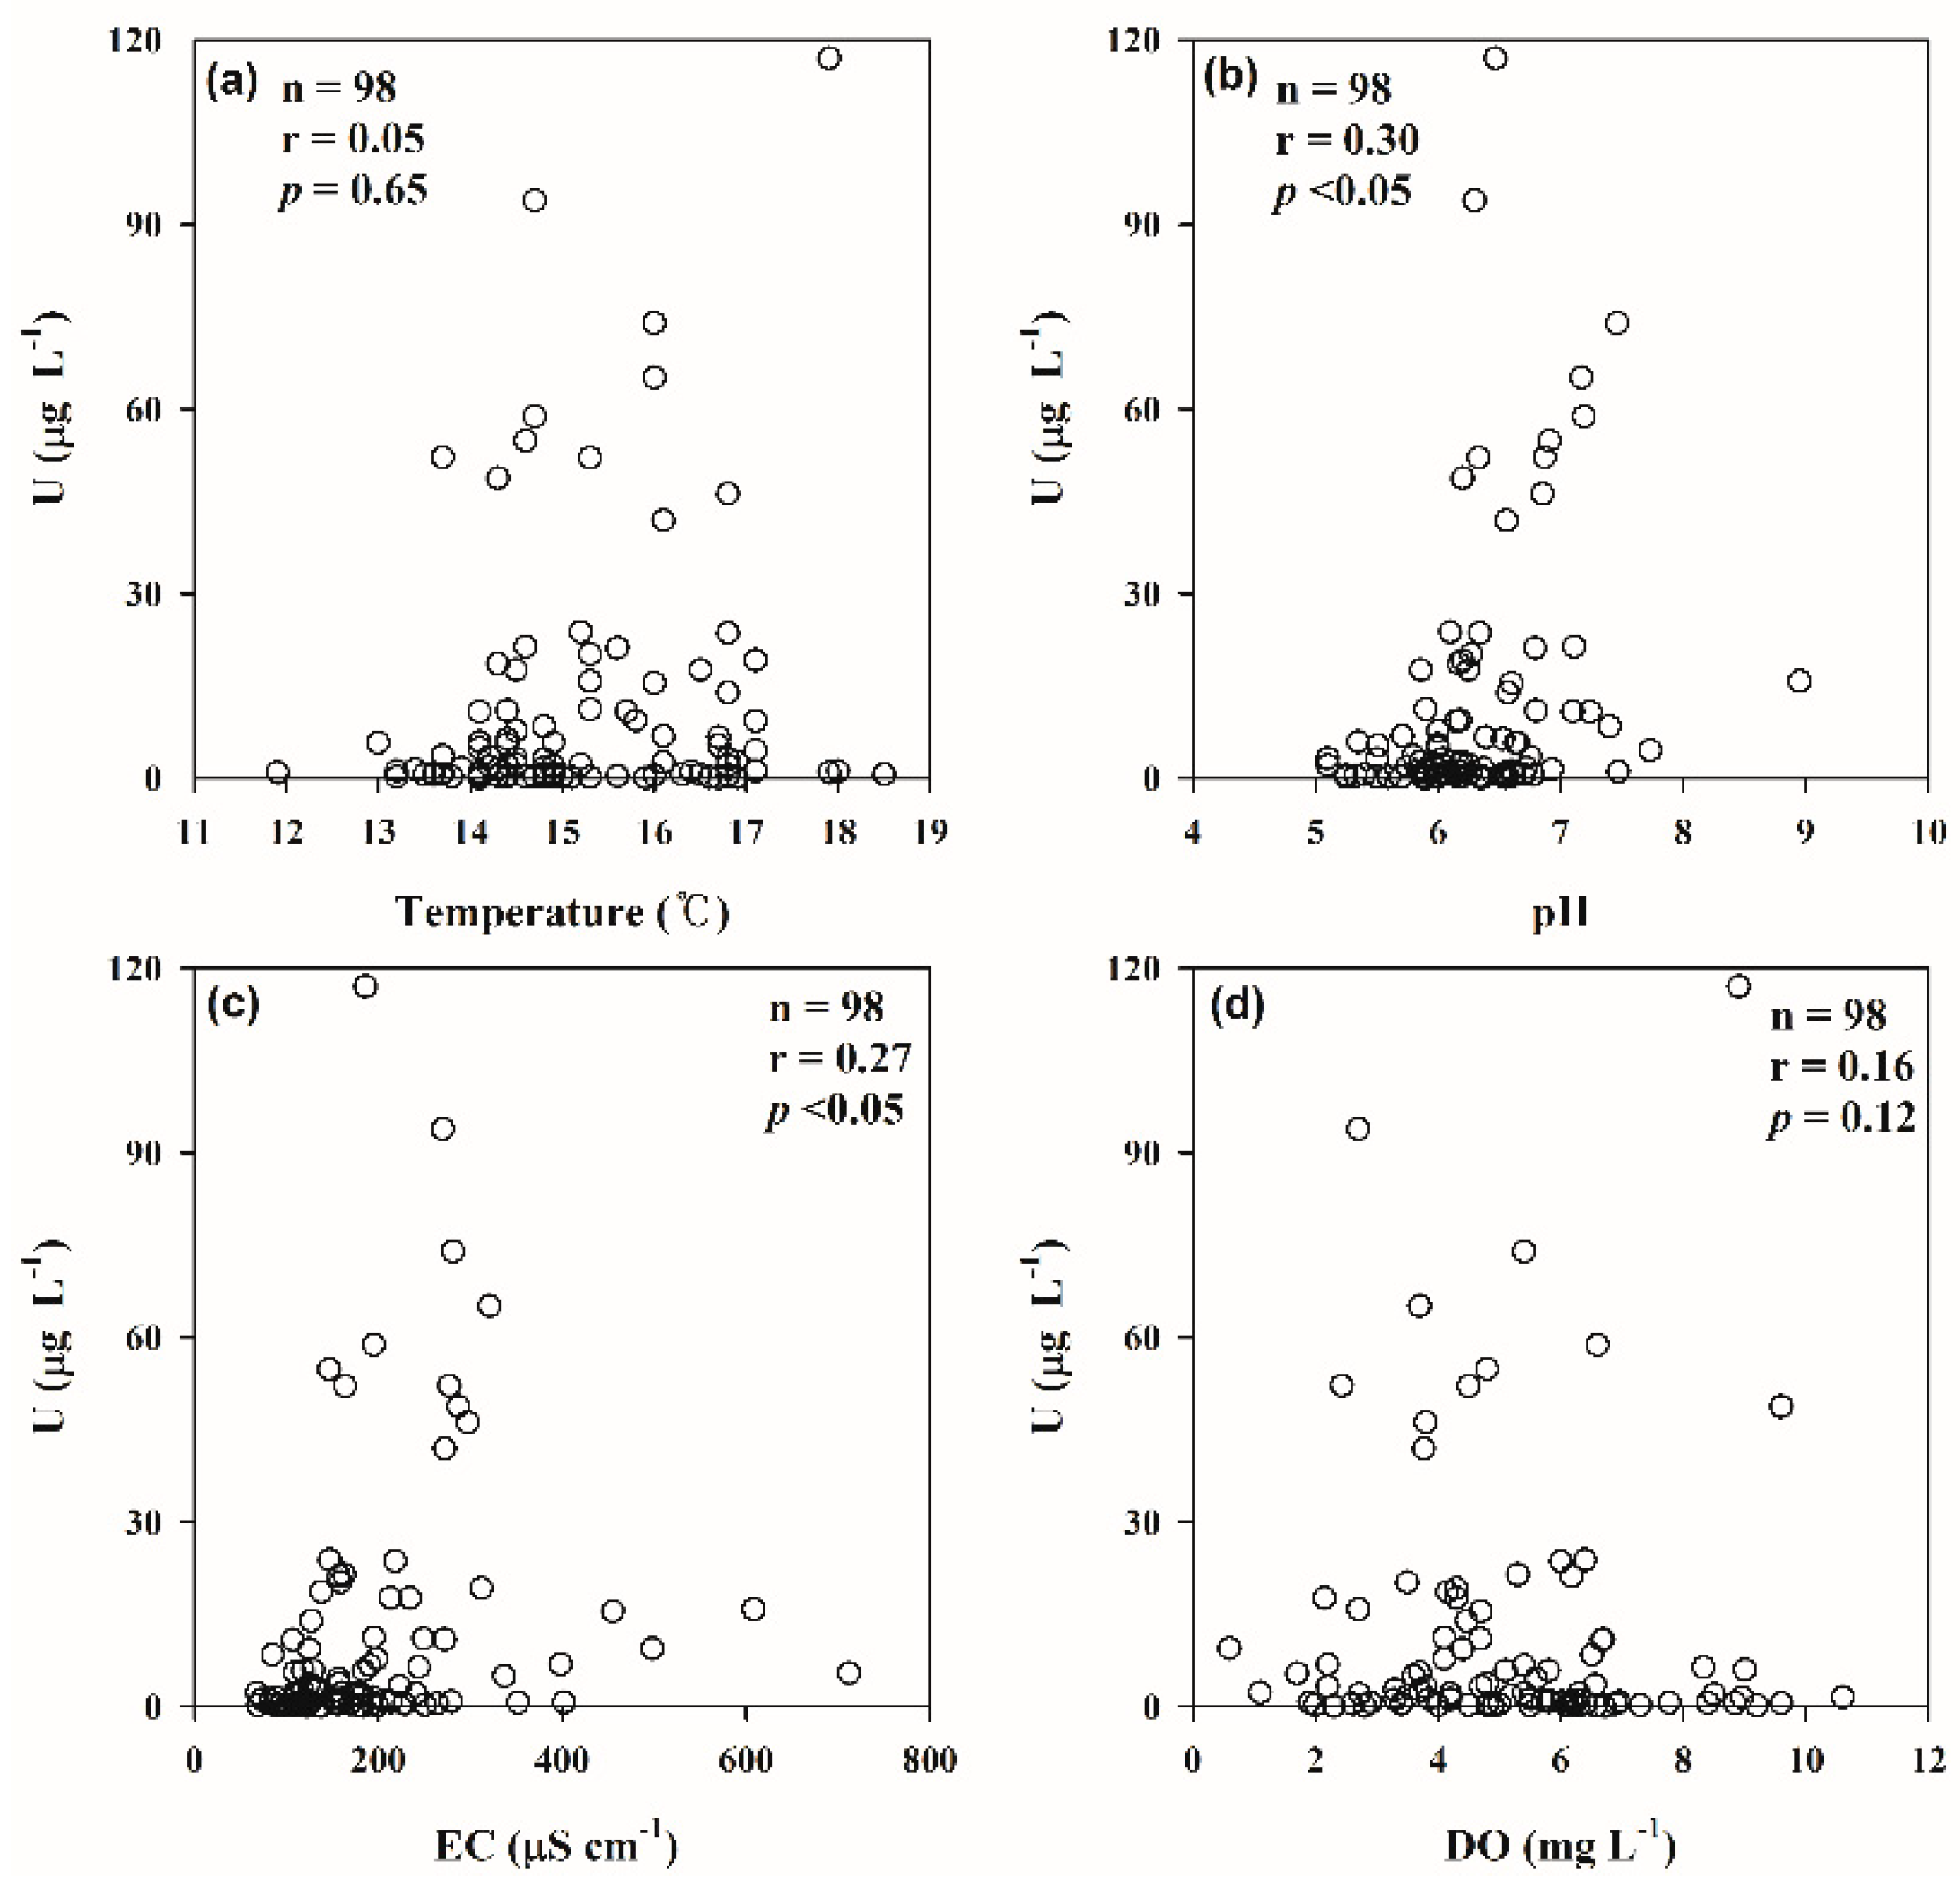
The 222Rn concentrations showed no significant correlation with temperature (r = 0.04, p = 0.69), EC (r = 0.19, p = 0.06), or DO (r = 0.05, p = 0.63) and only weak correlations with pH (r = −0.29, p < 0.05) (Figure 3). The U concentrations also showed no significant correlation with temperature (r = 0.05, p = 0.65) or DO (r = 0.16, p = 0.12), and weak correlations with pH (r = 0.30, p < 0.05) and EC (r = 0.27, p < 0.05) (Figure 4). Even though the 222Rn and U concentrations appeared to correspond with pH based on the statistical analysis, those data were highly scattered, and the correlation coefficients were extremely weak. Similar to the current results, prior research has reported neither significant nor weak correlation between pH and 222Rn concentrations in groundwater [4,29]. These results therefore suggest that these individual field parameters may not play primary roles in regulating 222Rn and U groundwater levels.
3.2. Effect of Lithology and Fault
For statistical analysis, the 222Rn and U concentrations in groundwater were grouped based on the geological characteristics (granite or gneiss areas) of the sampling locations. The mean 222Rn groundwater concentration in granite areas was 238 ± 161 Bq L−1, approximately four times higher than that of gneiss areas (66 ± 104 Bq L−1), and the mean U groundwater concentration in granite areas (14 ± 23 µg L−1) was seven times higher than that in gneiss areas (2 ± 5 µg L−1). These results are similar to the previous studies conducted in various bedrock-type areas [2,30], reflecting the fact that granite contains high levels of radionuclides such as 226Ra (parent of 222Rn) and 238U [31].
3.3. Spatial Distributions of 222Rn and U
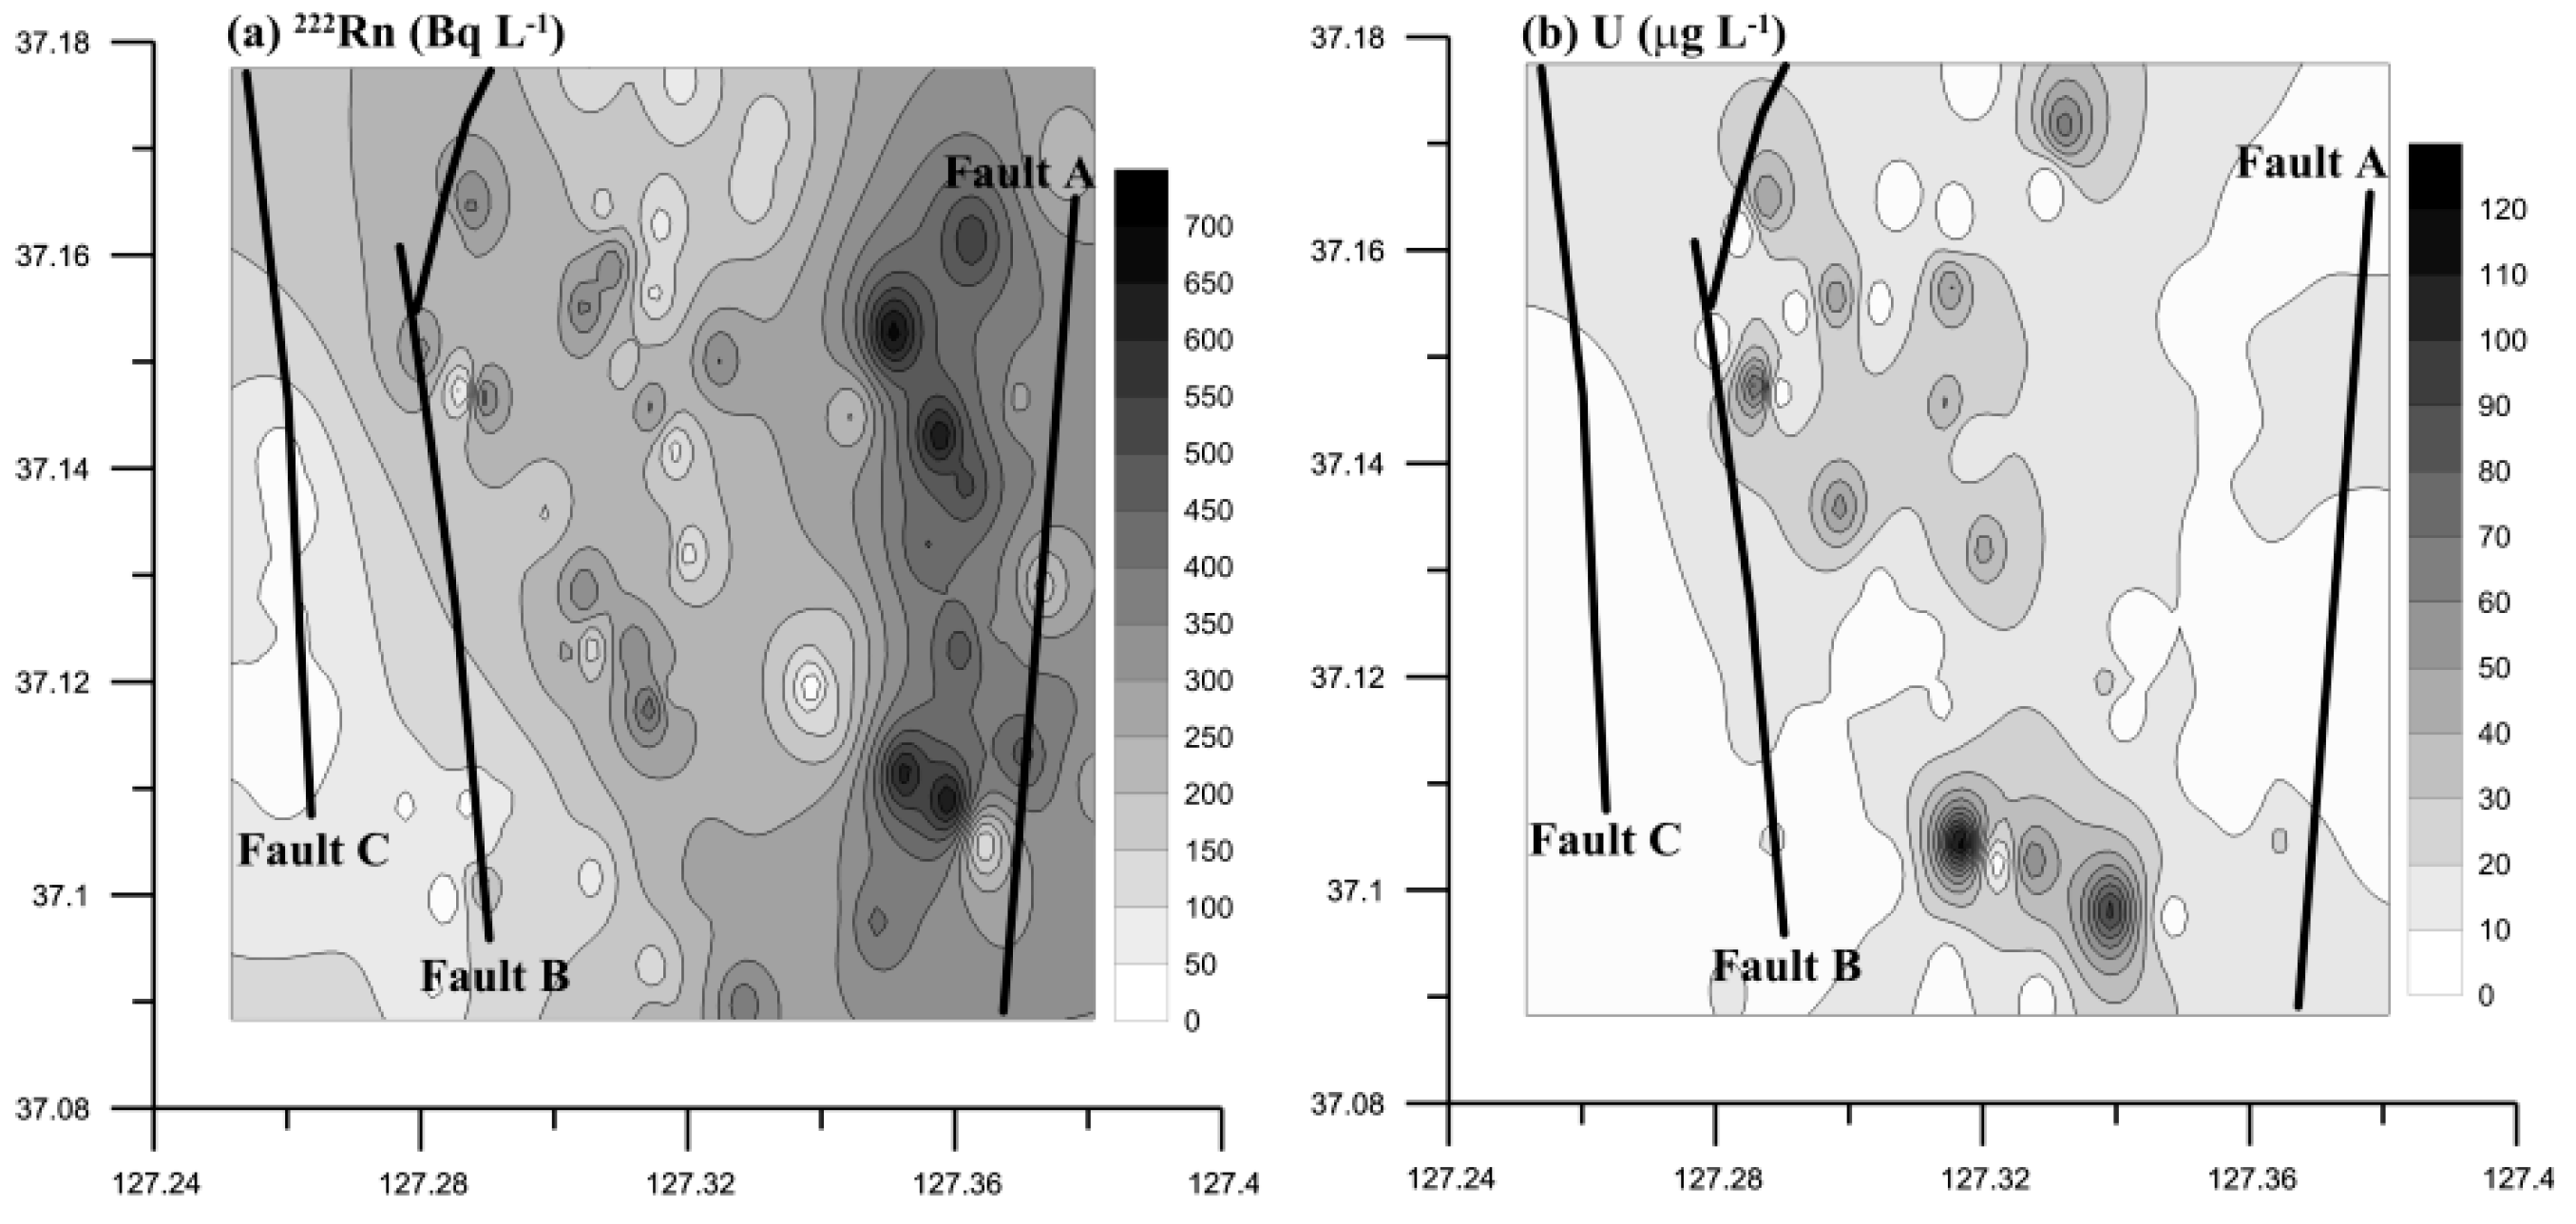
The spatial distributions of the 222Rn and U groundwater concentrations also demonstrated relatively higher concentrations in granite than gneiss areas (Figure 5). To determine the spatial distribution, wells deeper than 30 m were selected to reduce data noise, specifically interactions between surface water and groundwater. Based on these spatial distributions, the highest concentrations (more than 600 Bq L−1) of 222Rn were observed near Fault A over granite bedrock (Figure 5a). This may be due to the fact that fractures with higher permeability/porosity can increase bedrock surface area in fault zones, allowing 222Rn to dissolve from the bedrock into groundwater through active water-rock interactions. Previous studies have reported that fractures can enhance emanation surfaces, allowing 222Rn to escape from rocks via α-recoil [32,33]. The relatively lower 222Rn concentration in groundwater close to Faults B and C may be due to the different lithology (gneiss) of those well locations. The U concentrations displayed different distribution trends with higher U concentrations observed in the southern part of the studied area (Figure 5b). These different spatial distributions may be attributed to the fact that 222Rn and U have different geochemical behavior: while the behavior of gaseous 222Rn is determined by physical processes (e.g., groundwater movement) rather than chemical processes on the basis of the relationships between major ions (Na+, Mg2+, and Cl−) and 222Rn concentrations [34,35], U concentrations in groundwater are controlled by redox potential and CO2 partial pressure [24,36]. Similarly, several researches conducted in Korea have reported poor or weak relationships between 222Rn and U concentrations [25,37,38]. Conversely, Singh et al. reported strong correlation (r = 0.75) between 222Rn and 238U concentrations in drinking water [3]. As such, more comprehensive and comparative investigation is required to better understand the behaviors of 222Rn and U in groundwater with consideration to various chemical and physical processes including water mixing processes (groundwater-groundwater or groundwater-surface water).
3.4. Effect of the Well Depth
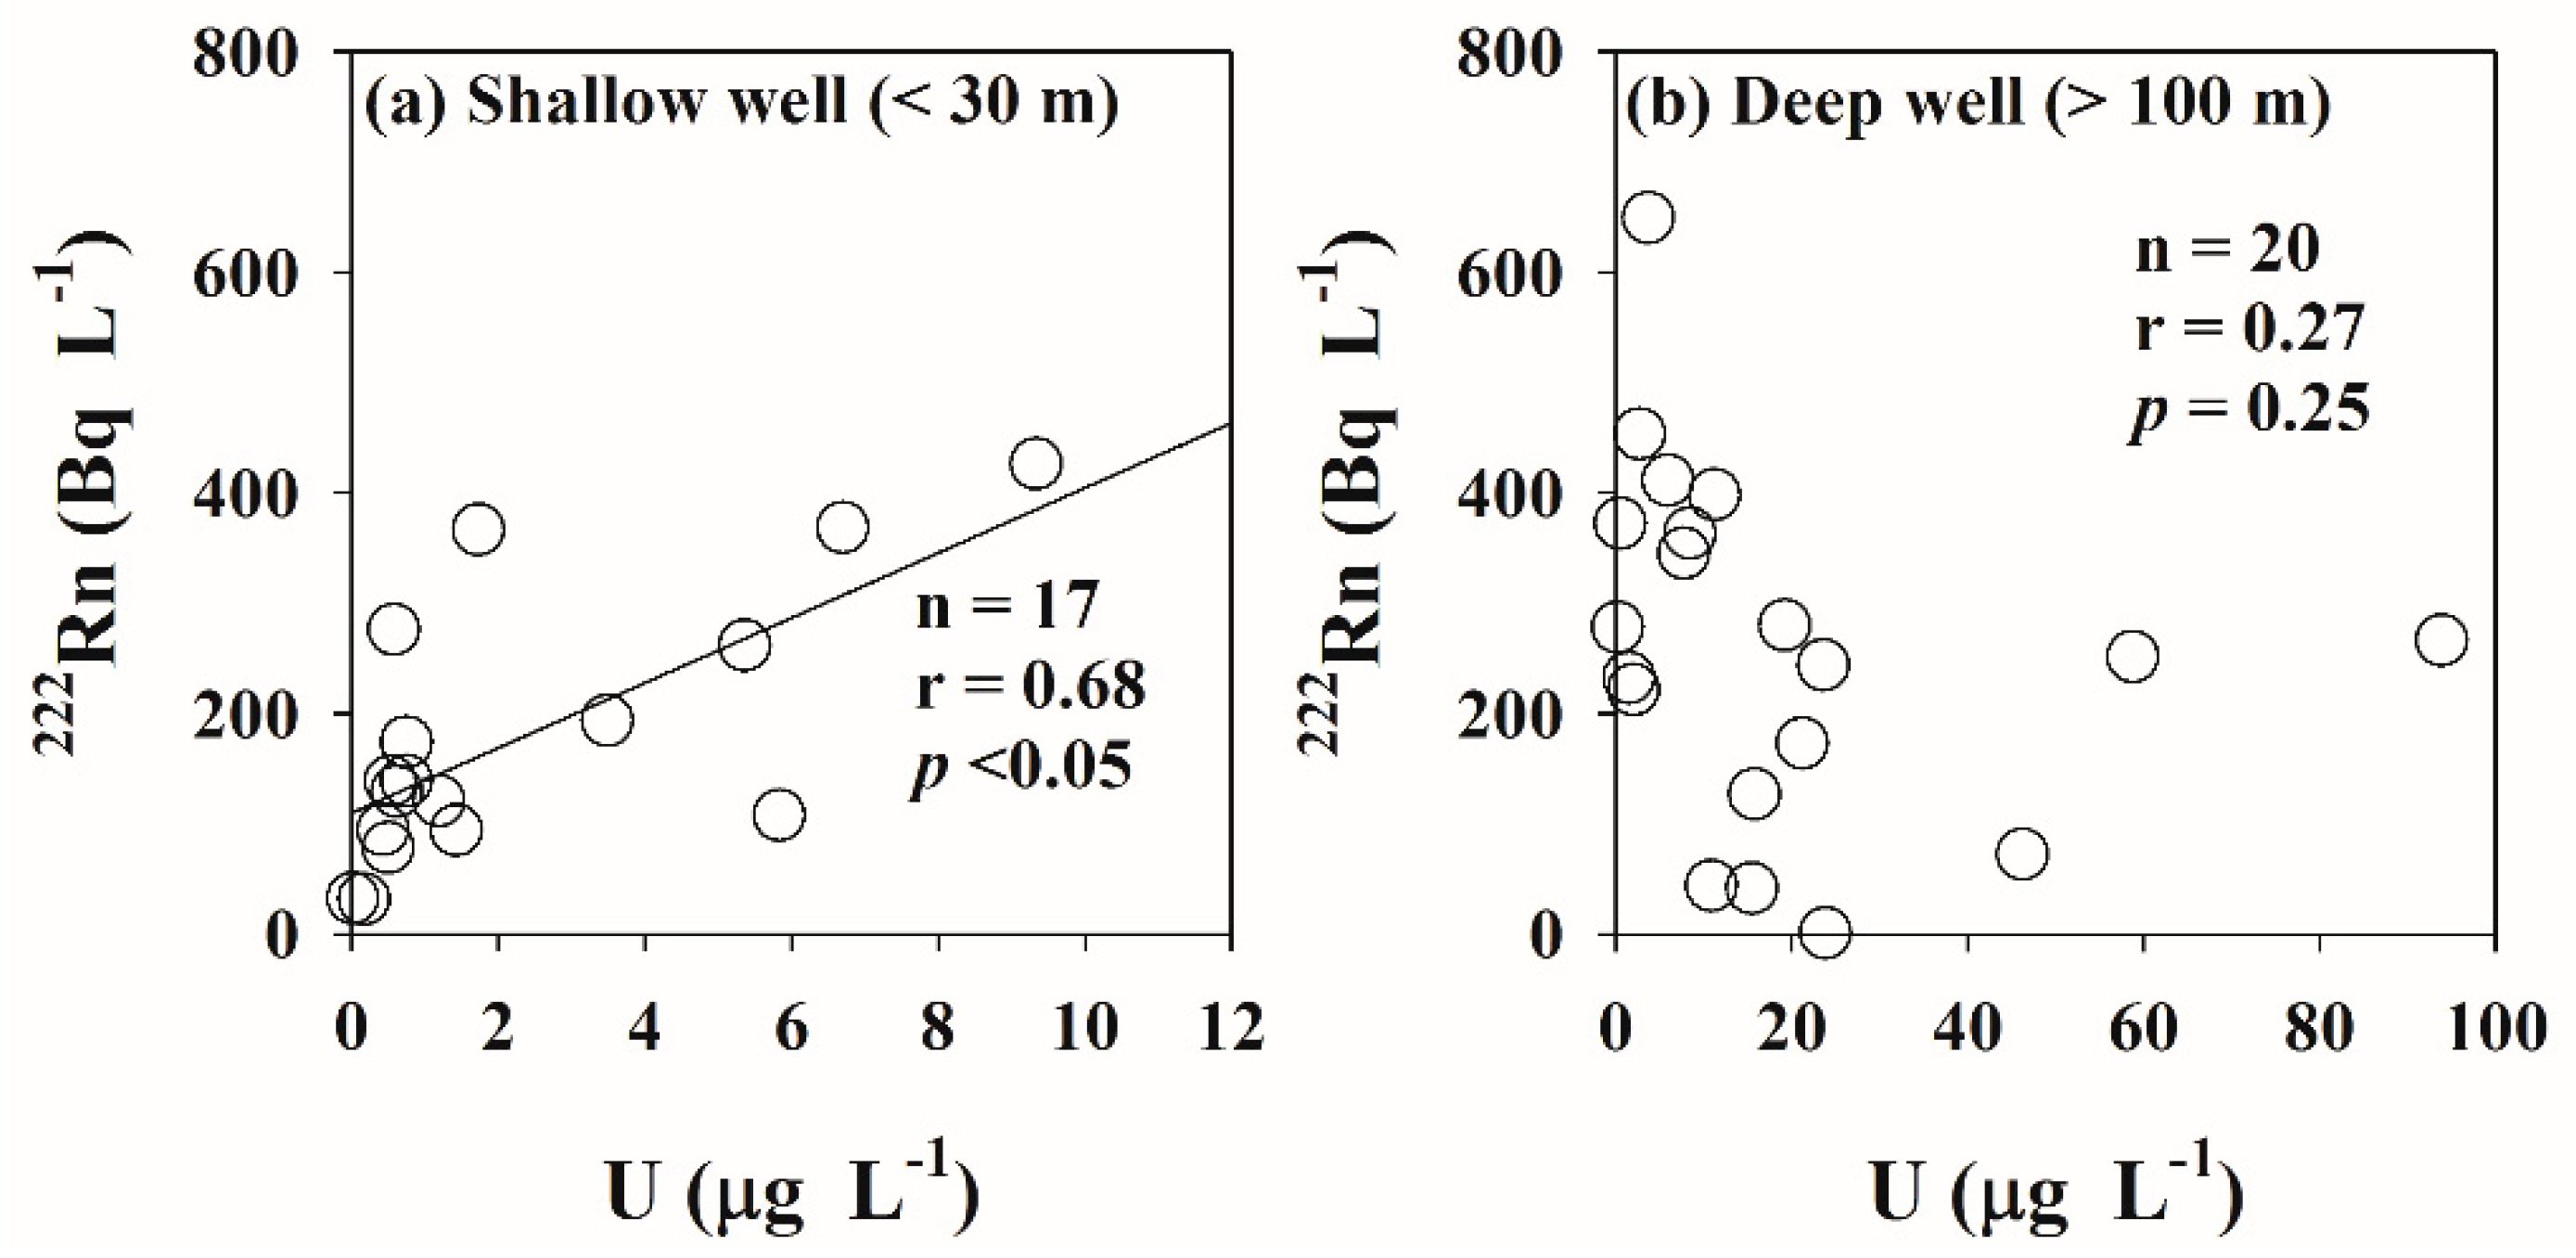
The well depth of the 98 groundwater samples showed no significant statistical correlation with 222Rn (r = 0.10, p = 0.32) or U (r = 0.27, p = 0.15) concentrations. For further granularity, wells located in granite area were classified as shallow (<30 m) or deep (>100 m) to investigate the effect of well depth on radionuclide concentration. While a significant positive correlation (r = 0.68, p < 0.05) was observed between 222Rn and U concentrations in shallow wells, no significant relationship (r = 0.27, p = 0.25) was seen in deep groundwater wells (Figure 6). This result may be due to active groundwater-surface water interaction in shallow wells. In Korea, the mean depth of alluvial and/or weathering zone is generally less than 30 m. This zone tends to have higher hydraulic conductivity and be more fractured than bedrock. Since more active groundwater-surface water interaction can be occurred in the shallow wells, and surface water has lower 222Rn and U concentrations than groundwater [25], the concentrations of these radionuclides in the shallow wells were relatively lower than those of the deep wells and showed a significant positive correlation depending on the surface water mixing rate. The poor correlation of concentrations in the deep wells may be due to different behaviors of 222Rn and U in groundwater (described in detail above).
3.5. Temporal Variation in 222Rn
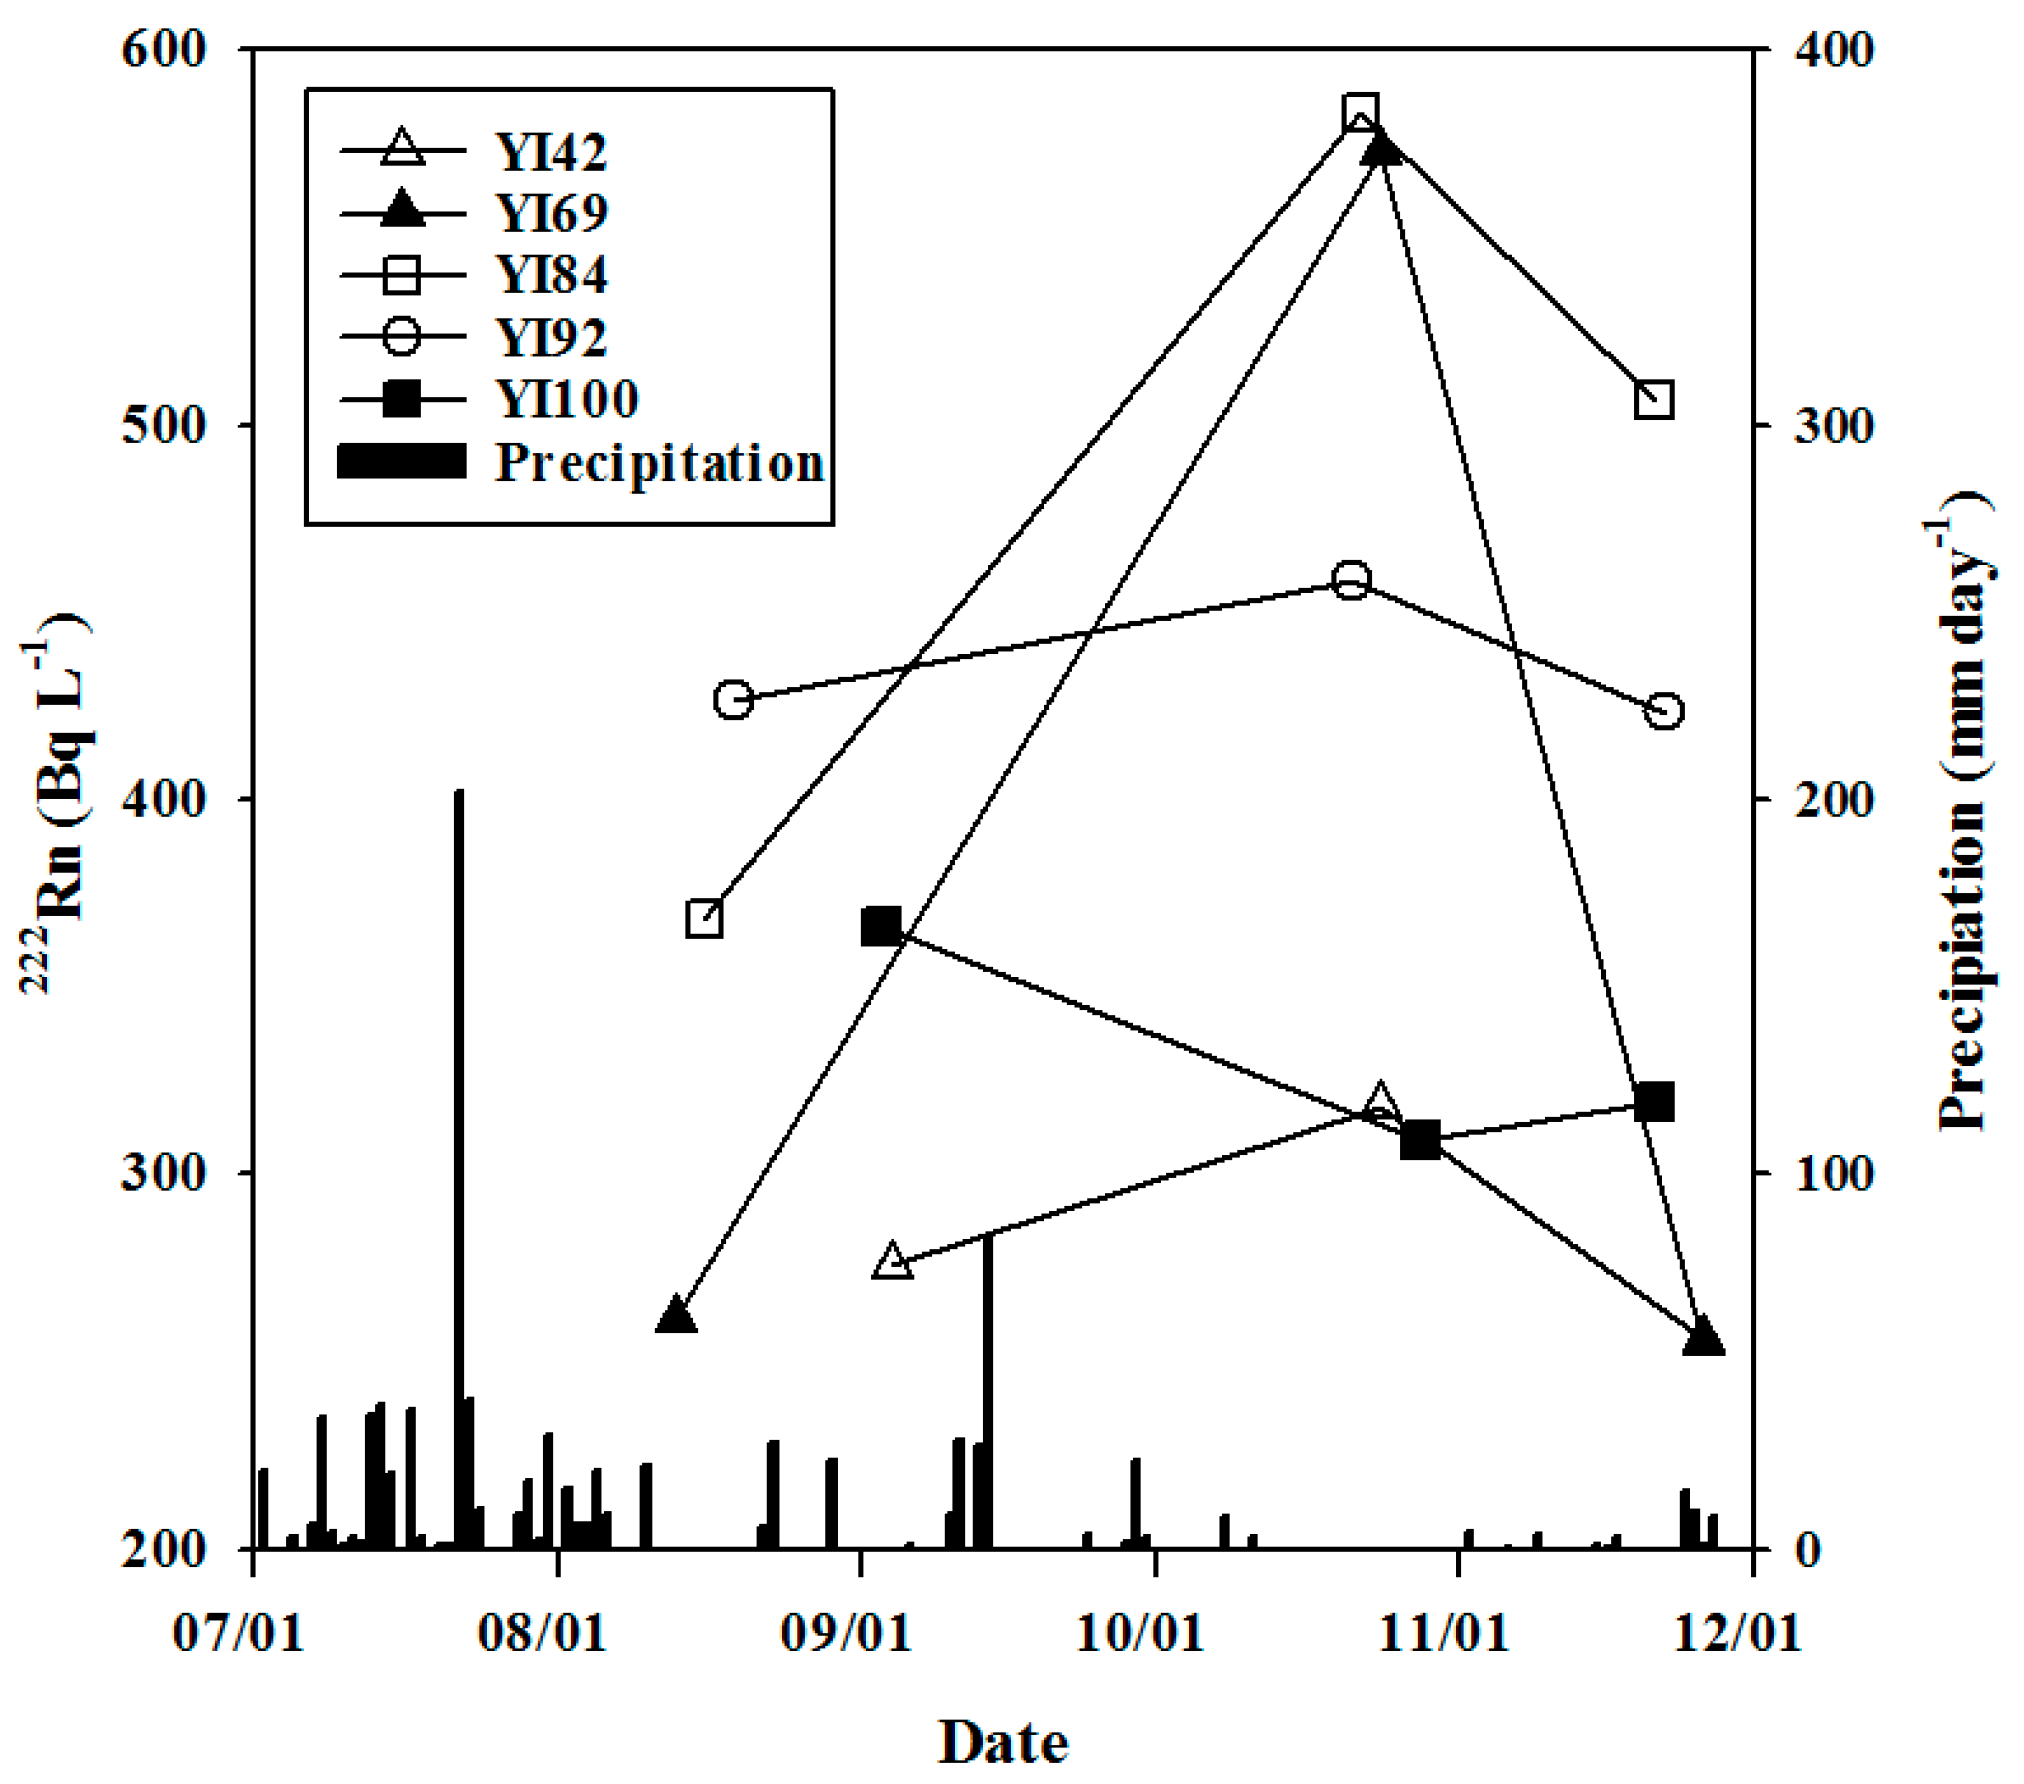
To determine a temporal variation of 222Rn concentrations in shallow wells (<30 m) with relatively active groundwater-surface water interaction, groundwater sampling campaigns were conducted in five wells throughout August, October, and November, 2013. The temporal variations of 222Rn concentration in these well showed similar trends, except for YI100. 222Rn concentrations of the other four wells in October were about two times higher than that in August. This result may reflect the higher precipitation rate in July (Figure 7), because 222Rn concentration in groundwater should be decreased by an inflow of rainwater or surface water into shallow groundwater following large rainfall events in the summer monsoon season (June and July). In November, the 222Rn concentrations decreased, potentially related to the regional groundwater use. Although information on seasonal groundwater use was not obtained in this study, water curtain cultivation has been conducted using groundwater in winter season to maintain high air temperature in vinyl houses in this study area. This continuous groundwater extraction increases groundwater circulation, decreasing the groundwater radon concentration [5] due to an input of water from rivers or streams, which have low 222Rn concentrations. Therefore, these results suggest continuous monitoring or a minimum of bi-weekly measurements of naturally occurring radionuclides in groundwater are required not only to reduce health risks but also to better understand groundwater–surface water interactions.
4. Conclusions
222Rn and U concentrations were measured in 98 groundwater wells in Yongin area, Korea. Results revealed that the 222Rn concentrations of approximately 50% of the sampling points in the study area was higher than 148 Bq L−1 (the AMCL recommended by the US EPA), and 10% of the sampling points displayed U concentrations above 30 µg L−1 (the WHO guideline level for drinking water). Based on statistical analyses, geological variability, well depth, rainfall rates, and geological structures (faults) may affect the levels, temporal variations, and spatial distributions of 222Rn and U in groundwater. Our results suggest that continuous or short interval monitoring of 222Rn and U in groundwater, especially that used for drinking, is required to reduce potential health risks via the intake of groundwater containing high levels of these naturally occurring radionuclides.
Author Contributions
B.W.C. and S.Y.C. conceived the study and conducted the sampling and analysis for the study. S.Y.C., M.-H.K., B.W.C., Y.-Y.J., and Y.H.O. interpreted the data and contributed to the discussion. Y.H.O. and Y.-Y.J. created the figures and tables. The manuscript was written in a joint effort between S.Y.C. and Y.H.O.
Funding
This research was supported by the Basic Research Project (GP2017-008) of the Korea Institute of Geoscience and Mineral Resources (KIGAM), funded by the Ministry of Science, ICT and Future, and National Institute of Environmental Research (NIER-SP2015-386).
Conflicts of Interest
The authors declare no conflict of interest.
Appendix A

Table A1.
Well depth, field parameters including temperature, electrical conductivity (EC), pH, and dissolved oxygen (DO), and the concentrations of 222Rn and U in groundwater of Yongin area in 2013.
Table A1.
Well depth, field parameters including temperature, electrical conductivity (EC), pH, and dissolved oxygen (DO), and the concentrations of 222Rn and U in groundwater of Yongin area in 2013.
| Sampling Point No. | Well Depth (m) | Temp. (°C) | EC (µS cm−1) | pH | DO (mg L−1) | 222Rn (Bq L−1) | U (µg L−1) |
|---|---|---|---|---|---|---|---|
| YI01 | 78 | 14.1 | 402 | 6.5 | 2.9 | 27.4 ± 1.1 | 0.66 ± 0.01 |
| YI02 | 200 | 15.3 | 608 | 8.9 | 2.7 | 126.7 ± 2.6 | 15.80 ± 0.27 |
| YI03 | 30 | 15.3 | 102 | 5.7 | 5.5 | 68.1 ± 1.8 | 0.20 ± 0.01 |
| YI04 | 200 | 16.0 | 455 | 6.6 | 4.7 | 41.5 ± 1.4 | 15.50 ± 0.27 |
| YI05 | 40 | 17.1 | 152 | 6.6 | 5.5 | 112.2 ± 2.5 | 1.20 ± 0.01 |
| YI06 | 45 | 16.6 | 116 | 5.6 | 4.9 | 45.2 ± 1.4 | 0.15 ± 0.01 |
| YI07 | 80 | 18.5 | 228 | 6.0 | 6.2 | 3.7 ± 0.4 | 0.61 ± 0.01 |
| YI08 | 80 | 16.5 | 352 | 6.7 | 1.9 | 8.5 ± 0.6 | 0.63 ± 0.01 |
| YI09 | 100 | 14.9 | 279 | 6.5 | 5.8 | 74.1 ± 1.8 | 0.81 ± 0.01 |
| YI10 | 200 | 14.7 | 270 | 6.3 | 2.7 | 265.9 ± 4.4 | 93.90 ± 1.60 |
| YI11 | 25 | 13.0 | 118 | 6.6 | 5.8 | 107.4 ± 2.3 | 5.83 ± 0.05 |
| YI12 | 120 | 16.0 | 264 | 6.5 | 3.4 | 23.7 ± 0.7 | 0.45 ± 0.01 |
| YI13 | 150 | 15.9 | 138 | 5.8 | 2.8 | 12.2 ± 0.4 | 0.08 ± 0.01 |
| YI14 | 120 | 15.8 | 498 | 6.8 | 0.6 | 61.5 ± 1.2 | 9.42 ± 0.07 |
| YI15 | 100 | 15.0 | 178 | 6.1 | 4.0 | 60.7 ± 1.2 | 0.25 ± 0.01 |
| YI16 | 100 | 13.9 | 111 | 6.3 | 3.5 | 315.6 ± 4.4 | 1.67 ± 0.02 |
| YI17 | 90 | 15.3 | 164 | 6.3 | 4.5 | 363.3 ± 4.9 | 52.10 ± 0.89 |
| YI18 | 80 | 15.6 | 115 | 5.3 | 2.6 | 210.7 ± 3.1 | 0.42 ± 0.01 |
| YI19 | 80 | 14.9 | 228 | 6.3 | 3.4 | 210.0 ± 3.1 | 0.43 ± 0.01 |
| YI20 | 100 | 16.8 | 241 | 6.0 | 4.2 | 538.9 ± 7.1 | 2.08 ± 0.02 |
| YI21 | 100 | 16.1 | 118 | 5.8 | 3.7 | 673.7 ± 8.7 | 2.61 ± 0.02 |
| YI22 | 100 | 14.5 | 68 | 6.1 | 5.4 | 646.7 ± 8.4 | 2.21 ± 0.02 |
| YI23 | 120 | 17.1 | 312 | 6.2 | 4.3 | 279.6 ± 3.9 | 19.20 ± 0.33 |
| YI24 | 100 | 14.3 | 138 | 6.1 | 4.15 | 516.7 ± 6.8 | 18.60 ± 0.32 |
| YI25 | 150 | 16.9 | 134 | 6.1 | 3.3 | 453.0 ± 6 | 2.71 ± 0.02 |
| YI26 | 100 | 18.0 | 150 | 5.8 | 4.2 | 173.0 ± 2.6 | 1.17 ± 0.01 |
| YI27 | 50 | 14.4 | 87 | 6.3 | 4.8 | 163.0 ± 2.5 | 0.27 ± 0.01 |
| YI28 | 100 | 13.8 | 119 | 5.9 | 4.5 | 485.6 ± 6.4 | 0.23 ± 0.01 |
| YI30 | 120 | 14.7 | 195 | 7.2 | 6.6 | 251.5 ± 3.8 | 58.80 ± 1.00 |
| YI31 | 100 | 14.4 | 109 | 5.1 | 6.3 | 286.3 ± 4.2 | 2.11 ± 0.02 |
| YI32 | 100 | 17.9 | 186 | 6.4 | 8.9 | 239.3 ± 3.7 | 117.00 ± 1.99 |
| YI33 | 120 | 14.1 | 129 | 5.3 | 9.0 | 411.1 ± 5.7 | 5.93 ± 0.05 |
| YI34 | 120 | 14.9 | 179 | 5.7 | 8.5 | 221.1 ± 3.4 | 2.00 ± 0.02 |
| YI35 | 100 | 14.5 | 223 | 5.1 | 4.7 | 381.5 ± 5.4 | 3.23 ± 0.03 |
| YI36 | 70 | 14.1 | 337 | 6.0 | 3.6 | 3.0 ± 0.3 | 4.95 ± 0.04 |
| YI37 | 100 | 14.6 | 104 | 5.5 | 6.1 | 39.6 ± 1.0 | 0.25 ± 0.01 |
| YI38 | 100 | 13.2 | 93 | 5.2 | 4.9 | 89.3 ± 1.7 | 0.20 ± 0.01 |
| YI39 | 50 | 14.7 | 251 | 5.5 | 2.0 | 221.1 ± 3.4 | 0.30 ± 0.01 |
| YI40 | 200 | 15.7 | 272 | 7.1 | 6.7 | 43.7 ± 1.1 | 10.9 ± 0.19 |
| YI41 | 100 | 14.3 | 287 | 6.2 | 9.6 | 204.4 ± 3.1 | 48.80 ± 0.83 |
| YI42 | 25 | 13.5 | 114 | 5.4 | 8.4 | 275.9 ± 4.0 | 0.58 ± 0.01 |
| YI43 | 120 | 14.3 | 194 | 5.9 | 10.6 | 232.2 ± 3.5 | 1.46 ± 0.02 |
| YI44 | 120 | 14.3 | 119 | 5.2 | 9.6 | 371.9 ± 5.2 | 0.48 ± 0.01 |
| YI45 | 100 | 14.8 | 156 | 6.2 | 6.2 | 34.1 ± 0.9 | 0.38 ± 0.01 |
| YI46 | 150 | 14.1 | 137 | 6.5 | 6.3 | 35.9 ± 0.9 | 0.15 ± 0.01 |
| YI47 | 100 | 15.1 | 99 | 6.0 | 9.2 | 41.1 ± 1.0 | 0.15 ± 0.01 |
| YI48 | 100 | 16.7 | 183 | 6.3 | 2,3 | 4.1 ± 0.3 | 0.08 ± 0.01 |
| YI49 | 130 | 14.8 | 85 | 7.4 | 6.5 | 363.3 ± 5.1 | 8.42 ± 0.06 |
| YI50 | 100 | 14.6 | 163 | 7.1 | 5.3 | 104.4 ± 1.9 | 21.40 ± 0.37 |
| YI51 | 30 | 13.2 | 161 | 6.1 | 3.8 | 120.7 ± 2.6 | 1.19 ± 0.01 |
| YI52 | 30 | 14.1 | 122 | 5.9 | 6.7 | 32.6 ± 1.2 | 0.02 ± 0.01 |
| YI53 | 35 | 11.9 | 206 | 6.5 | 5.8 | 72.6 ± 1.9 | 0.92 ± 0.01 |
| YI54 | 30 | 13.4 | 88 | 6.9 | 8.9 | 94.1 ± 2.2 | 1.43 ± 0.02 |
| YI55 | 30 | 13.6 | 109 | 6.7 | 8.8 | 138.1 ± 2.9 | 0.53 ± 0.01 |
| YI56 | 35 | 16.3 | 111 | 6.5 | 7.7 | 128.9 ± 2.8 | 0.62 ± 0.01 |
| YI57 | 30 | 16.9 | 199 | 6.3 | 6.5 | 31.5 ± 1.1 | 0.17 ± 0.01 |
| YI58 | 100 | 13.7 | 277 | 6.8 | 2.4 | 81.9 ± 2.0 | 52.20 ± 0.89 |
| YI59 | 33 | 14.8 | 214 | 6.2 | 6.9 | 138.9 ± 2.8 | 0.75 ± 0.01 |
| YI60 | 150 | 15.6 | 157 | 6.7 | 6.1 | 173.0 ± 3.3 | 21.20 ± 0.37 |
| YI61 | 30 | 16.1 | 272 | 6.5 | 3.7 | 310.0 ± 5.0 | 41.90 ± 0.72 |
| YI62 | 50 | 14.1 | 107 | 7.2 | 6.6 | 77.4 ± 2.0 | 10.80 ± 0.19 |
| YI63 | 30 | 14.2 | 173 | 5.9 | 2.7 | 369.3 ± 5.7 | 2.01 ± 0.02 |
| YI64 | 50 | 16.8 | 127 | 6.5 | 4.4 | 357.4 ± 5.5 | 13.90 ± 0.24 |
| YI65 | 37 | 14.4 | 126 | 6.1 | 6.4 | 128.5 ± 2.6 | 0.55 ± 0.01 |
| YI66 | 30 | 14.3 | 192 | 5.8 | 6.9 | 94.4 ± 2.1 | 0.43 ± 0.01 |
| YI67 | 100 | 14.4 | 249 | 6.8 | 4.6 | 99.6 ± 2.2 | 11.00 ± 0.19 |
| YI68 | 100 | 14.4 | 244 | 6.5 | 8.3 | 363.3 ± 5.7 | 6.38 ± 0.05 |
| YI69 | 30 | 16.7 | 712 | 5.5 | 1.7 | 261.5 ± 3.8 | 5.36 ± 0.04 |
| YI70 | 100 | 15.2 | 161 | 6.2 | 1.1 | 357.0 ± 5.0 | 2.26 ± 0.02 |
| YI71 | 90 | 16.4 | 730 | 5.8 | 3.3 | 112.2 ± 2.0 | 1.13 ± 0.01 |
| YI72 | 90 | 16.5 | 234 | 6.2 | 4.3 | 225.9 ± 3.4 | 17.60 ± 0.30 |
| YI73 | 50 | 16.1 | 398 | 5.7 | 2.2 | 436.7 ± 6.1 | 6.87 ± 0.05 |
| YI74 | 100 | 16.8 | 130 | 6.0 | 2.2 | 261.9 ± 4.0 | 3.20 ± 0.03 |
| YI75 | 100 | 14.6 | 146 | 6.9 | 4.8 | 144.4 ± 2.5 | 54.90 ± 0.94 |
| YI76 | 100 | 16.0 | 281 | 7.4 | 5.4 | 36.3 ± 0.9 | 74.00 ± 1.26 |
| YI77 | 100 | 15.6 | 169 | 6.5 | 5.0 | 114.4 ± 1.9 | 0.36 ± 0.01 |
| YI78 | 100 | 15.3 | 159 | 6.2 | 3.5 | 354.1 ± 4.9 | 20.20 ± 0.35 |
| YI79 | 100 | 14.5 | 213 | 5.8 | 2.1 | 195.2 ± 2.9 | 17.60 ± 0.30 |
| YI80 | 150 | 15.3 | 195 | 5.9 | 4.1 | 398.1 ± 5.3 | 11.20 ± 0.20 |
| YI81 | 170 | 14.5 | 198 | 6.0 | 4.1 | 345.2 ± 4.7 | 7.71 ± 0.06 |
| YI82 | 80 | 14.8 | 132 | 5.5 | 3.8 | 132.2 ± 2.1 | 3.15 ± 0.03 |
| YI83 | 150 | 15.2 | 147 | 6.1 | 6.4 | 0.6 ± 0.1 | 23.80 ± 0.41 |
| YI84 | 25 | 16.7 | 191 | 6.3 | 5.4 | 368.1 ± 4.9 | 6.70 ± 0.05 |
| YI85 | 100 | 17.9 | 83 | 6.0 | 5.7 | 474.4 ± 6.2 | 0.94 ± 0.01 |
| YI86 | 200 | 14.8 | 69 | 5.9 | 7.3 | 277.8 ± 3.9 | 0.23 ± 0.01 |
| YI87 | 170 | 13.7 | 157 | 5.8 | 4.8 | 648.9 ± 8.3 | 3.69 ± 0.03 |
| YI88 | 100 | 14.4 | 109 | 6.0 | 3.7 | 623.7 ± 8.0 | 5.53 ± 0.04 |
| YI89 | 200 | 16.8 | 297 | 6.8 | 3.8 | 72.2 ± 1.4 | 46.20 ± 0.79 |
| YI90 | 200 | 16.8 | 218 | 6.3 | 6.0 | 243.7 ± 3.5 | 23.60 ± 0.41 |
| YI91 | 50 | 14.9 | 184 | 6.6 | 5.1 | 116.3 ± 1.9 | 5.80 ± 0.05 |
| YI92 | 25 | 17.1 | 125 | 6.1 | 4.4 | 426.3 ± 5.7 | 9.34 ± 0.07 |
| YI93 | 100 | 17.1 | 157 | 7.7 | 5.6 | 108.1 ± 1.8 | 4.53 ± 0.04 |
| YI94 | 50 | 14.1 | 120 | 7.4 | 6.2 | 70.7 ± 1.5 | 1.06 ± 0.01 |
| YI96 | 30 | 13.7 | 118 | 6.5 | 6.0 | 173.7 ± 2.8 | 0.75 ± 0.01 |
| YI97 | 30 | 14.2 | 124 | 6.7 | 6.5 | 193.3 ± 3.0 | 3.49 ± 0.03 |
| YI98 | 50 | 16.0 | 321 | 7.1 | 3.7 | 124.1 ± 2.2 | 65.10 ± 1.11 |
| sYI99 | 30 | 16.8 | 152 | 6.6 | 4.8 | 78.1 ± 1.6 | 0.50 ± 0.01 |
| YI100 | 30 | 14.8 | 183 | 6.7 | 5.1 | 366.3 ± 5.2 | 1.73 ± 0.02 |
References
- Morris, B.L.; Lawrence, A.R.L.; Chilton, P.J.C.; Adams, B.; Calow, R.C.; Klinck, B.A. Groundwater and its Susceptibility to Degradation: A Global Assessment of the Problem and Options for Management. In Early Warning and Assessment Report Series RS 03-3; United Nations Environment Programme (UNEP): Nairobi, Kenya, 2003. [Google Scholar]
- Lee, J.Y. Environmental issues of groundwater in Korea: Implications for sustainable use. Environ. Conserv. 2011, 38, 64–74. [Google Scholar] [CrossRef]
- Singh, P.; Singh, P.; Sahoo, B.K.; Bajwa, B.S. A study on uranium and radon levels in drinking water sources of a mineralized zone of Himachal Pradesh, India. J. Radioanal. Nucl. Chem. 2016, 309, 541–549. [Google Scholar] [CrossRef]
- Thivya, C.; Chidambaram, S.; Thilagavathi, R.; Tirumalesh, K.; Nepolian, M.; Prasanna, M.V. Spatial and temporal variations of radon concentrations in groundwater of hard rock aquifers in Madurai district, India. J. Radioanal. Nucl. Chem. 2017, 313, 603–609. [Google Scholar] [CrossRef]
- Asare-Donkor, N.K.; Poku, P.A.; Addison, E.C.D.K.; Wemengah, D.D.; Adimado, A.A. Measurement of radon concentration in groundwater in the Ashanti region of Ghana. J. Radioanal. Nucl. Chem. 2018, 317, 675–683. [Google Scholar] [CrossRef]
- Avery, E.; Bibby, R.; Visser, A.; Esser, B.; Moran, J. Quantification of Groundwater Discharge in a Subalpine Stream Using Radon-222. Water 2018, 10, 100. [Google Scholar] [CrossRef]
- Schubert, M.; Knöller, K.; Stollberg, R.; Mallast, U.; Ruzsa, G.; Melikadze, G. Evidence for Submarine Groundwater Discharge into the Black Sea—Investigation of Two Dissimilar Geographical Settings. Water 2017, 9, 468. [Google Scholar] [CrossRef]
- Schubert, M.; Knoeller, K.; Rocha, C.; Einsiedl, F. Evaluation and source attribution of freshwater contributions to Kinvarra Bay, Ireland, using 222Rn, EC and stable isotopes as natural indicators. Environ. Monit. Assess. 2015, 187, 105. [Google Scholar] [CrossRef]
- Cartwright, I.; Hofmann, H.; Sirianos, M.A.; Weaver, T.R.; Simmons, C.T. Geochemical and 222Rn constraints on baseflow to the Murray River, Australia, and timescales for the decay of low-salinity groundwater lenses. J. Hydrol. 2011, 405, 333–343. [Google Scholar] [CrossRef]
- Cook, P.G.; Wood, C.; White, T.; Simmons, C.T.; Fass, T.; Brunner, P. Groundwater inflow to a shallow, poorly-mixed wetland estimated from a mass balance of radon. J. Hydrol. 2008, 354, 213–226. [Google Scholar] [CrossRef]
- Barberio, M.; Gori, F.; Barbieri, M.; Billi, A.; Devoti, R.; Doglioni, C.; Petitta, M.; Riguzzi, F.; Rusi, S. Diurnal and Semidiurnal Cyclicity of Radon (222Rn) in Groundwater, Giardino Spring, Central Apennines, Italy. Water 2018, 10, 1276. [Google Scholar] [CrossRef]
- Kuo, T. Correlating precursory declines in groundwater radon with earthquake magnitude. Groundwater 2014, 52, 217–224. [Google Scholar] [CrossRef] [PubMed]
- Igarashi, G.; Saeki, S.; Takahata, N.; Sumikawa, K.; Tasaka, S.; Sasaki, Y.; Takahashi, M.; Sano, Y. Groundwater radon anomaly before the Kobe Earthquake in Japan. Science 1995, 269, 60–61. [Google Scholar] [CrossRef] [PubMed]
- Rodrigo, J.F.; Casas-Ruiz, M.; Vidal, J.; Barbero, L.; Baskaran, M.; Ketterer, M.E. Application of 234U/238U activity ratios to investigations of subterranean groundwater discharge in the Cadiz coastal area (SW Spain). J. Environ. Radioact. 2014, 130, 68–71. [Google Scholar] [CrossRef] [PubMed]
- Wang, R.-M.; You, C.-F. Uranium and strontium isotopic evidence for strong submarine groundwater discharge in an estuary of a mountainous island: A case study in the Gaoping River Estuary, Southwestern Taiwan. Mar. Chem. 2013, 157, 106–116. [Google Scholar] [CrossRef]
- Todorovic, N.; Nikolov, J.; Forkapic, S.; Bikit, I.; Mrdja, D.; Krmar, M.; Veskovic, M. Public exposure to radon in drinking water in Serbia. Appl. Radiat. Isot. 2012, 70, 543–549. [Google Scholar] [CrossRef]
- Ravikumar, P.; Somashekar, R. Determination of the radiation dose due to radon ingestion and inhalation. Int. J. Environ. Sci. Technol. 2014, 11, 493–508. [Google Scholar] [CrossRef]
- Kurttio, P.; Komulainen, H.; Leino, A.; Salonen, L.; Auvinen, A.; Saha, H. Bone as a possible target of chemical toxicity of natural uranium in drinking water. Environ. Health Perspect. 2004, 113, 68–72. [Google Scholar] [CrossRef]
- Zamora, M.L.; Tracy, B.; Zielinski, J.; Meyerhof, D.; Moss, M. Chronic ingestion of uranium in drinking water: A study of kidney bioeffects in humans. Toxicol. Sci. 1998, 43, 68–77. [Google Scholar] [CrossRef]
- Ayotte, J.D.; Gronberg, J.M.; Apodaca, L.E. Trace elements and radon in groundwater across the United States, 1992–2003. In Scientific Investigation Report 2011–5059; U.S. Geological Survey: Reston, VA, USA, 2011. [Google Scholar]
- Cho, B.W.; Kim, H.K.; Kim, M.S.; Hwang, J.H.; Yoon, U.; Cho, S.Y.; Choo, C.O. Radon concentrations in the community groundwater system of South Korea. Environ. Monit. Assess. 2019, 191, 189. [Google Scholar] [CrossRef]
- WHO. Guidelines for Drinking-Water Quality, 4th ed.; WHO: Geneva, Switzerland, 2011. [Google Scholar]
- Shin, W.; Oh, J.; Choung, S.; Cho, B.W.; Lee, K.S.; Yun, U.; Woo, N.C.; Kim, H.K. Distribution and potential health risk of groundwater uranium in Korea. Chemosphere 2016, 163, 108–115. [Google Scholar] [CrossRef]
- Hwang, J.; Kim, T.; Kim, H.; Cho, B.; Lee, S. Predictive radon potential mapping in groundwater: A case study in Yongin, Korea. Environ. Earth Sci. 2017, 76, 515–527. [Google Scholar] [CrossRef]
- Jeong, C.H.; Yang, J.H.; Lee, Y.C.; Lee, Y.J.; Cho, H.Y.; Kim, M.S.; Kim, H.K.; Kim, T.S.; Jo, B.U. Occurrence characteristics of uranium and radon-222 in groundwater at ○○ Village, Yongin area. J. Eng. Geol. 2016, 26, 261–276. [Google Scholar] [CrossRef]
- Kim, Y.; Cho, S.-Y.; Yoon, Y.-Y.; Lee, K.-Y. Optimal method of radon analysis in groundwater using ultra low-level liquid scintillation counter. J. Soil Groundw. Environ. 2006, 11, 59–66, (In Korean with English abstract). [Google Scholar]
- Currie, L.A. Limits for qualitative detection and quantitative determination, application to radiochemistry. Anal. Chem. 1968, 40, 589–593. [Google Scholar] [CrossRef]
- Hohorst, F.A.; Huntley, M.W.; Hantenstein, S.D. Determination of Radium in Water; Idaho National Engineering Laboratory: Idaho Falls, ID, USA, 1995.
- Bartlett, T.R.; Morrison, S.J. Tracer method to determine residence time in a permeable reactive barrier. Groundwater 2009, 47, 598–604. [Google Scholar] [CrossRef] [PubMed]
- Krachler, R.; Krachler, R.; Gulce, F.; Keppler, B.K.; Wallner, G. Uranium concentrations in sediment pore waters of Lake Neusiedl, Austria. Sci. Total Environ. 2018, 633, 981–988. [Google Scholar] [CrossRef] [PubMed]
- Asumadu-Sakyi, A.B.; Oppon, O.C.; Quashie, F.K.; Adjei, C.A.; Akortia, E.; Nsiah-Akoto, I.; Appiah, K. Levels and potential effect of radon gas in groundwater of some communities in the Kassena Nankana district of the Upper East region of Ghana. Proc. Int. Acad. Ecol. Environ. Sci. 2012, 2, 223–233. [Google Scholar]
- Khattak, N.U.; Khan, M.A.; Shah, M.T.; Ali, N. Radon concentration in drinking water sources of the region adjacent to a tectonically active Karak Thrust, southern Kohat Plateau, Khyber Pakhtunkhwa, Pakistan. J. Radioanal. Nucl. Chem. 2014, 302, 315–329. [Google Scholar] [CrossRef]
- Erdogan, M.; Eren, N.; Demirel, S.; Zedef, V. Determination of radon concentration levels in well water in Konya, Turkey. Radiat. Prot. Dosim. 2013, 156, 489–494. [Google Scholar] [CrossRef]
- Telahigue, F.; Agoubi, B.; Souid, F.; Kharroubi, A. Groundwater chemistry and radon-222 distribution in Jerba Island, Tunisia. J. Environ. Radioact. 2018, 182, 74–84. [Google Scholar] [CrossRef]
- Roba, C.A.; Codrea, V.; Moldovan, M.; Baciu, C.; Cosma, C. Radon and radium content of some cold and thermal aquifers from Bihor County (northwestern Romania). Geofluids 2010, 10, 571–585. [Google Scholar] [CrossRef]
- Murphy, W.M.; Shock, E.L. Environmental aqueous geochemistry of actinides. Rev. Mineral. Geochem. 1999, 38, 221–253. [Google Scholar]
- Jeong, C.H.; Yang, J.H.; Lee, Y.J.; Lee, Y.C.; Choi, H.Y.; Kim, M.S.; Kim, H.K.; Kim, T.S.; Jo, B.U. Occurrences of uranium and radon-222 from groundwaters in various geological environment in the Hoengseong area. J. Eng. Geol. 2015, 25, 557–576. [Google Scholar] [CrossRef]
- Cho, B.W.; Kim, M.S.; Kim, T.S.; Han, J.S.; Yun, U.; Lee, B.D.; Hwang, J.H.; Choo, C.O. Hydrochemistry and distribution of uranium and radon in groundwater of the Nonsan area. J. Eng. Geol. 2012, 22, 427–437. [Google Scholar] [CrossRef]
Figure 1.
A simplified geological map of the sampling points in Yongin area, Korea.

Figure 2.
Histograms showing concentration frequency distributions for (a) radon (222Rn) and (b) uranium (U) in the groundwater samples.
Figure 2.
Histograms showing concentration frequency distributions for (a) radon (222Rn) and (b) uranium (U) in the groundwater samples.

Figure 3.
Scatter plots between 222Rn and field parameters ((a) temperature; (b) pH; (c) EC; and (d) DO) in the groundwater samples.
Figure 3.
Scatter plots between 222Rn and field parameters ((a) temperature; (b) pH; (c) EC; and (d) DO) in the groundwater samples.

Figure 4.
Scatter plots between U and field parameters ((a) temperature; (b) pH; (c) EC; and (d) DO) in the groundwater samples.
Figure 4.
Scatter plots between U and field parameters ((a) temperature; (b) pH; (c) EC; and (d) DO) in the groundwater samples.

Figure 5.
Spatial distributions of (a) 222Rn (Bq L−1) and (b) U (µg L−1) in the groundwater samples (well depth > 30 m) with the different concentration scales (0–700 Bq L−1 for 222Rn and 0–120 µg L−1 for U).
Figure 5.
Spatial distributions of (a) 222Rn (Bq L−1) and (b) U (µg L−1) in the groundwater samples (well depth > 30 m) with the different concentration scales (0–700 Bq L−1 for 222Rn and 0–120 µg L−1 for U).

Figure 6.
Scatter plots showing 222Rn and U in the groundwater samples from the shallow (a) and deep (b) wells in the granite area. Note different scale of the axes.
Figure 6.
Scatter plots showing 222Rn and U in the groundwater samples from the shallow (a) and deep (b) wells in the granite area. Note different scale of the axes.

Figure 7.
Temporal variations in 222Rn concentrations in the shallow (<30 m) groundwater wells in August, October, and November 2013.
Figure 7.
Temporal variations in 222Rn concentrations in the shallow (<30 m) groundwater wells in August, October, and November 2013.

© 2019 by the authors. Licensee MDPI, Basel, Switzerland. This article is an open access article distributed under the terms and conditions of the Creative Commons Attribution (CC BY) license (http://creativecommons.org/licenses/by/4.0/).
Share and Cite
MDPI and ACS Style
Cho, S.Y.; Koo, M.-H.; Cho, B.W.; Jung, Y.-Y.; Oh, Y.H. Factors Controlling the Spatial and Temporal Variability in Groundwater 222Rn and U Levels. Water 2019, 11, 1796. https://doi.org/10.3390/w11091796
AMA Style
Cho SY, Koo M-H, Cho BW, Jung Y-Y, Oh YH. Factors Controlling the Spatial and Temporal Variability in Groundwater 222Rn and U Levels. Water. 2019; 11(9):1796. https://doi.org/10.3390/w11091796
Chicago/Turabian StyleCho, Soo Young, Min-Ho Koo, Byong Wook Cho, Youn-Young Jung, and Yong Hwa Oh. 2019. "Factors Controlling the Spatial and Temporal Variability in Groundwater 222Rn and U Levels" Water 11, no. 9: 1796. https://doi.org/10.3390/w11091796
Note that from the first issue of 2016, this journal uses article numbers instead of page numbers. See further details here.