Resistance of Laminar Drain Reinforcement Levee against Overflow Erosion

1
Foundation & Geotechnical Engineering, Structures Technology Division, Railway Technical Research Institute, Tokyo 185-8540, Japan
2
Department of Civil Engineering, Faculty of Science and Technology, Tokyo University of Science, Chiba 278-8510, Japan
*
Author to whom correspondence should be addressed.
Water 2019, 11(9), 1768; https://doi.org/10.3390/w11091768
Submission received: 26 July 2019
/
Revised: 9 August 2019
/
Accepted: 20 August 2019
/
Published: 25 August 2019
(This article belongs to the Section Hydraulics and Hydrodynamics)
Abstract
:As a method for reinforcing against overflow erosion and infiltration, this study investigated a laminar drain reinforcement (LDR) levee, in which the drain layers are set on the back slope and connected to concrete panels using geogrid layers. We examined the resistance against overflow erosion of the LDR levee by large-scale model tests with a 1 m high model levee. We also compared the resistance of an armored levee, which is covered with concrete panels, and a GRS (geosynthetic-reinforced soil) levee, in which the geogrid layers are laid in the levee body with connecting concrete panels. The results of the model tests reveal that: (1) the LDR levee can maintain the initial height and shape for more than 150 min; by comparison, the times to levee failure were 87 and 102 min for the armored and GRS levees, respectively; (2) the LDR levee was shown to have a highly tenacious structure offering resistance to overflow erosion. In particular, panels easily flowed out with a slight gap (less than 1 cm) for the armored levee, while the LDR levee was able to prevent flowing out of panels and the erosion of the levee body, thanks to the laminar drain at the back slope, even when the gaps between the surface panels exceeded 5 cm.
1. Introduction
Because of repeated episodes of heavy rains, levee failures and floods occur in large numbers worldwide, causing massive flood damage every year [1,2,3,4]. Therefore, it is essential to design river levees that conform to principles of safety and reliability, and that have a structure that contains water levels below the high-water level (HWL). At the time of floods, however, the water level sometimes exceeds the HWL. Although the causes of levee failure are overflow, infiltration, and erosion, most levee failures are due to overflow.
In order to cope with overflow, infiltration, erosion, and additionally earthquakes, a compound-type levee using artificial materials such as geotextiles in addition to different types of soil and crushed stone has been manufactured since the early 20th century. Using multiple materials reinforces the safety of the levee, and, in the major rivers in the world, conversion from the uniform-type levee such as the earthen levee to the compound-type levee is in progress. Six countries, namely the United Kingdom, France, Germany, the Netherlands, Ireland, and the United States, have created the International Levee Handbook (ILH) [5], which collects international knowledge on river levees and numerous types of levee constructions. The ILH presents methods of combined artificial materials such as geotextile, anchors, and sheet piles as the latest levee reinforcement technology against both infiltration and overflow erosion. In Japan, levees are generally treated as semi-natural structures made of soil only. For this reason, in Japan the compound-type levees are limited to a drain method [6], arrow sheet, and armored levee [7].
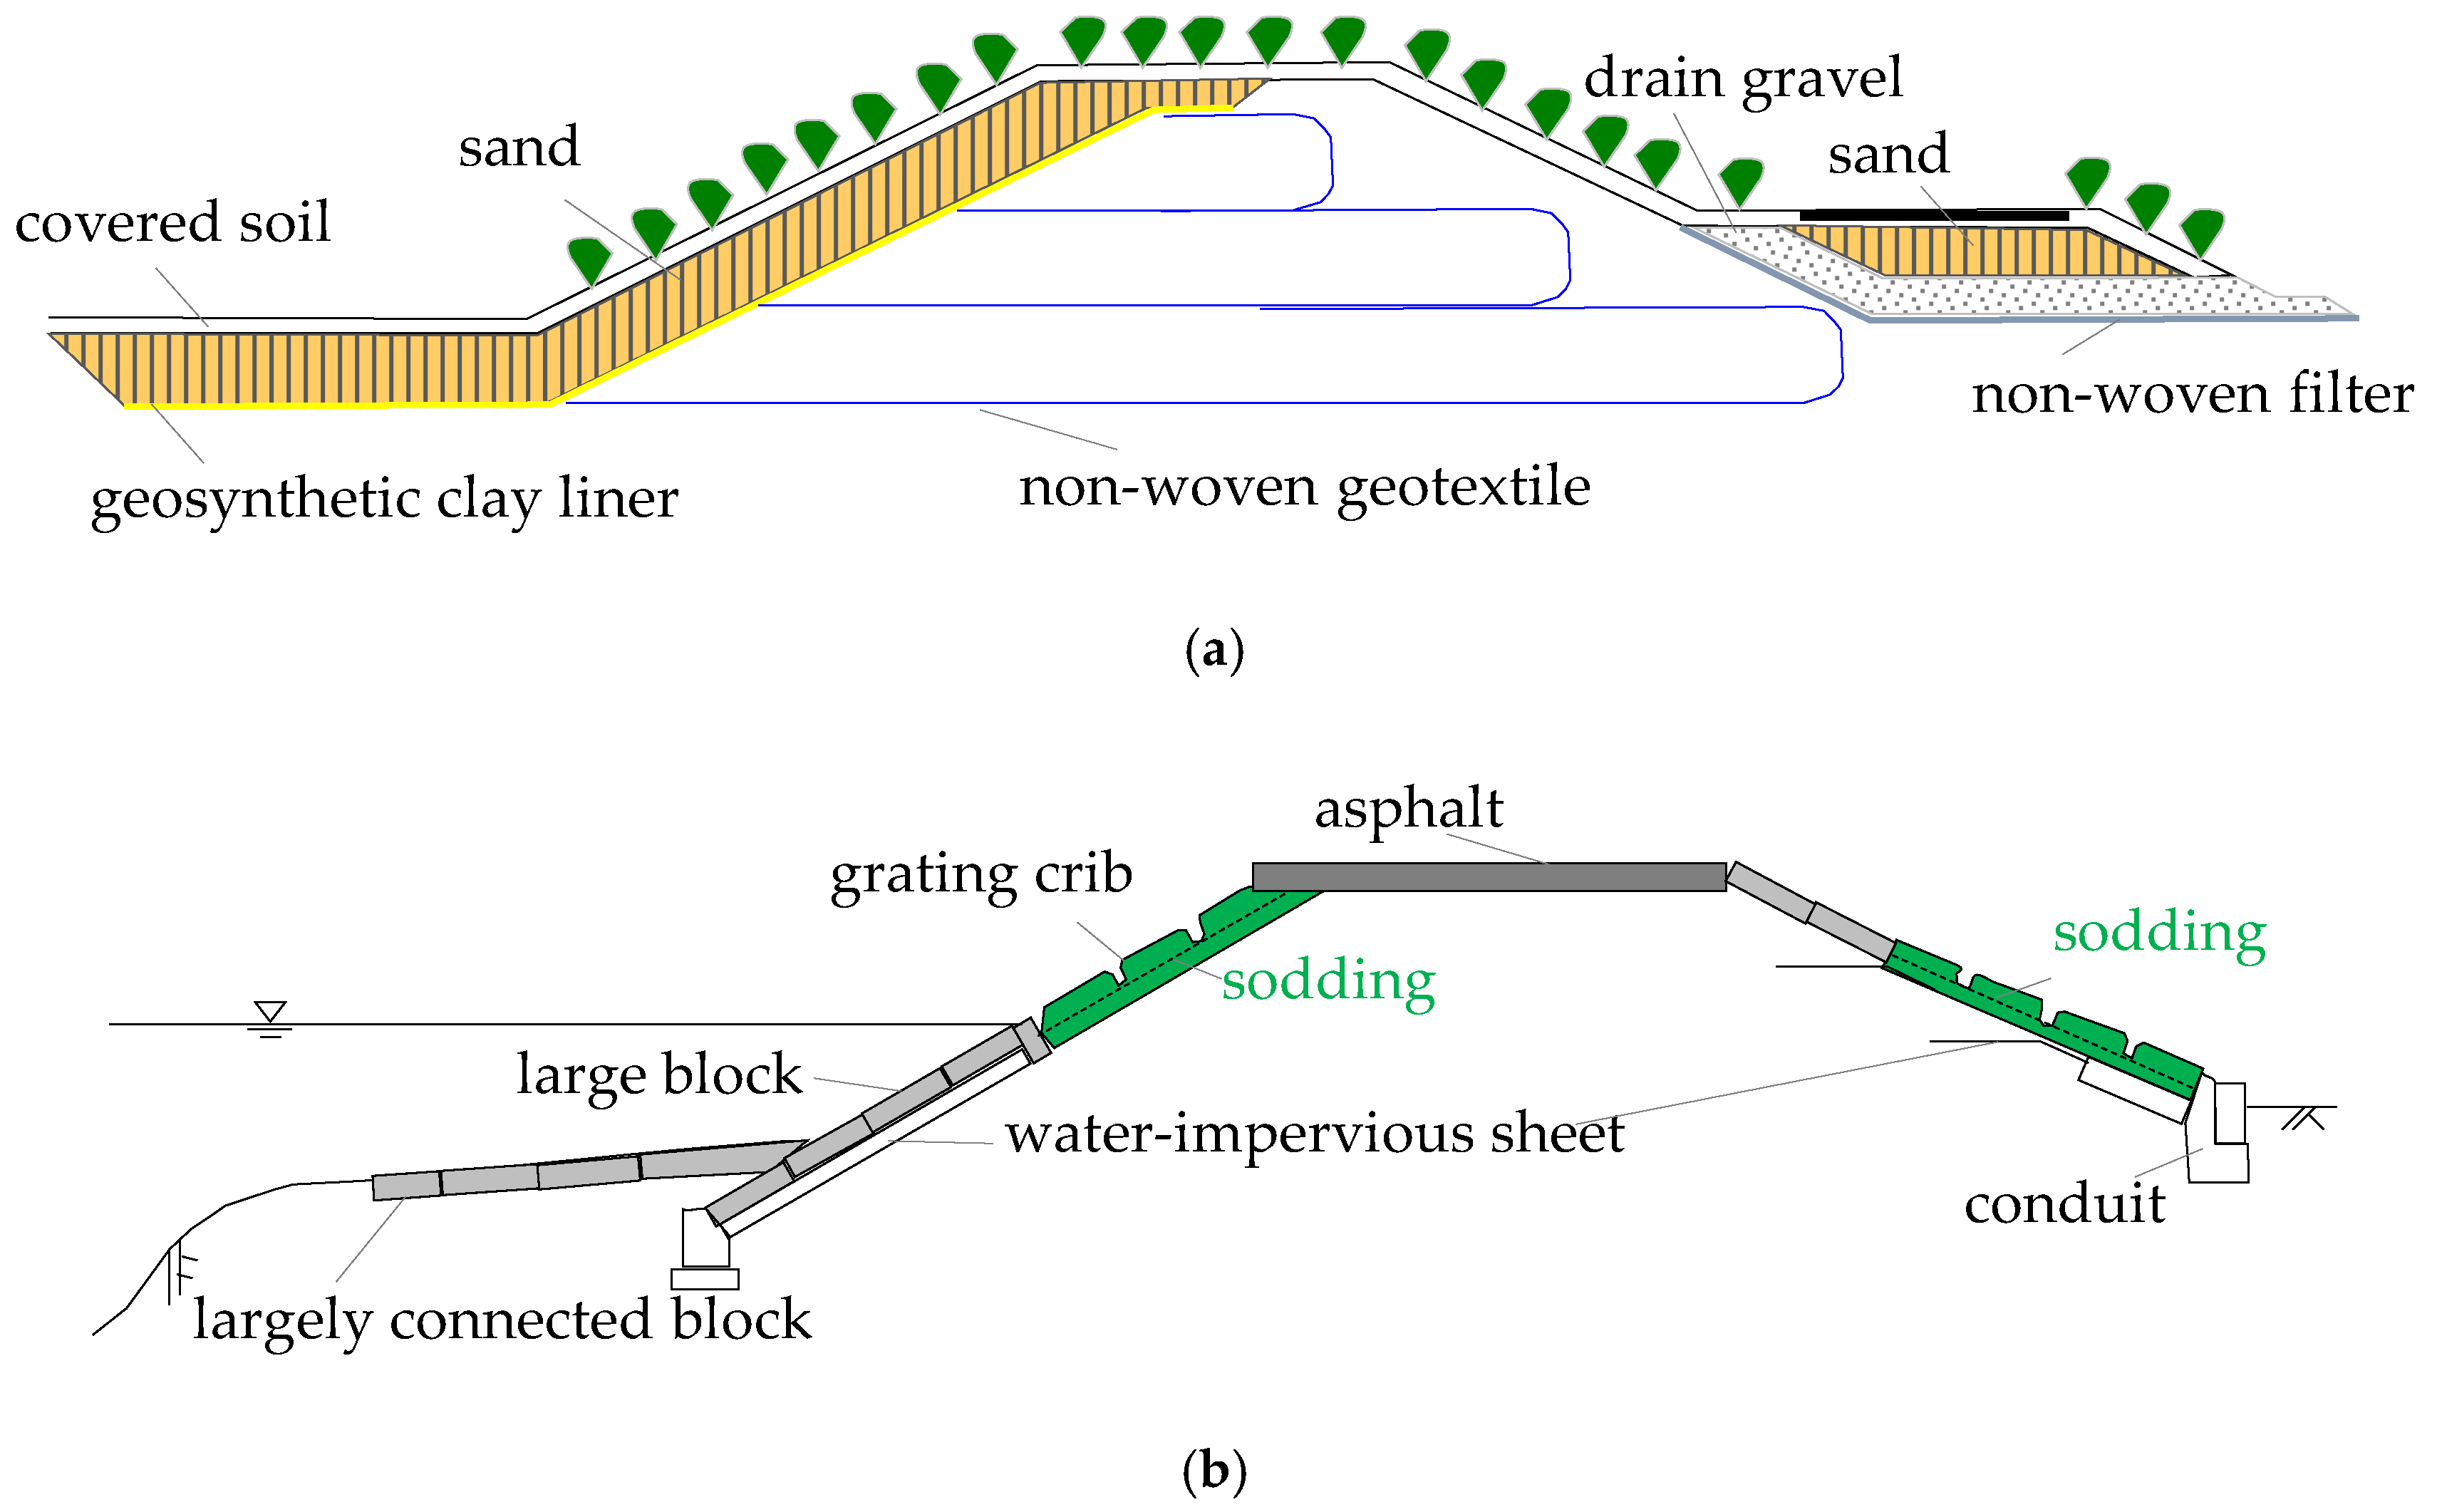
Geosynthetics are a type of artificial material used for reinforced embankment and compound-type levees. Figure 1 shows an example of a compound-type levee using such artificial materials, specifically examples described in the ILH (Figure 1a) and an armored levee (Figure 1b) in Japan. Werth et al. [8] studied the method in Germany of covering the front and back slope of the levee with geotextile and securing it with an anchor. In Germany and other countries, various compound-type levees utilizing geosynthetics have been constructed [9,10,11,12], and there have been many applications of geosynthetics at the time of reconstruction of existing levees. In general, compound-type levees provide the water-shielding measures to control the infiltration of river water on the front slope, water shielding and overflow measures on the crest, and drainage measures for the infiltration on the back slope. It is important to cover the surface of the levee with a panel in order to suppress the erosion of the levee when it overflows. However, in the case of an overflow of long duration, there is a high possibility that the panel would be flowed out. Therefore, the authors introduced a geosynthetic-reinforced soil (GRS) technology [13,14] to the river levees, which is generally used to reinforce an embankment against earthquakes. We studied the effect of the GRS levee against overflow by conducting small model experiments (levee height 0.2 m) [15]. The GRS levee is a structure in which the panel that prevents erosion during overflow is connected with the geogrid laid in the embankment soil. This geogrid exerts two effects, i.e., suppression of the panel flowing out and suppression of suction of the levee soil. The effect of the GRS levee on improving overflow resistance was confirmed. However, in the GRS levee, after the infiltration surface reached the back slope, this became unstable, and the levee broke, owing to arc slip. In addition, a large amount of the levee body material was washed away with the shifting of the panel, and levee failure occurred rapidly.
In order to reinforce resistance against overflow, infiltration, and earthquakes, Kurakami et al. [16] proposed a laminar drain reinforcement (LDR) levee, which combines the advantages of the drain method as the infiltration measure and GRS technology as the overflow measure. In the LDR levee, the drain layer is set on the back slope and connected to a concrete panel using geogrid layers. The drain layer is expected to increase the resistance against overflow erosion by lowering the phreatic surface in the levee body. In our previous work [16], only the fundamental concept of the LDR levee was illustrated, but the detailed structure and role of various materials were not shown. In our previous work, we also conducted a large-scale model test of 1 m high river levees and displayed only a small part of the experimental results. However, the detailed results, such as the erosion process of the LDR levee and the flow behavior of the concrete panels, were not indicated, and then the mechanism explaining why the LDR levee can increase the overflow resistance was not discussed. The experimental targets of the overflow tests were limited only to two cases of levees: one in which the armored levee does not have a drain layer or geogrid layers installed and the other using a LDR levee with a constant geogrid length. The influence of the drain layer and the length of the geogrids on the overflow resistance were not therefore examined in our previous work. Due to these shortcomings, we explain the basic compositions, the expected role of each material, and the detailed structure of the LDR levee in this paper. To wholly study the resistance of the LDR levees against overflow erosion, we conducted large-scale model tests of the additional two cases of levees, i.e., the LDR levee with different geogrid lengths and the GRS levee using geogrid layers without a drainage layer. In this paper, we shall show the details of the experimental results, including the erosion processes of each levee, the phreatic surface in the LDR and GRS levees, and the temporal variations of the gaps between concrete panels laid on the back slope of all levees. From these data, we examine in more detail the effects of drain layers and geogrid lengths on the resistance of the LDR levee against overflow erosion. The armored levee and the GRS levee were chosen as the existing levees with which to compare the resistance of the LDR levee against overflow erosion.
2. Concept of the LDR Levee
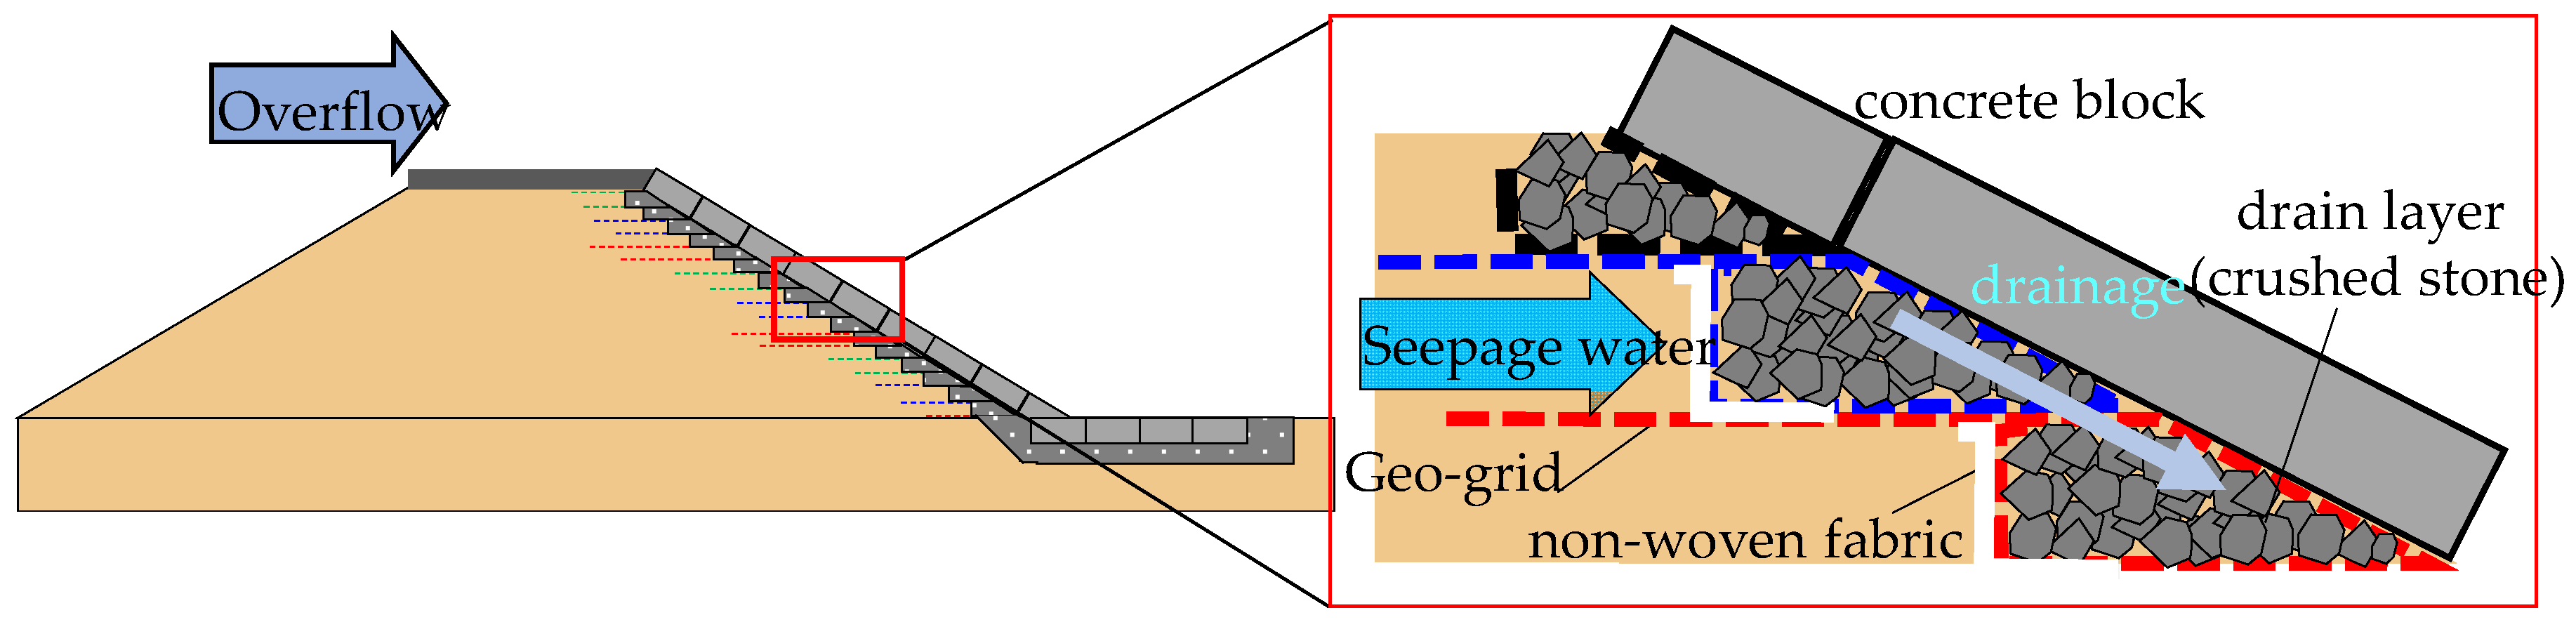
The basic composition of the LDR levee is shown in Figure 2. Geogrids are laid in the levee body and wrap around the drain material like gravel. A non-woven fabric is installed as a filter between the levee material and the drain material. The LDR levee is expected to have the following benefits:
- A laminar drainage layer composed of gravels is installed between the concrete panel and the back slope of the levee body. This drainage structure lowers the phreatic surface inside the levee and stabilizes the panel covering the back slope;
- The laminar drainage layer installed on the back slope could work as ventilation. When air blow occurs, air can be discharged from the laminar drainage layer as a countermeasure;
- Integrating the concrete panel and the laminar drainage layer in the form of the geogrid laid inside the levee prevents the concrete panel from flowing out;
- The non-woven fabric installed as the filter between the levee body and the drainage layer contributes to prevent suction of the levee material.
3. Outline of the Overflow Experiment
3.1. The Experimental Channel
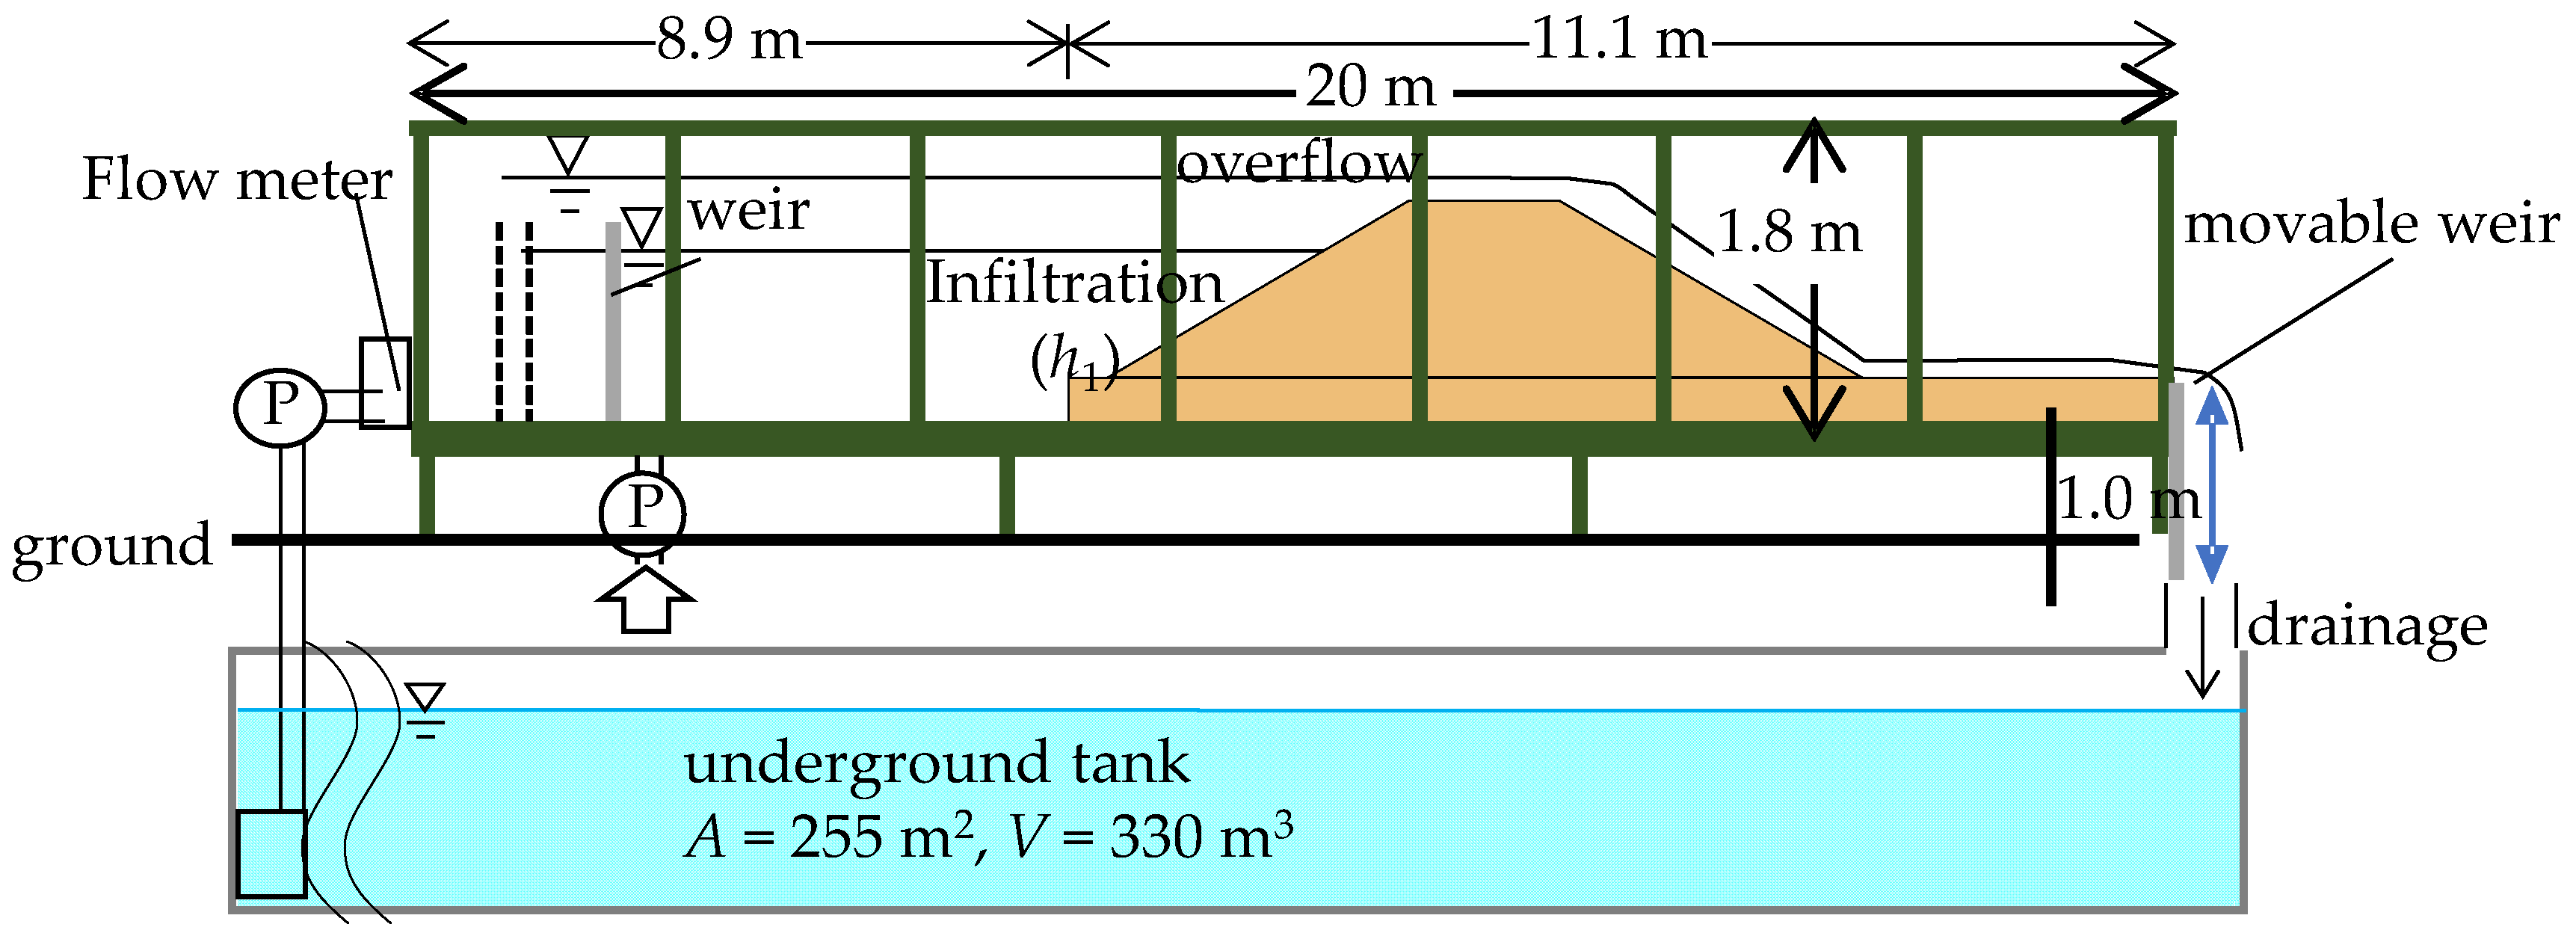
For the full-scale model test, conducted in 2015, a large, horizontal open channel made by Maruto Seisakusho Co. Ltd. was introduced to gauge the safety of the river levee against flooding and to study measures to reinforce the levee. The dimensions of the channel were 20 m in length, 1.0 m in width, and 1.8 m in height, as shown in Figure 3. Tempered glass was installed on the side wall in a range of 10 m. The conditions of flow and the model levee can be seen in the figure from the side. Three rectification plates with punched metal were installed at the upstream section to suppress the disturbance of water flow from the pump and to obtain a stable water flow. Two large pumps with capacity of 0.26 m3/s in total were installed. The flow rate was adjusted with a valve, and data from the flow meter was checked (MagneWTM 3000 FLEX, Azbil Co. Ltd., Tokyo, Japan). In addition, a movable weir was installed at the downstream end, which could be arbitrarily adjusted to a water depth up to 1.0 m.
3.2. The Model Levees
The model levees were installed so that the toe of the front slope would be positioned 8.9 m from the upstream of the channel, as shown in Figure 3. In all test cases, the model (1.0 m in height, 1.0 m in crest width, 1:2 front:back slope gradient) was made on a 0.3 m thick foundation ground. The model scale λ was 1/4, assuming that the actual levee height was 4 m in line with the levee failure of the Kinugawa River in 2015 [17]. The concrete panels were numbered 1 to 9 sequentially from the toe of the back slope.
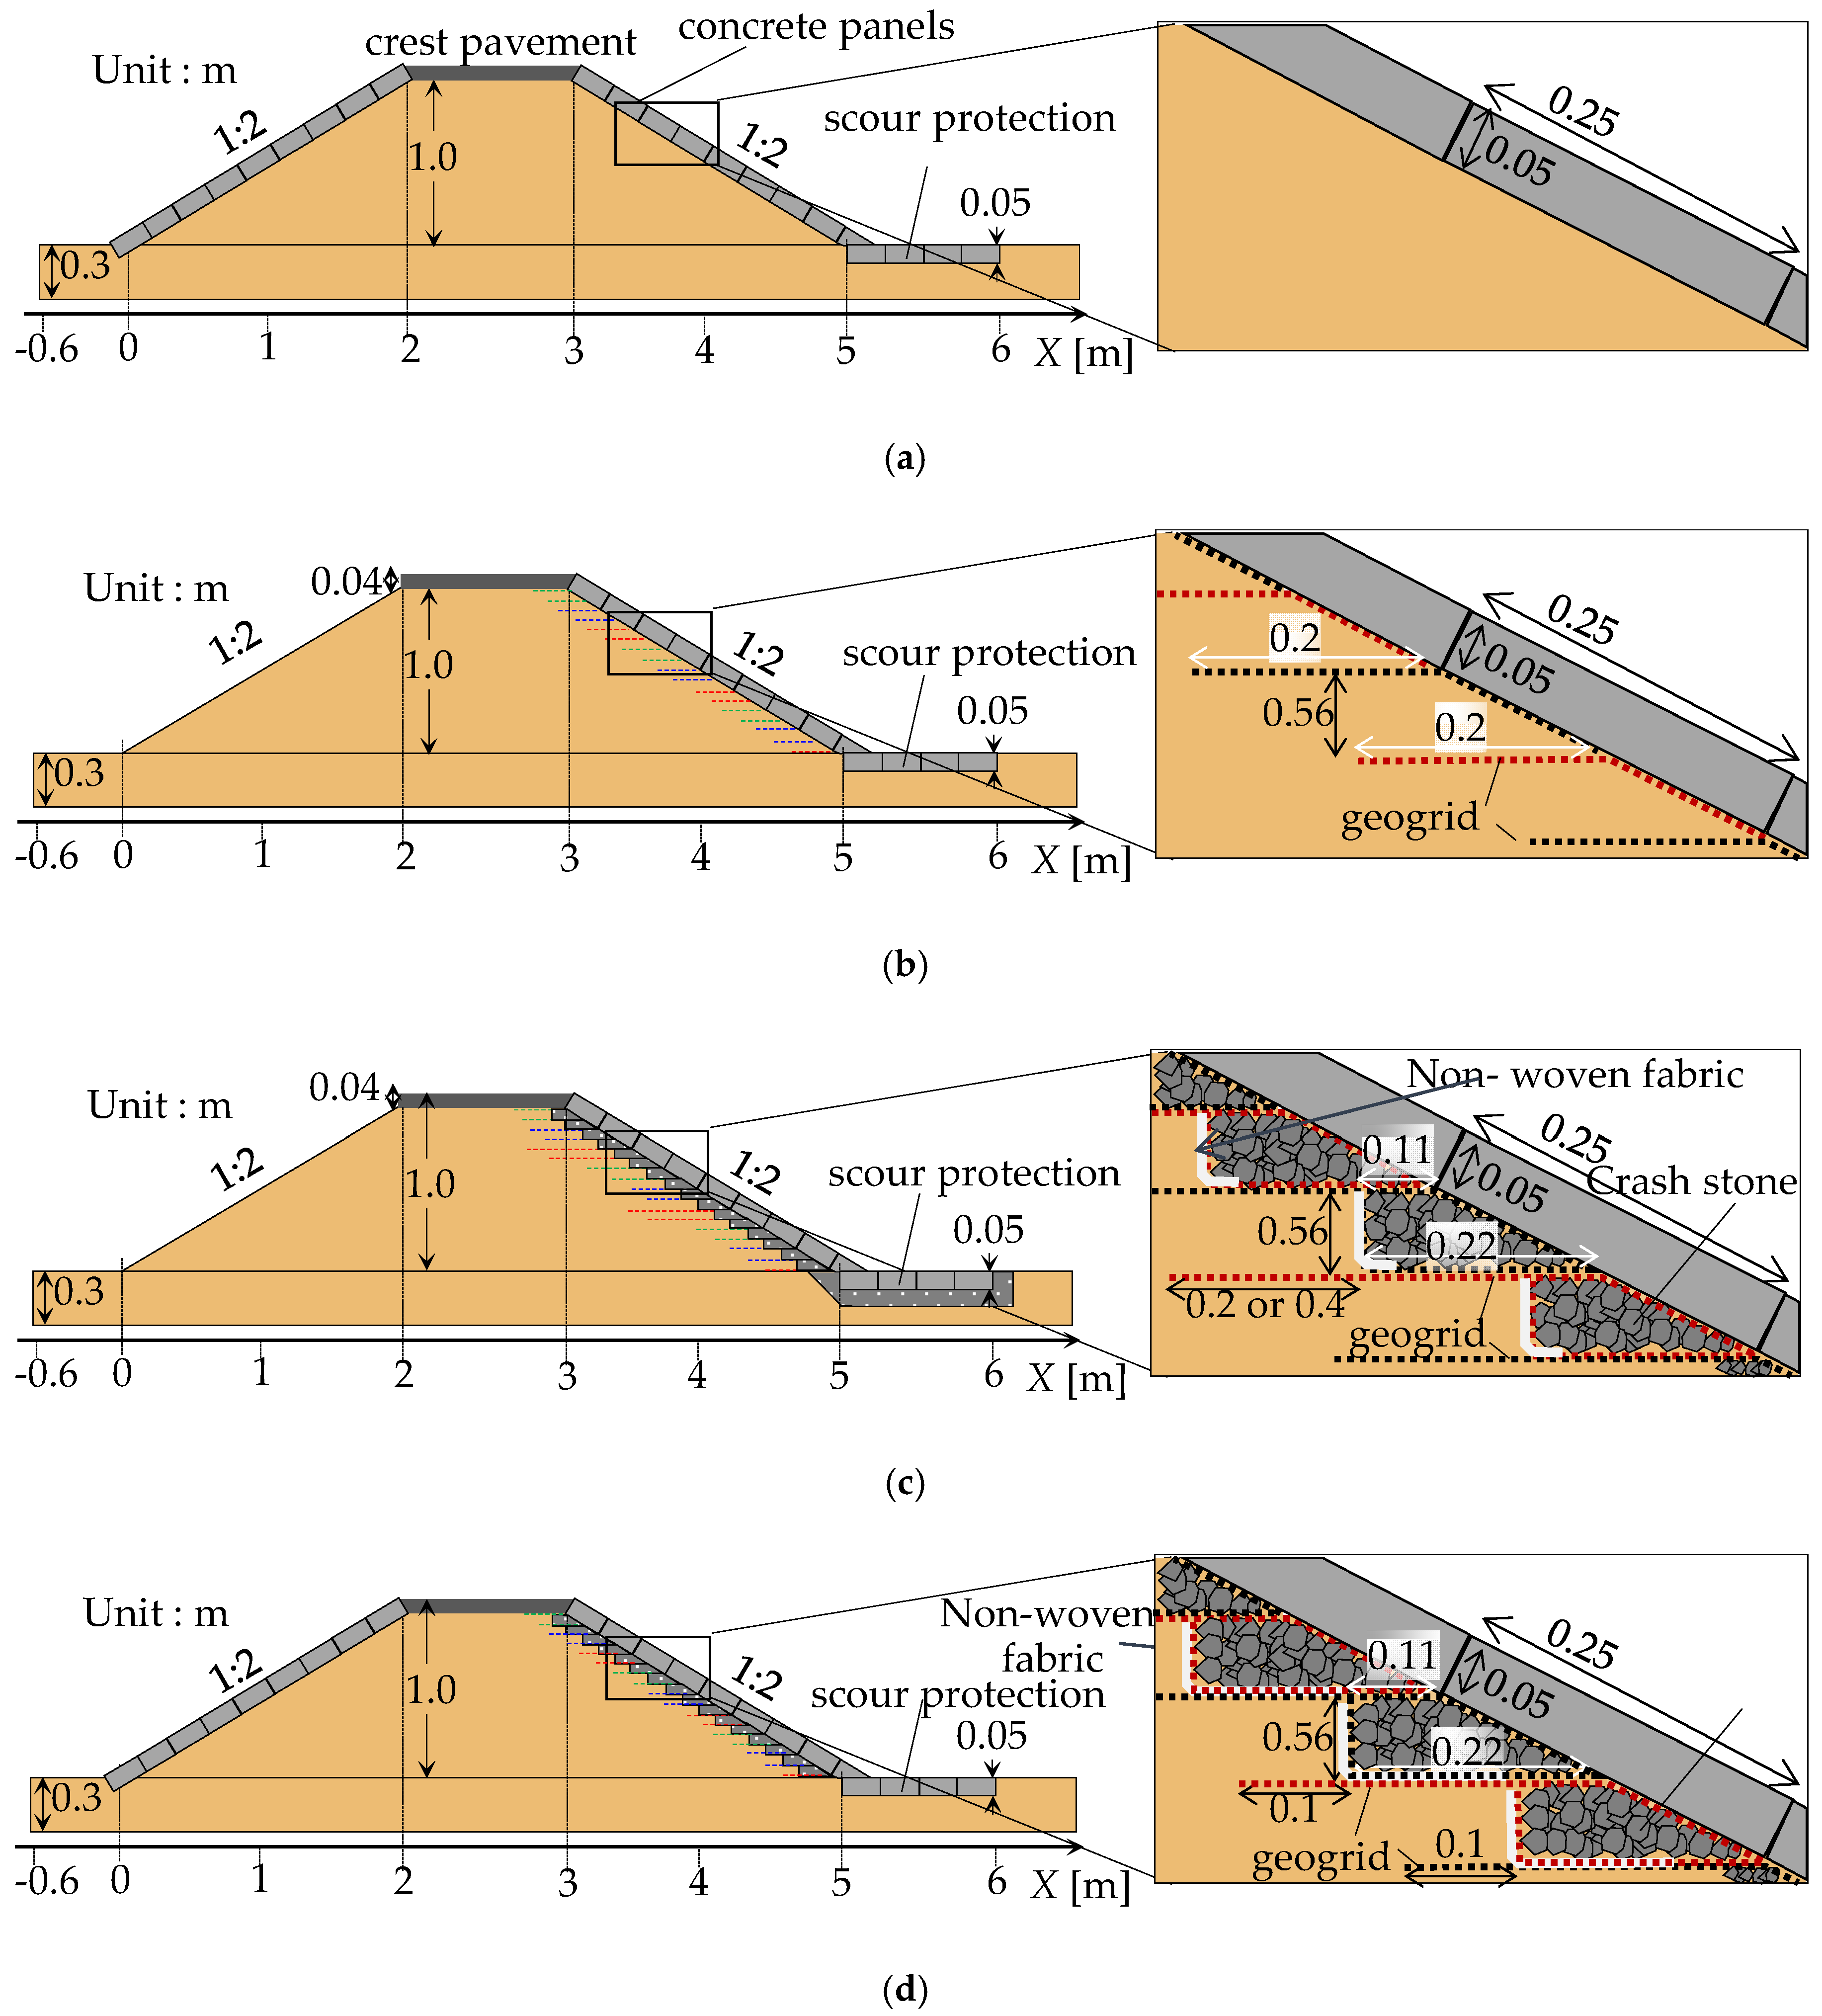
Table 1 and Figure 4 show four types of levee models: the armored levee with concrete panel on the back slope of the levee (Case A), the GRS levee with a 0.2 m long geogrid (Case B), an LDR levee with a 0.2 m long geogrid (Case C) and an LDR levee with a 0.1 m long geogrid (Case D). In the actual situation, river water infiltrates from the front side of the levee before the occurrence of overflow. For this, in Cases B and C conducted in 2016, infiltration tests were run before the overflow test, and infiltration behavior was also observed. However, in Cases A and D conducted in 2015, the overflow tests were carried out without infiltration tests because the weir in the upstream region that was used in the infiltration tests was not installed until 2016. As preliminary tests, we executed the overflow tests of earthen levees with and without infiltration tests. The results of the latter are displayed in Kurakami’s work [16]. The results show that the breach times for earthen levees with and without infiltration tests were 2.3 min and 2.5 min, respectively. It was therefore confirmed that infiltration before the occurrence of overflow would not have a significant influence on overflow erosion. In Cases B and C, water level gauges (HOBO-U20, Onset Co. Ltd., MA, USA) and pore water pressure gauges (BPB-A-200KP, Kyowa Electronic Instruments Co. Ltd., Tokyo, Japan) were used.
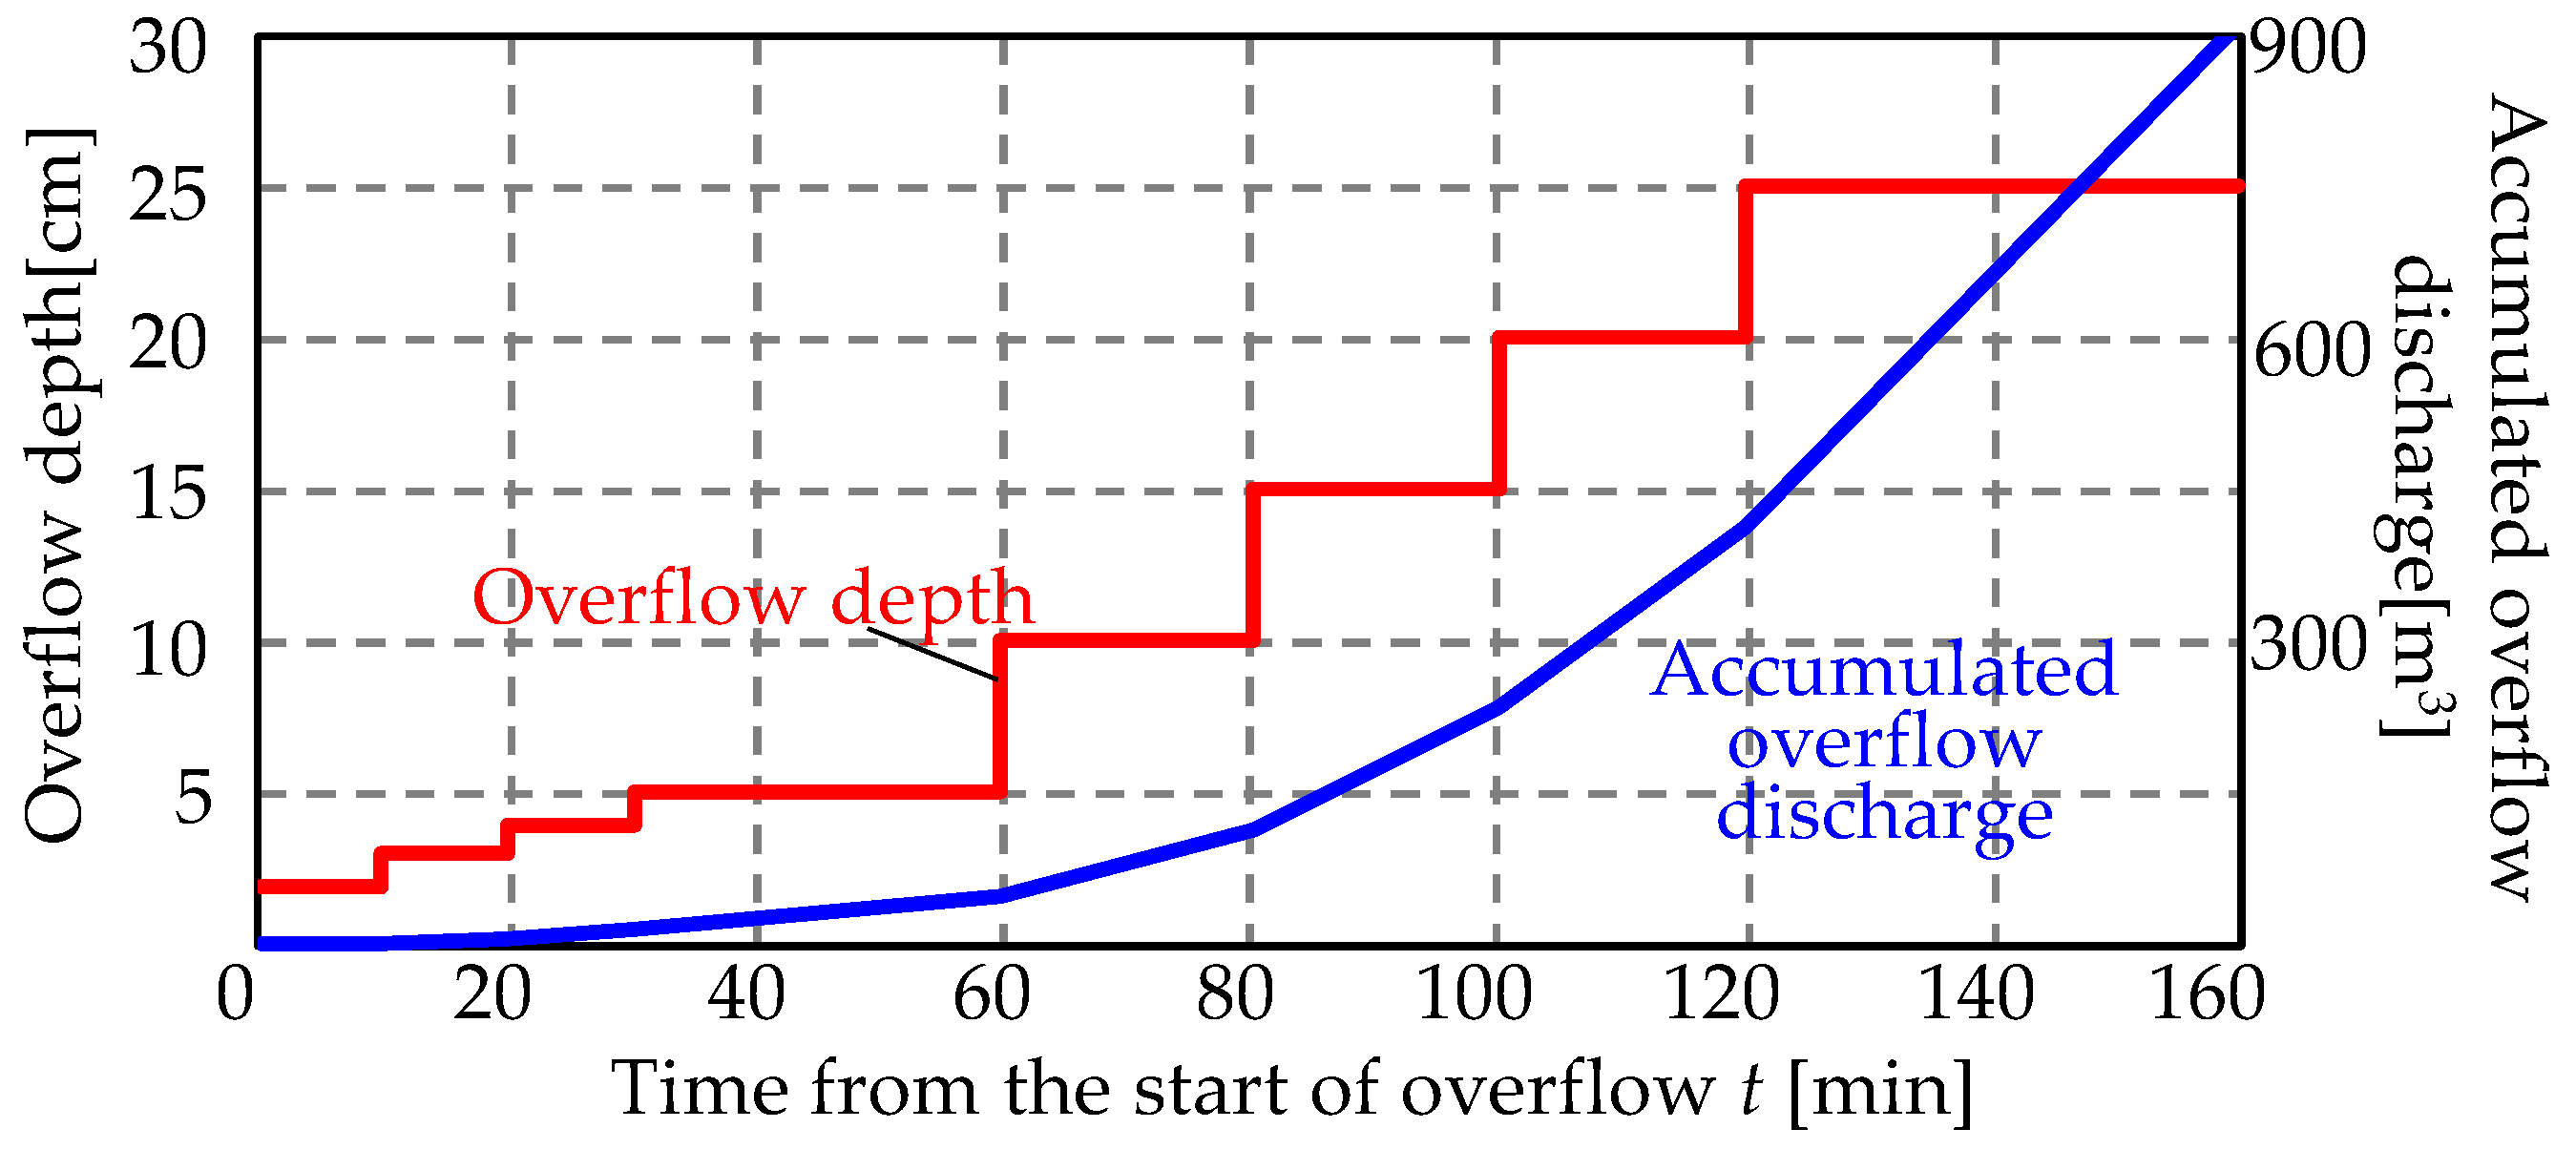
In this study, the time series of overflow depth h was set to increase gradually with elapsed time from the start of overflow t shown in Figure 5. These test conditions of overflow time and depth were basically set on the basis of the levee failure of the Kinugawa River in 2015 [17], when overflow time was about 2 h and the overflow depth was 20 cm until the collapse of the levee. According to Froude’s similarity, the time scale is 1/2 when λ = 1/4. In this case, the overflow time (120 min) on the prototype scale corresponded to 60 min on the model scale. From this, the overflow depth was 5 cm at t = 60 min. After t = 60 min, overflow depth was set to be more than 5 cm, assuming that the flooding scale in the overflow tests was larger than that of the Kunugawa River in 2015. After t = 120 min, overflow depth became constant at h = 25 cm, which was its maximum.
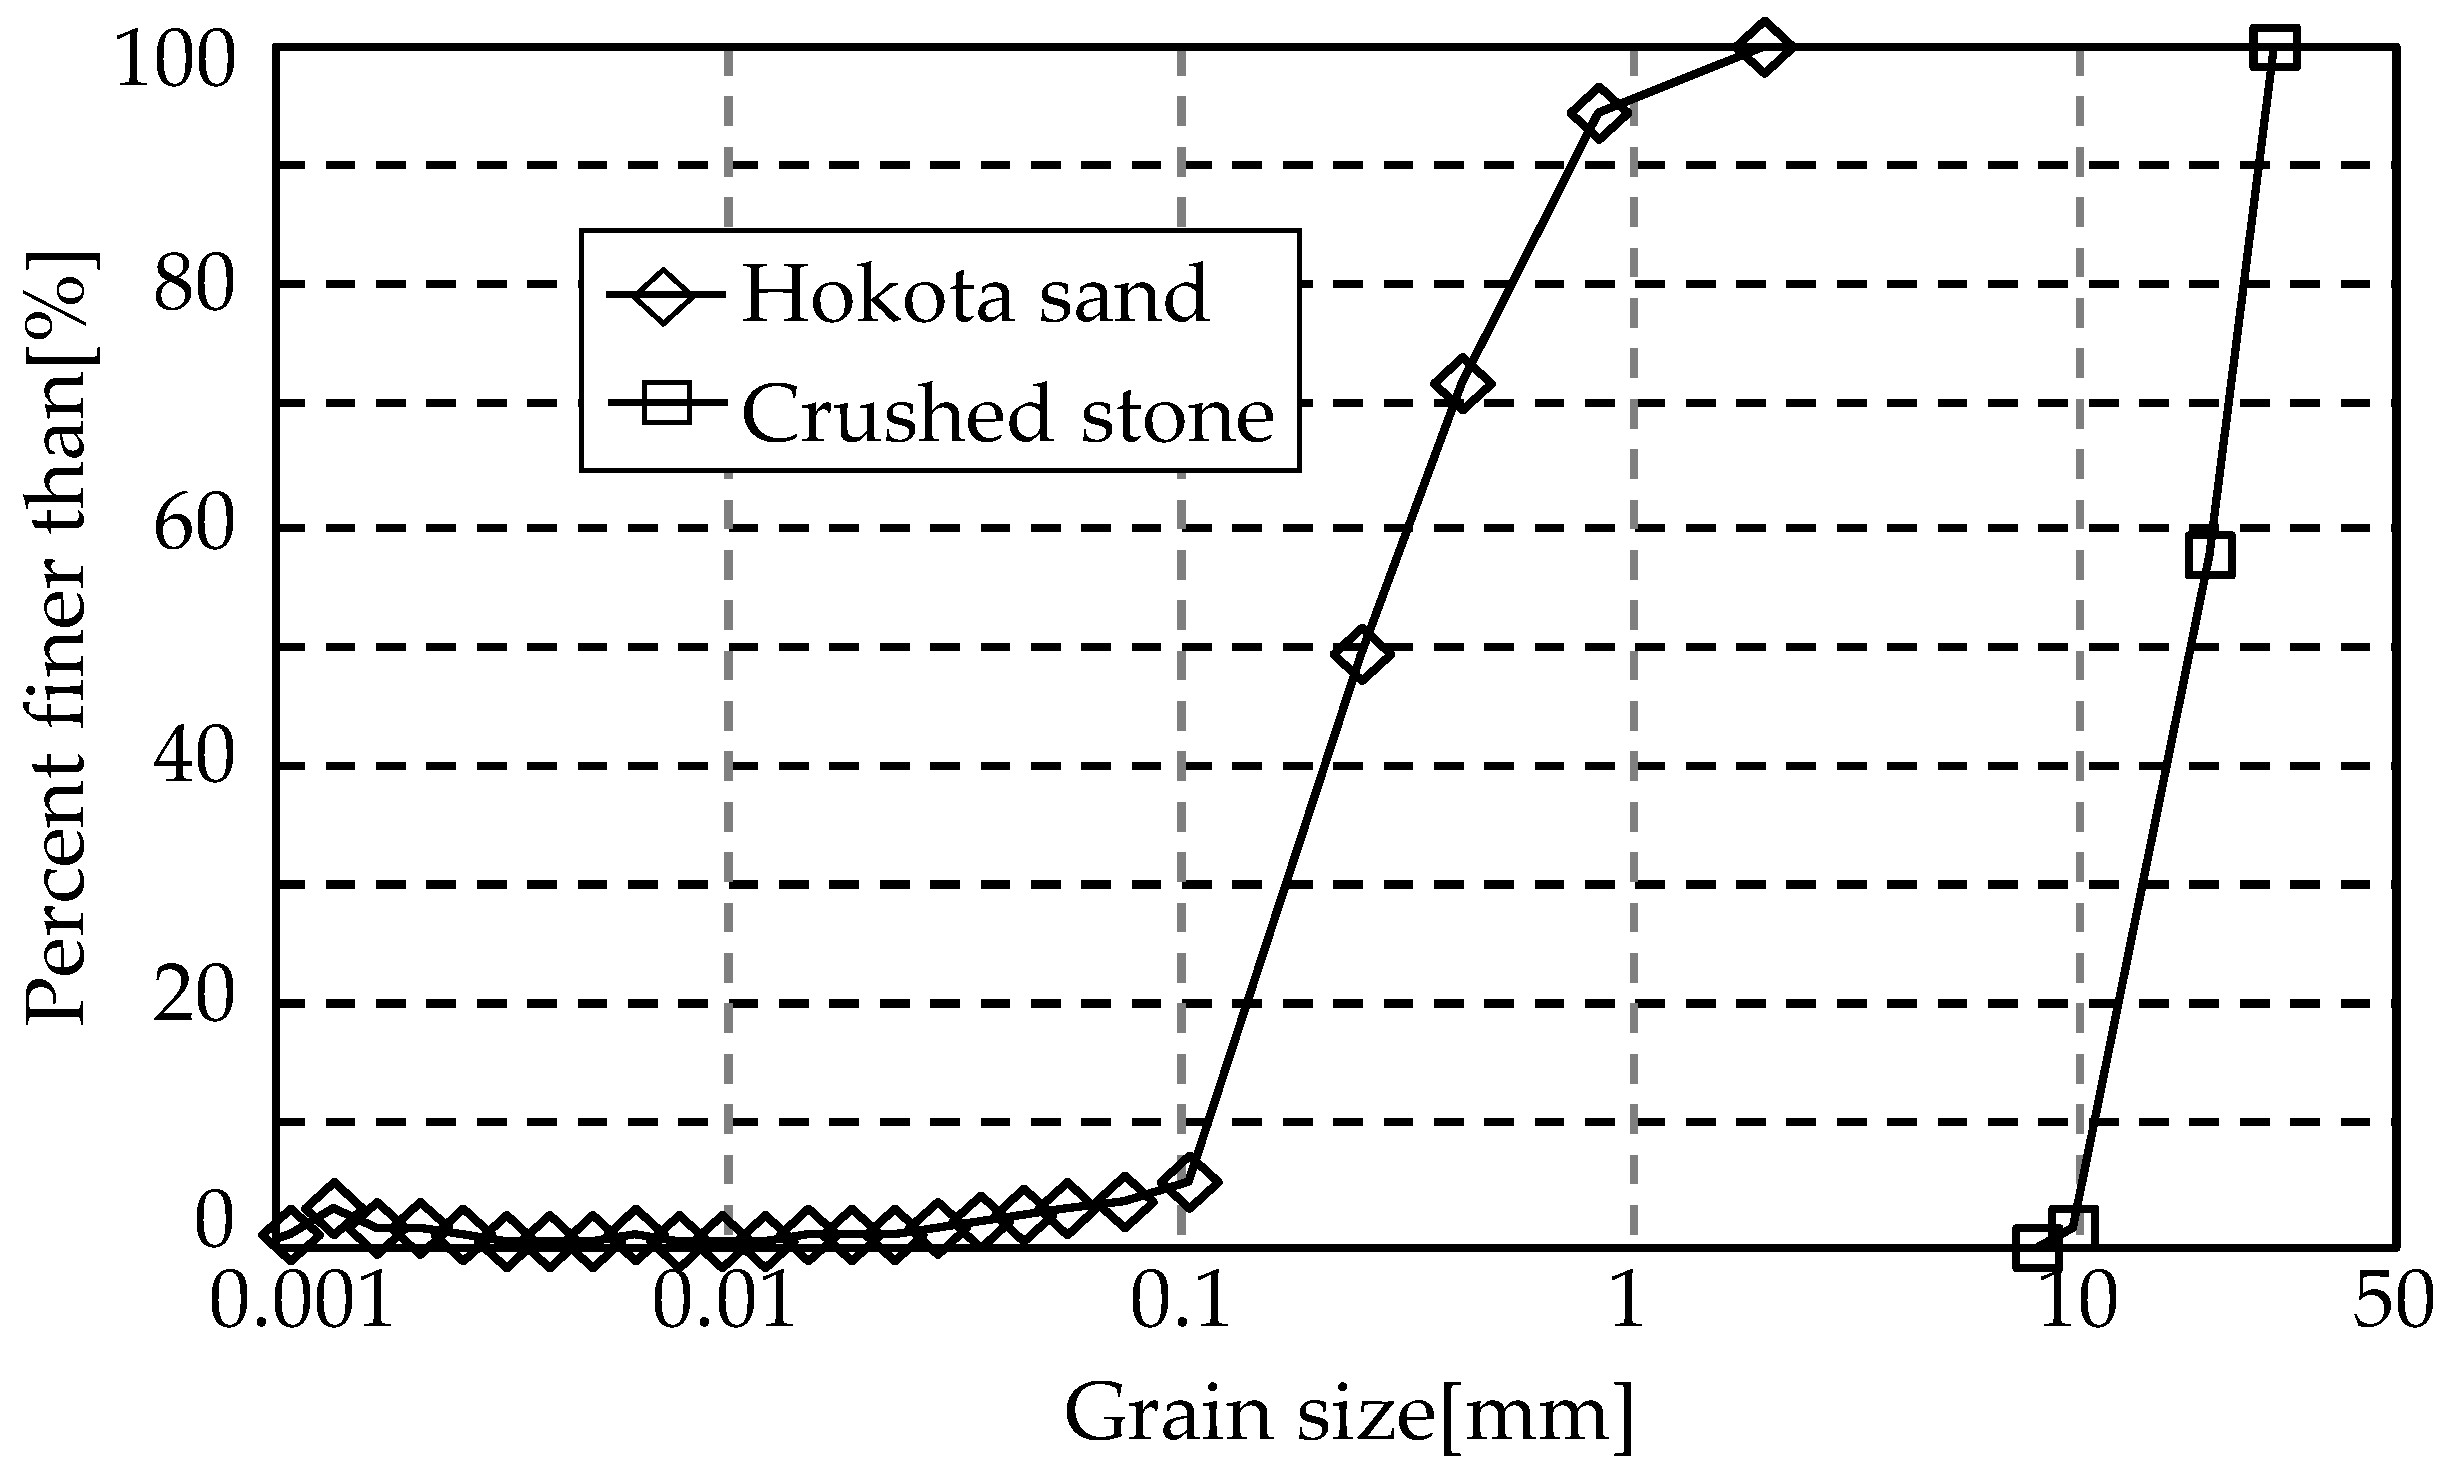
The model levee body was made of Hokota sand (D50 = 0.22 mm; fine sand content Fc = 8.4%; maximum dry density ρd = 1.72 g/cm3; optimum water content wopt = 13.5%, water permeability coefficient k = 2.0 × 10⁻³ cm/s with standard Proctor compaction energy, Figure 6). It was compacted using a 46-kg plate compactor (MVC-40GB, Mikasa Sangyo Co. Ltd., Tokyo, Japan). The degree of compaction Dc was 90%, and water content was the optimum content, each layer having a thickness of 0.056 m. The geometrical standard deviation of grain size distribution ((D84/D16)1/2) was 2.17 in the Hokota sand, showing that the Hokota sand used in the levee materials was not uniform. The erosion features of the dike-breach process are adequately simulated by uniform sediment [18,19]. To avoid the effects of apparent cohesion, levee materials with diameters of more than 1 mm should be used [20]. It was however quite difficult to use a sediment with a uniform diameter of >1 mm in terms of cost since the volume of the model levee was more than 10 m3. In addition, the levee material which suffered from failure in the Kinugawa River in 2015 was mainly medium sand with a median diameter of 0.2–0.4 mm. Due to scale similarity, the median diameter of the model levee should be 0.05–0.1 mm when λ = 1/4. This range of the median diameter includes mostly fine sand, which includes cohesive materials. It was therefore necessary to select a levee material with a low ratio of fine sand, with small median diameter in line with the scale similarity, and low cost even in large quantities. For the levee material, we therefore selected the Hokota sand in which Fc was low (8.4%) and the medium diameter was small (0.2 mm).
Asphalt with a thickness of 0.04 m (Asphalt V, Kateikagaku Co. Ltd., Osaka, Japan) was paved at the crest of the levee. Concrete panels (0.25 m in width, 0.25 m in length, 0.05 m in thickness, density = 2.4 g/cm3) were used to cover the surface of the levee. Nine panels were laid in the slope direction and four in the cross direction. The same panels were used for scour protection, and these were laid on the foundation in lengths of 1 m (four panels in the flow direction). In Cases B, C, and D, the geogrid with a 10 mm square opening (Maeda Kosen Co. Ltd., Fukui, Japan, maximum of tensile strength Tmax = 40.0 kN/m, aperture ratio Ap = 67.6%) was placed at the back. The opening size of the geogrid used in the real scale is generally 30–60 mm maximum, making the geogrid in the model scale between 7.5–15 mm when λ = 1/4. Hence, we selected a 10 mm opening in the tests. In Cases B and C, its length L was 0.20 m, but panels 4 and 7 in Case C had a length of 0.40 m. In Case D, L = 0.10 m. On each panel, two geogrid layers were connected. In Cases C and D (LDR levee), backfill material (D50 = 17.2 mm) was used as a drainage layer, and a thin non-woven fabric of weather-resistant reinforced polypropylene material was used as a filter between the levee body and the drainage layer. Backfill material is generally determined to keep high permeability in a drainage layer. In this case, the permeability coefficient k of the drainage layer was 1.0 × 10⁻¹ cm/s, obtained by osmotic flow analysis. It corresponds to a general criterion that the permeability of the drainage layer is two orders larger than that of levee materials. In Cases B, C, and D, the scour protections were also connected with geogrids. Oily clay was used for joint material between the concrete panels. The longer laying length of the geogrid L works more effectively to suppress the flowing out of the concrete panel. On the other hand, the longer laying length of the geogrid makes construction difficult. Therefore, the laying length of the geogrid must be as short as possible. The required length of the geogrid for the gravity of concrete panels was calculated as L = 9 cm. Thus, L = 10 cm (Case D) and L = 20 cm (Case C) were adopted in this study.
It should be noted that a repeatability test is an important experiment performed to control the accuracy of measurements and to evaluate how repeatable the results are under a set of similar conditions. However, all cases in the present experiment were done only once. The main reason for this is that it takes a lot of money and labor to perform the experiment with 1 m high model levees. Furthermore, the preliminary tests for the earthen levees were conducted in the two cases mentioned above. The results show that the breach times in both the earthen levees were almost the same, even though the infiltration condition was not the same. In any case, it is necessary to conduct repeatability tests for the armored, GRS, and LDR levees as future work.
4. Results and Discussion
4.1. Time Series of the Residual Rates of the Cross-Sectional Area and Height for All Cases
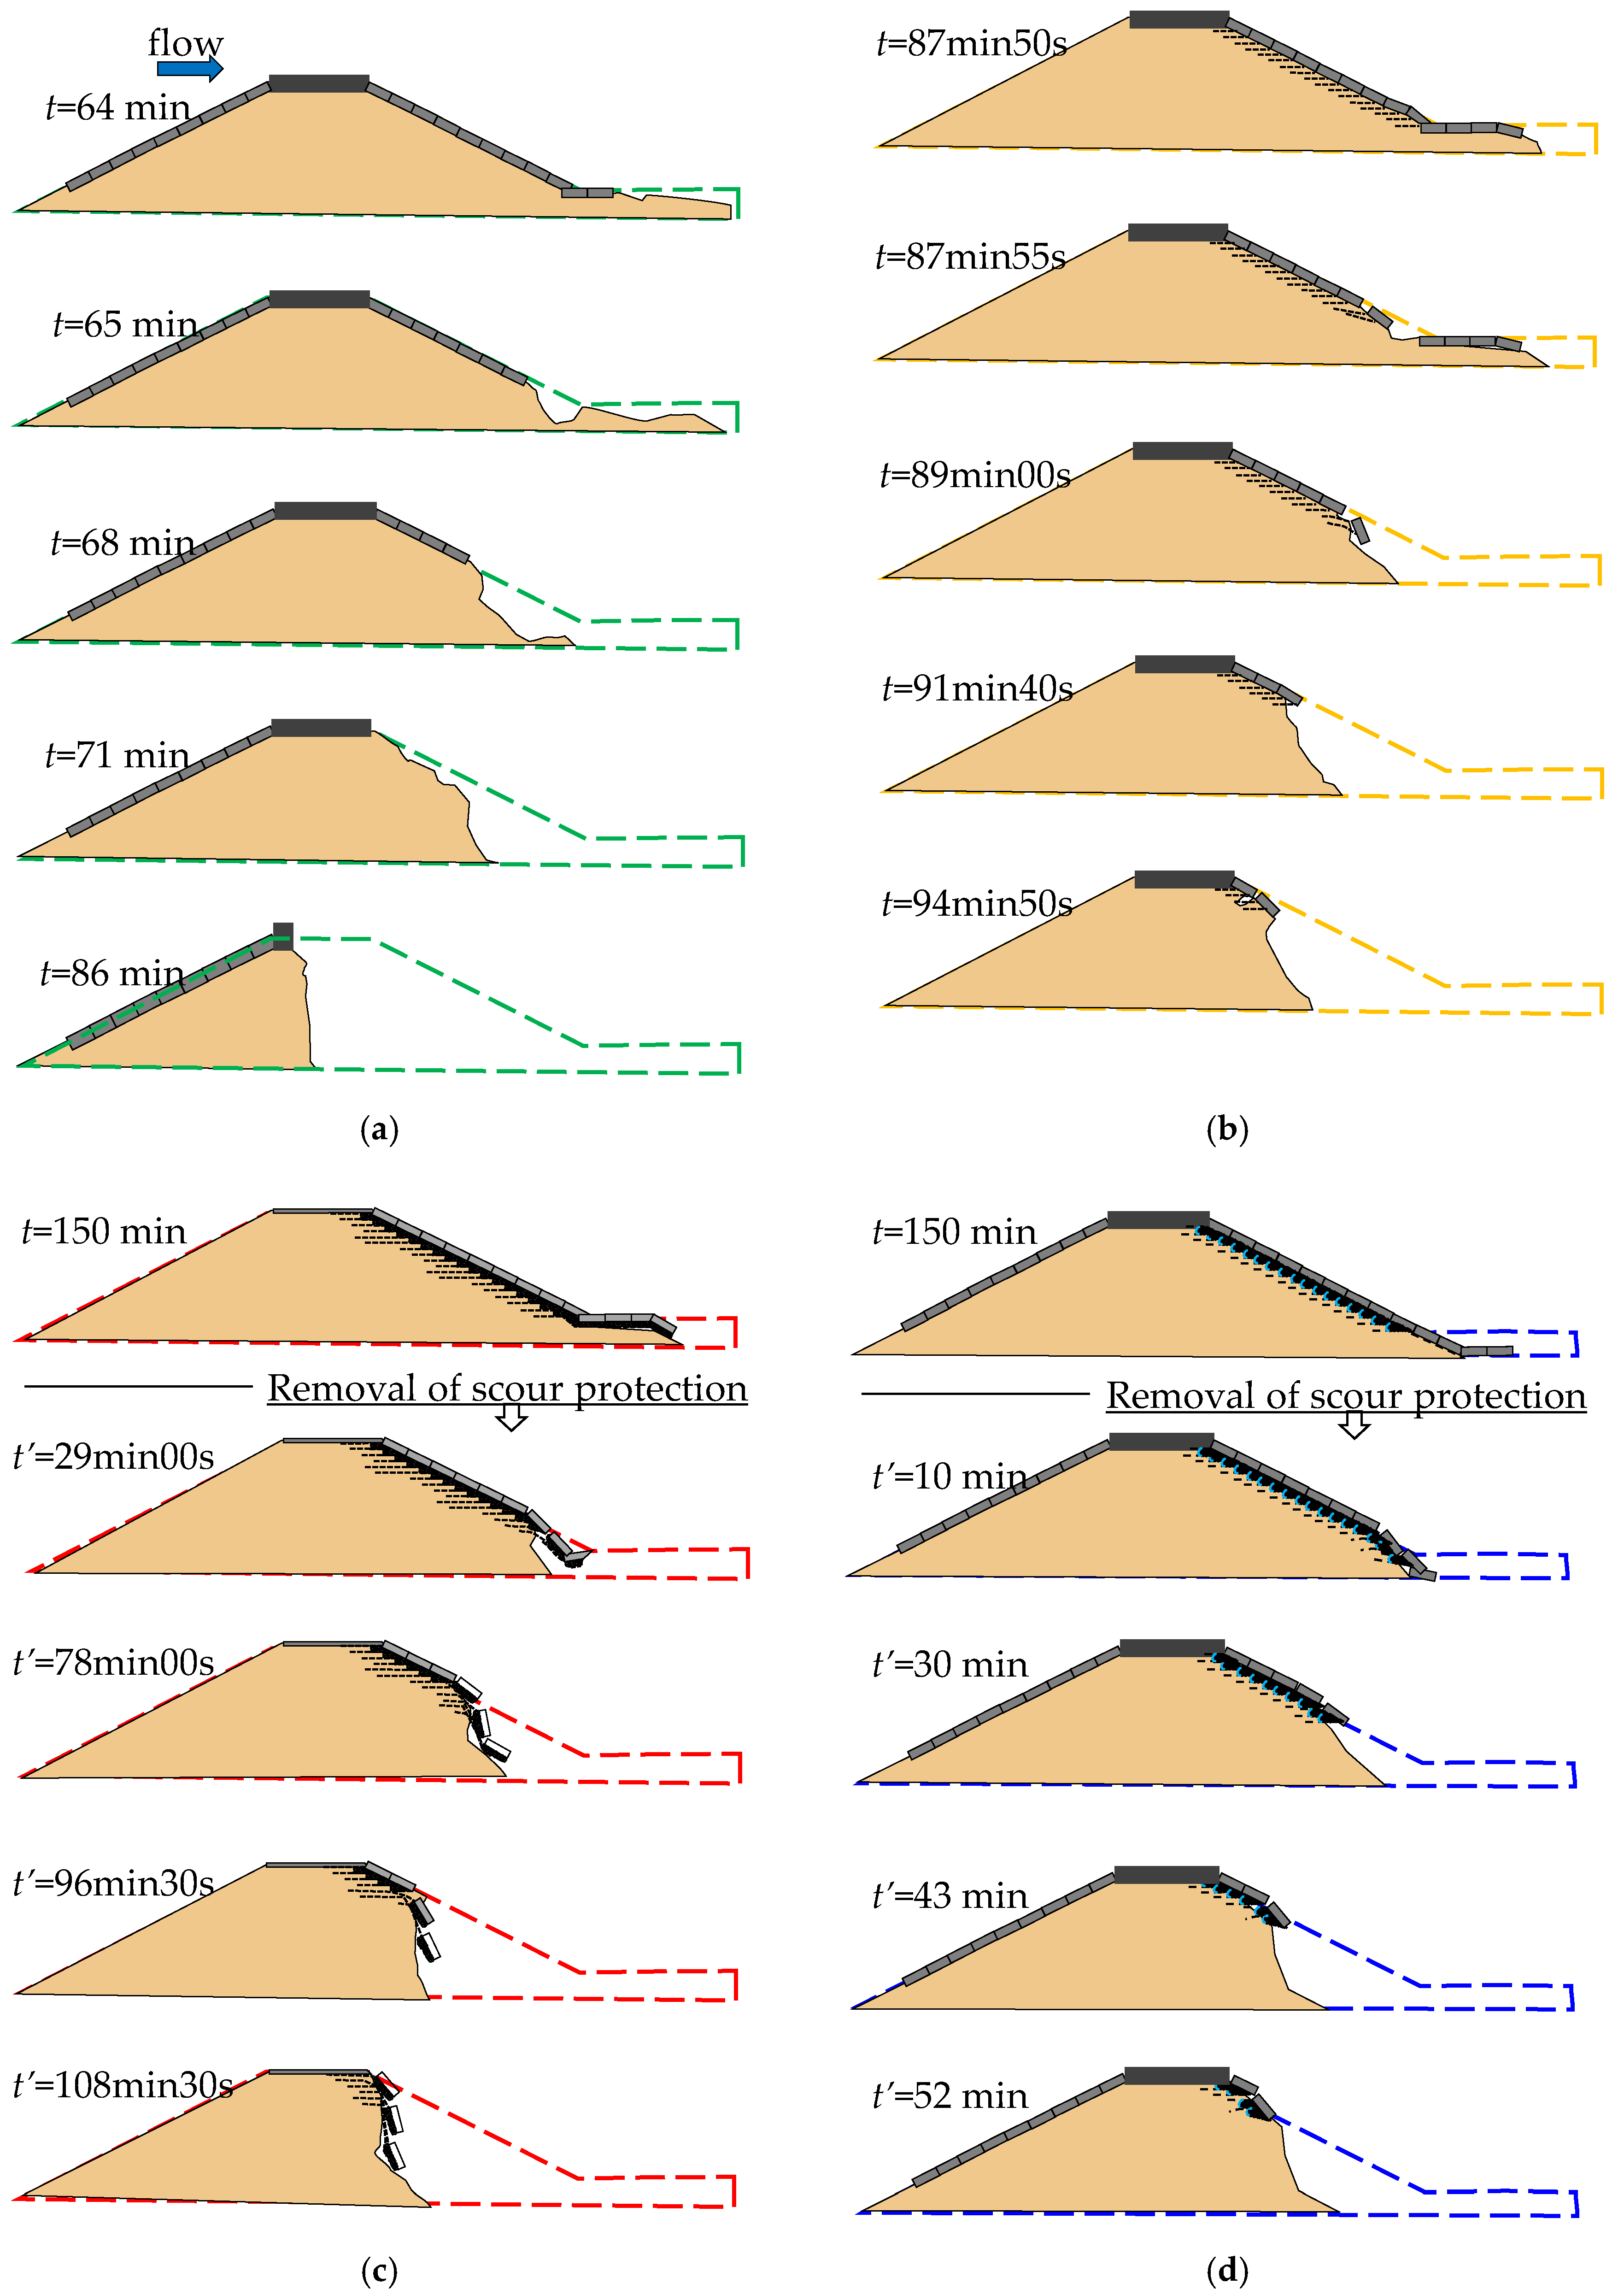
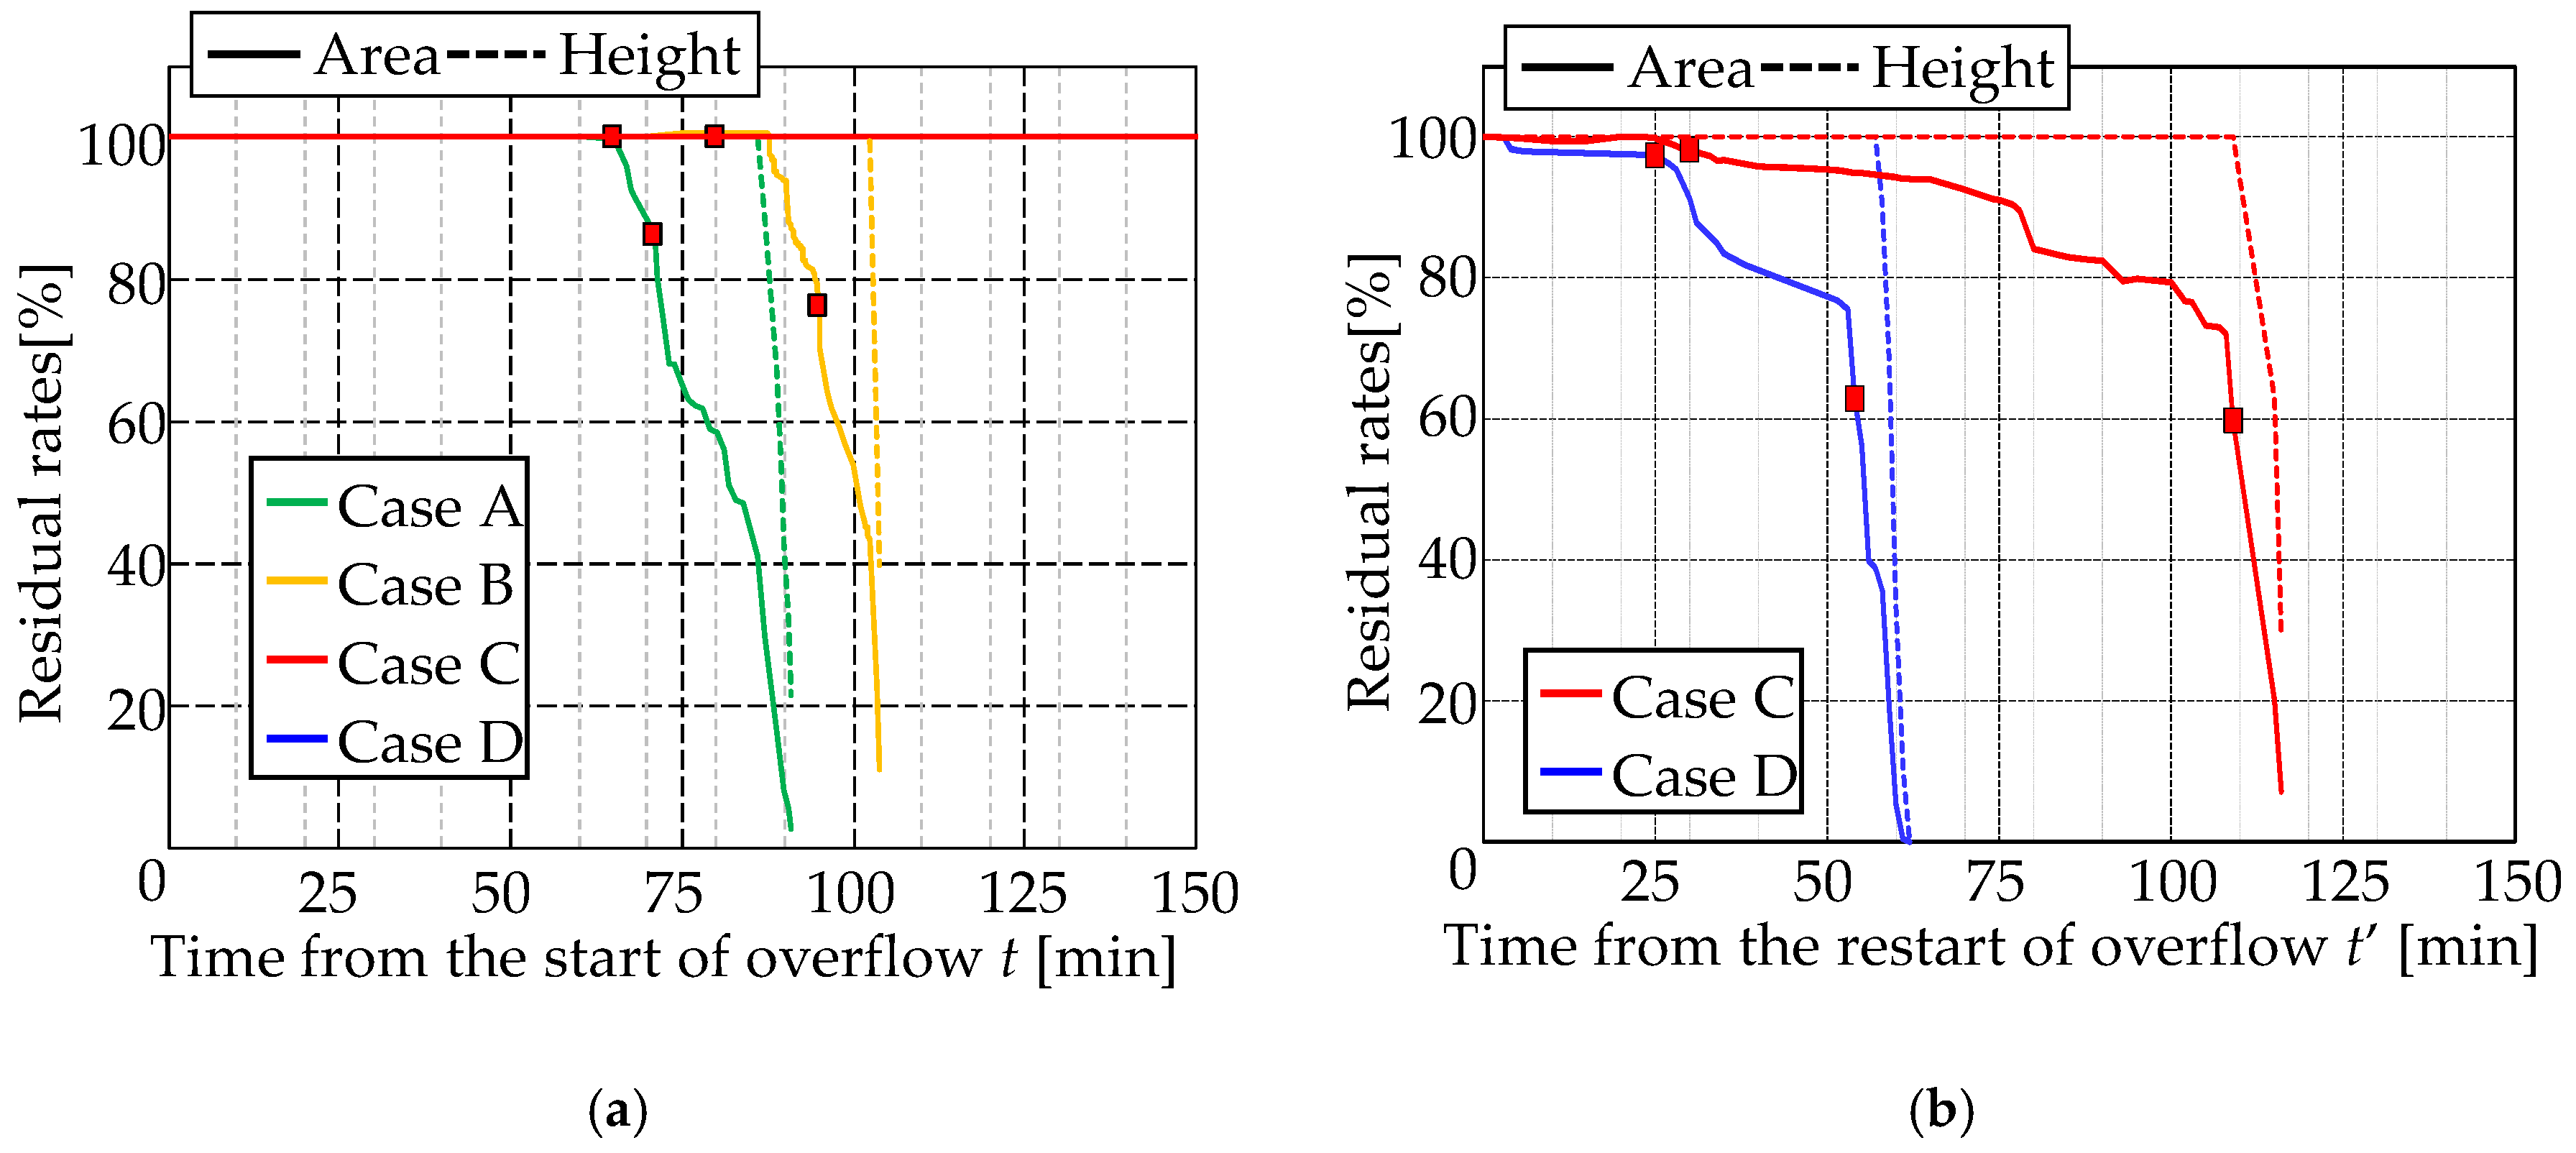
Figure 7 and Figure 8 show the temporal variations of the cross-sectional shapes of the levees and the residual rates for the cross-sectional area and the crest height for all cases, respectively, in order to assess the erosion process. The residual rate of the cross-sectional area and crest height were evaluated with cross-sectional area and crest height at any time, divided by the initial values. The residual rates in Cases C and D were almost 100%, as shown below. In Figure 8a, it should be noted that the lines for the residual rates of area and height in Case D and of height in Case C overlapped that of the area in Case C. The square marks in Figure 8 indicate the times of the start and end of the time when the concrete panels of the back slope were flowed out. In Case A (armored levee), concrete panels laid on the front and back slope of the levee and foundation ground suppressed the erosion of the surface and the foundation ground of the levee. The residual rates for the cross-sectional area and the height remained almost 100% until t = 64 min. After t = 64 min, the scour protection at the toe of the back slope was flowed out, and then the concrete panels 1 and 2 were flowed out at t = 65 min. In the armored levee, once the concrete panel was flowed out, the other concrete panels were flowed out one after another. After 7 min (t = 71 min) from the time when the concrete panel of back slope began to be flowed out, all the concrete panels on the back slope were flowed out, and the residual rates of the cross-sectional area decreased to 86%. Some 15 min after that (t = 71.5–86 min), the residual rates of the cross-sectional area were halved, from 80% to 41%. In the meantime, there was no concrete panel on the back slope, and the erosion was suppressed by the eaves effect of the crest pavement. At this point, the residual rates of the levee height were maintained at 100%. However, after that, the levee collapsed at t = 87 min.
In Case B (GRS levee), in which the geogrid was laid in the levee and connected to the concrete panels, the residual rates for the cross-sectional area maintained 100% until about t = 87 min. However, at t = 87 min 50 s, the concrete panels of Nos. 1 and 2 expanded downward and, 5 s later, were flowed out. After that, the concrete panels on the back slope gradually flowed out from the bottom. Since the concrete panels were connected to the geogrid, the concrete panels resisted to some extent, even after displacement. At t = 94 min 50 s, the concrete panels of No. 7 flowed out, and the concrete panels of Nos. 8 and 9 also began to be displaced. At t = 95 min 04 s, all concrete panels on the back slope had been flowed out, and residual rates for the cross-sectional area decreased to 73%. The levee finally collapsed at t = 102 min.
On the other hand, in the LDR levees (Cases C and D), the levee body did not erode even at t = 150 min after the start of the overflow, and residual rates for the cross-sectional area and the crest height were maintained at 100%. Even at the maximum overflow water depth of h = 25 cm in this experiment, only the lower part of the scour protection was eroded, and the initial shape of the cross-sectional area of the levee was maintained. In Case B (GRS levee), despite the installation of scour protection, the concrete panels were flowed out from the toe of the back slope. On the other hand, in Case C, in which the drain layer was placed, the levee body maintained its initial state even after t = 150 min. Such results include the effect of the scour protection.
Therefore, we stopped water running at once and restarted the experiment after removal of all the scour protections. The time from the restart of overflow experiment is indicated as t’ in Figure 7 and Figure 8. In Case C, where the laying length of the geogrid in the levee body was L = 0.2 m, the toe of the back slope was eroded at t’ = 29 min, but the concrete panels of Nos. 1 and 2 did not be flowed out. The concrete panels were displaced as to cover the levee body, and the erosion of the levee body was also suppressed. At t’ = 78 min, the concrete panels of Nos. 1, 2, and 3 flowed out. Although the erosion state of the toe of the back slope was steep, the concrete panels of Nos. 4 and 5 were displaced so as to cover the eroded levee body, as shown in Figure 7. However, as the erosion of the levee body progressed slightly, the concrete panels were also flowed out. At t’ = 109 min, all concrete panels on the back slope were flowed out. The residual rates for the cross-sectional area at this time were 60%. In Case D, in which the laying length of the geogrid in the levee body was 0.1 m, erosion started from the toe of the back slope at about t’ = 10 min and displacement of the concrete panels occurred. The flowing out of the concrete panels of the back slope started from t’ = 27 min, and the residual rates for the cross-sectional area decreased, sharply at first, to 89%, and then decreased more gradually (to 62%). At t’ = 30 min, concrete panels of Nos. 1, 2, 3, and 4 flowed out and the concrete panel of No. 5, though displaced, did not be flowed out. In this case, finally, all concrete panels of the back slope were flowed out at t’ = 54 min, and the residual rate for the cross-sectional area at that time was 62%. In Case A, the residual rate for the cross-sectional area at the time when all concrete panels had flowed out was 80%. This means that in Cases C and D, the geogrid layers integrating the concrete panels and levee material have an important role to increase the resistance against overflow erosion. In all cases, whether with or without concrete panels and infiltration experiments, the model levees were eroded from the back slope, not from the front.
From these results, the time to failure was 87 min for the armored levee and 102 min for the GRS levee. This means that the geogrid laid in the GRS levee can increase the resistance of the concrete panels on the back slope against flowing out. Furthermore, in the LDR levee (Cases C and D), the initial conditions of the LDR levee can be maintained 150 min after the start of overflow, and erosion of the levee body did not occur. The difference between the GRS and LDR levees is the installation of the drainage layer on the back slope. These facts suggest that the drainage layer is an important factor to reinforce the levee against overflow erosion.
4.2. Phreatic Surface at the Time of Overflow
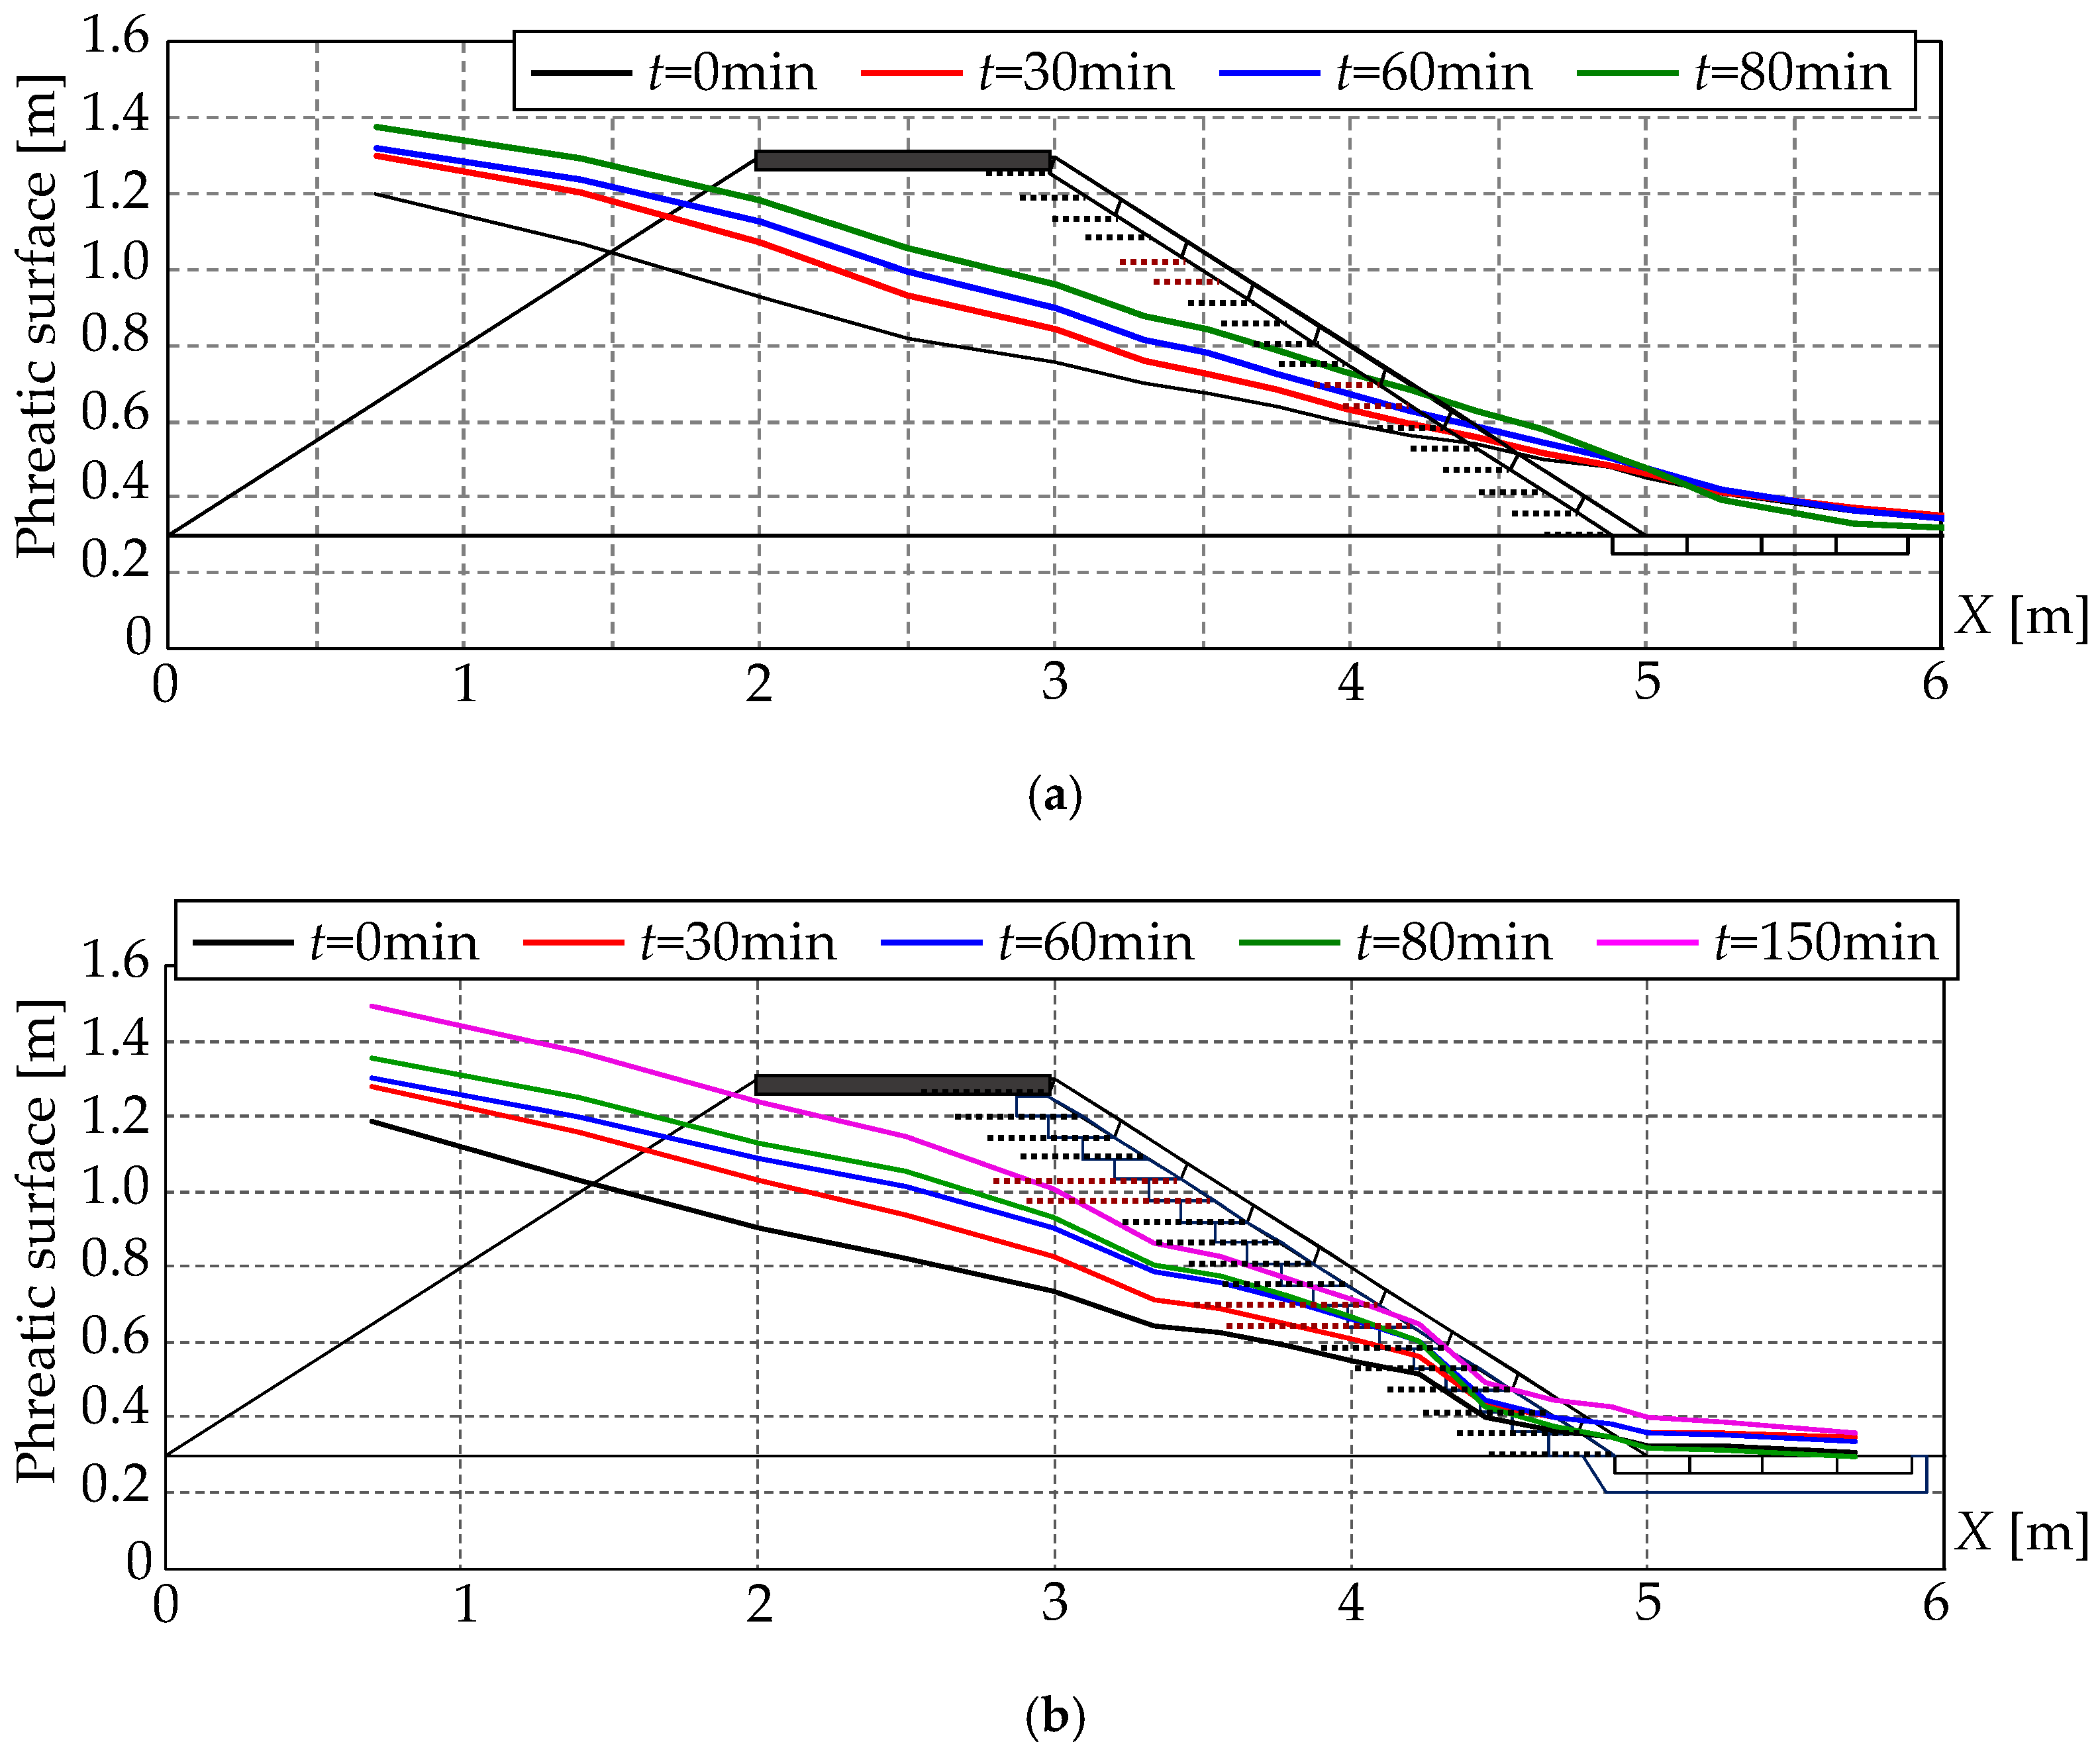
Although the GRS levee and LDR levee were installed with concrete panels connected by a geogrid, the process of flowing out of concrete panels was appreciably different. In order to verify this difference, Figure 9 shows the height of the phreatic surface in the levee at the time of the overflow. Here, the results of Case B (GRS levee) and Case C (LDR levee) are shown. First, in the GRS levee, the phreatic surface at the back slope had already reached the concrete panel of No. 3 at t = 0 min. After that, the phreatic surface gradually rose. In the GRS levee, concrete panels of Nos. 1 and 2 were flowed out, despite the fact that the scour protections were displaced. It is considered that this was due to the lift pressure acting on the concrete panels of Nos. 1 and 2 and that the pullout resistance of the geogrid layer decreased owing to the infiltration over the levee body.
On the other hand, in the LDR levee (Case C), the laminar drain layer laid on the back slope lowered the phreatic surface, even at the overflows. This suggests that the laminar drain layer in the LDR levee greatly contributes to the stabilization of the back slope, thanks to the reduction of the phreatic surface during overflow.
4.3. Relationship between the Gap between the Concrete Panels and the Outflow Time of the Concrete Panels
As described above, in the armored levee, the concrete panels were quickly and continuously flowed out when gaps or shifting occurred between them. This phenomenon was also seen in the GRS levee. On the other hand, in the LDR levees, even after gaps or shifting occurred between the concrete panels, the concrete panels were persistently prevented from flowing out. In order to assess this fact quantitatively, Figure 10 shows the time series of the residual rates for the cross-sectional area, the outflow time of concrete panels on the back slope, and the gap between the concrete panels in all cases. The horizontal axis in the figure shows the time t from the start of the overflow in Cases A and B, and the time t’ of the overflow after removing the scour protection in Cases C and D. Also, the gap between the concrete panels means the result until the time at which the concrete panels were flowed out. In Case A (armored levee), concrete panels were flowed out without producing gaps between the concrete panels of Nos. 1–2, 2–3, 7–8, and 8–9. Therefore, this case is not illustrated in Figure 10a.
The results in Case A show that the maximum gap between the concrete panels until the flowing out of the concrete panels was 3.4 cm (concrete panels of Nos. 3–4). Four of the eight gaps between the concrete panels were almost zero, and the other three gaps were 1 cm maximum. In addition, when a gap between the concrete panels occurred, the concrete panels were flowed out within approximately 2 to 50 s. The residual rates for the cross-sectional area also decreased accordingly.
In contrast, in cases with the geogrid installed in the levee (Cases B, C, and D), the gap between the concrete panels was between 7 and 20 cm until the concrete panels were flowed out. This means that the concrete panel did not be flowed out even if a large gap occurred between the panels. However, in Case B, when a gap was generated between the concrete panels, the gap rapidly expanded, and the concrete panel was flowed out approximately 1 to 2 min after the gap was generated. On the other hand, in Cases C and D, it took 20 min and 3 min, respectively, from the occurrence of the gap to the outflow of the concrete panel, and longer than in Case B. In particular, the rate of increase of the gap between concrete panels in Case C (inclination in the figure) was significantly reduced compared to Cases B and D. The difference between Cases B, C, and D suggests that the difference in the geogrid length and the drain layer contribute to the increase of the pullout resistance of the geogrid. As described above, even if the gap between the concrete panels gradually increases, the LDR levee suppresses the rapid outflow of the panels and the decrease in residual rates for the cross-sectional area.
4.4. Influence of Laying Length of the Geogrid L
In order to understand the relationship between the outflow process of the concrete panels and the laying length of the geogrid L in more detail, we compared the gaps between the concrete panels of the back slope in Cases C and D of the LDR levee, shown in Figure 10. In Case D, the gap between the concrete panels before the outflow of the panels was large, approximately 20 cm maximum, but in Case D, the gap between the concrete panels tended to increase rapidly once the gap occurred, except for the concrete panels of Nos. 1–2. On the other hand, in Case C, after a small gap was generated between the concrete panels, it gradually increased, and the gap, measuring between 2 and 6 cm, was maintained for a long time. From this, it may be seen that the outflow of the concrete panel endured persistently in Case C. This suggests that, when the laying length of the geogrid was increased by 10 cm, the pullout resistance of the geogrid was appreciably exerted, even after displacement of the concrete panels, and the outflow of the concrete panels was suppressed. Thus, it is suggested that the laying length of the geogrid contributes to an increase in the tenaciousness of the LDR levee, with the concrete panels covering the levee body. It is therefore important to select the appropriate laying length of the geogrid to improve the resistance against overflow erosion of the LDR levee.
In order to quantitatively investigate the influence of the residual length of the geogrid in the levee on the displacement characteristics of concrete panels, Figure 11 shows the time series of the residual length of the geogrid, the gap between the concrete panels, and the friction force of the geogrid per unit width. As an example, the concrete panels of No. 5 in Cases C and D were selected. The residual lengths of two geogrids connected to the concrete panel, the gaps between concrete panels of Nos. 5–6 and Nos. 4–5, and the displacement of the concrete panels of No. 5 are depicted in the figure. Also, Figure 11 shows the summation of the friction forces of the two geogrids connected to the concrete panel. The frictional force per unit width τ × L (N/m) is the result of calculating the optimum moisture content (wopt), as given in the following equation:
τ × L = 185.6L2 + 11791.7L,
The above equation is given by general pullout tests using the same geogrid laid in Hokota sand. The relation between τ and L is strongly dependent on the length and width of the geogrid, the type of soil and the confinement pressure. It is therefore noted that the application of Equation (1) is limited to the range of this experiment. The residual length is the one in the levee body where the geogrid is located and matches the laying length L at the beginning of the experiment. Thus, in Case D (L = 10 cm), when the residual length of the lower geogrid began to decrease, the residual length of the upper geogrid also started to decrease about 1 min later. The displacement of the concrete panels also increased linearly, and it was flowed out quickly. At this time, the gap between the concrete panels also increased linearly. On the other hand, in Case C (L = 20 cm), the residual length of the lower geogrid began to decrease, and the residual length of the upper geogrid was maintained at 20 cm for about 15 min, after which it suppressed the displacement of the concrete panels. At t’ = 75 min, the residual length of the geogrids decreased and the gaps between the concrete panels increased rapidly. This is because the erosion of the levee body extended to the upper geogrid, and then the concrete panels were flowed out quickly.
From the perspective of the friction force of the geogrid, in Case C (L = 20 cm) the friction force was 4732 N/m at the beginning of the experiment but these values were gradually reduced to about 4000 N/m when the lower geogrid started to be eroded. Friction force had been maintained at approximately 4000 N/m. As erosion of the levee body expanded to the upper geogrid, the frictional force of the geogrid decreased sharply. In Case D (L = 10 cm), the initial friction force was 2400 kN/m, but with the displacement of the concrete panel, the levee body was also eroded, and the friction force of the geogrid decreased sharply. The gravity of the laminar drainage layer and the concrete panel was 603 N/m, so fluid force, larger than gravity, acted on the concrete panel. As a result, it is considered that the frictional force by the geogrid must be several times larger than gravity.
5. Conclusions
As the reinforcing method of the levee for overflow erosion and infiltration, we proposed the laminar drain reinforcement (LDR) levee, in which the drain layer is set on the back slope and connected to a concrete panel using geogrid layers. In this study, we used a large-scale (1/4 scale) model test to try to understand the phenomenon. The results of the model tests revealed the following.
- It took 87 min to failure for the armored levee and 102 min for the GRS levee, but with the LDR levee it was possible to maintain the initial condition even after 150 min after the start of overflow, and erosion of the levee body did not occur. In addition, when the LDR levee was without scour protection, we measured t’ = 57 min (L = 10 cm) and t’ = 112 min (L = 20 cm) until failure. The LDR levee was found to have a structure that was tenacious against overflow erosion;
- From the outflow process of the concrete panels, in the armored levee, the concrete panels were flowed out with a slight gap (less than 1 cm) between them. In the GRS levee and LDR levee with the geogrid layers, the concrete panels did not be flowed out until the gap between the concrete panels was between 7 and 20 cm. In the GRS levee, the rate of increase of the gap between concrete panels was large because the overflow water intruded into the gap between the concrete panels and eroded the levee material. On the other hand, the LDR levee did not outflow even when the gaps between the concrete panels exceeded 5 cm, thanks to the laminar drain layer. Thus, the LDR levee with a laminar drain is a valid reinforcement technology against overflow erosion;
- In the LDR levee, by extending the laying length of the geogrid from 10 cm to 20 cm, it took a long time for the concrete panels on the back slope to be flowed out, and the time for the levee to fail was doubled. Therefore, selecting the appropriate laying length of the geogrid is important for improving the resistance against overflow of the LDR levee.
6. Patents
The patents of LDR levee is “E02B 3/10 20060101AFI20180601BHJP”.
Author Contributions
Conceptualization; Y.K. and Y.N., Data curation; Y.K., Funding acquisition; Y.N., Methodology; Y.K., Supervision; Y.N., Visualization; Y.K., Writing—original draft; Y.K. and Y.N., Writing—review & editing; Y.K. and Y.N. All the authors have approved of the submission of this manuscript.
Funding
Financial support for this study was provided by JSPS (Japan Society for the Promotion of Science) KAKENHI, grant number JP16H02365.
Acknowledgments
We wish to express our appreciation to Tatsuoka and Kikuchi of Tokyo University of Science, for discussing our work with us. The authors express their deep gratitude to the students in the hydraulics laboratory of the Department of Civil Engineering, Tokyo University of Science, for their help in conducting the large-scale tests in the present study.
Conflicts of Interest
The authors declare no conflict of interest.
References
- Komori, D.; Nakamura, S.; Kiguchi, M.; Nishijima, A.; Yamazaki, D.; Suzuki, S.; Kawasaki, A.; Oki, K.; Oki, T. Characteristics of the D011 Chao Phraya River flood in central Thailand. Hydrol. Res. Lett. 2012, 6, 41–46. [Google Scholar] [CrossRef]
- Pomeroy, J.W.; Stewart, R.E.; Whitfield, P.H. The 2013 flood event in the South Saskatchewan and Elk River basins: Causes, assessment and damages. Can. Water Resour. J. 2016, 41, 105–117. [Google Scholar] [CrossRef]
- Chew, C.; Reager, J.T.; Small, E. CYGNSS data map flood inundation during the 2017 Atlantic hurricane season. Sci. Rep. 2018, 8, 9336. [Google Scholar] [CrossRef] [PubMed]
- Matsumoto, D.; Sawai, Y.; Yamada, M.; Namegaya, Y.; Shinozaki, T.; Takeda, D.; Fujino, S.; Tanigawa, K.; Nakamura, A.; Pilarczyk, J.E. Erosion and sedimentation during the September 2015 flooding of the Kinu River, central Japan. Sci. Rep. 2016, 6, 34168. [Google Scholar] [CrossRef] [PubMed] [Green Version]
- CIRIA. The International Levee Handbook; CIRIA: London, UK, 2013; pp. 1–1332. [Google Scholar]
- Saran, R.K.; Viswanadham, B.V.S. Centrifuge model tests on the use of geosynthetic layer as an internal drain in levees. Geotext. Geomembr. 2018, 46, 257–276. [Google Scholar] [CrossRef]
- Fukuoka, S.; Fujita, K. Levee Overflow Survey and Development of the Armored Levee. In Proceedings of the 6th Congress of IAHR-APD, Kyoto, Japan, 20–22 July 1988; pp. 417–424. [Google Scholar]
- Werth, K.; Haselsteiner, R.; Steinbacher, F. Overtopping and Overflow of Flood Protection Embankments—Risk Reduction of Embankment Dam Failure by the Use of Geosynthetics. In Proceedings of the ISGSR, 3rd International Symposium on Geotechnical Safety and Risk, Munich, Germany, 2–3 June 2011; pp. 597–604. [Google Scholar]
- Varuso, R.J.; Grieshaber, J.B.; Nataraj, M.S. Geosynthetic reinforced levee test section on soft normally consolidated clays. Geotext. Geomembr. 2005, 23, 362–383. [Google Scholar] [CrossRef]
- Han, J.; Chen, J.; Hong, Z.; Shen, S. Mitigation of levee failures using deep mixed columns and geosynthetics. Geomech. Geoeng. Int. J. 2010, 5, 49–55. [Google Scholar] [CrossRef]
- Cantré, S.; Saathoff, F. Investigation of dredged materials in combination with geosynthetics used in dike construction. Procedia Eng. 2013, 57, 213–221. [Google Scholar] [CrossRef]
- Müller, W.W.; Saathoff, F. Geosynthetics in geoenvironmental engineering. Sci. Technol. Adv. Mater. 2015, 16, 034605. [Google Scholar] [CrossRef] [PubMed] [Green Version]
- Tatsuoka, F.; Tateyama, M.; Uchimura, T.; Koseki, J. Geosynthetic-reinforced soil retaining walls as important permanent structures, 1996–1997 Mercer Lecture. Geosynth. Int. 1997, 4, 81–136. [Google Scholar] [CrossRef]
- Huang, C.C.; Chou, L.H.; Tatsuoka, F. Seismic displacements of geosynthetic-reinforced soil modular block walls. Geosynth. Int. 2003, 10, 2–23. [Google Scholar] [CrossRef]
- Kurakami, Y.; Nihei, Y.; Morita, M.; Futami, S.; Itakura, M. Effect of River Levee with Geosynthetic-reinforced Soil against Overflow Erosion and Infiltration. In Proceedings of the 6th International Symposium on Hydraulic Structures (ISHS), Portland, OR, USA, 27–30 June 2016. [Google Scholar]
- Kurakami, Y.; Nihei, Y.; Kikuchi, Y. Large-scale model tests on various reinforcement technologies of river levee against overflow erosion. In Proceedings of the 6th International Young Geotechnical Engineers’ Conference (iYGEC6), Seoul, Korea, 16–17 September 2017. [Google Scholar]
- Ohtsuki, K.; Nihei, Y. Evaluation of fast flood diffusion through a drainage channel: A flood disaster case study of Japan’s Kinugawa River, September 10, 2015. J. Water Resour. Prot. 2017, 9, 1063–1081. [Google Scholar] [CrossRef]
- Schmocker, L.; Hager, W.H. Modelling dike breaching due to overtopping. J. Hydraul. Res. 2009, 47, 585–597. [Google Scholar] [CrossRef]
- Schmocker, L.; Hager, W.H. Plane dike-breach due to overtopping: Effects of sediment, dike height and discharge. J. Hydraul. Res. 2012, 50, 576–586. [Google Scholar] [CrossRef]
- Schmocker, L.; Frank, P.-J.; Hager, W.H. Overtopping dike-breach: Effect of grain size distribution. J. Hydraul. Res. 2014, 52, 559–564. [Google Scholar] [CrossRef]
Figure 1.
Examples of compound-type levees using artificial materials. (a) Levee reinforcement of the Oder River in Poland described in the International Levee Handbook (ILH) [5]; (b) armored levee on the Kakogawa River in Japan.
Figure 1.
Examples of compound-type levees using artificial materials. (a) Levee reinforcement of the Oder River in Poland described in the International Levee Handbook (ILH) [5]; (b) armored levee on the Kakogawa River in Japan.

Figure 2.
Schematic view of basic composition of the laminar drain reinforcement (LDR) levee.

Figure 3.
Outline of large channel used in the laboratory tests.

Figure 4.
Reinforcement conditions for model levees: (a) Case A (armored levee); (b) Case B (GRS levee); (c) Case C (LDR levee with L = 20 cm); (d) Case D (LDR levee with L = 10 cm).
Figure 4.
Reinforcement conditions for model levees: (a) Case A (armored levee); (b) Case B (GRS levee); (c) Case C (LDR levee with L = 20 cm); (d) Case D (LDR levee with L = 10 cm).

Figure 5.
Time series of overflow depth in the tests for model levees with scour protection.

Figure 6.
Grain size distribution of Hokota sand for levee material in all cases and crushed stone for drain layer of the LDR levee.
Figure 6.
Grain size distribution of Hokota sand for levee material in all cases and crushed stone for drain layer of the LDR levee.

Figure 7.
Temporal variations of levee failures in (a) Case A, (b) Case B, (c) Case C, and (d) Case D.
Figure 7.
Temporal variations of levee failures in (a) Case A, (b) Case B, (c) Case C, and (d) Case D.

Figure 8.
Time series of the residual rates for the cross-sectional area and the crest height in all cases: the results with the scour protection (a) and without the scour protection (b).
Figure 8.
Time series of the residual rates for the cross-sectional area and the crest height in all cases: the results with the scour protection (a) and without the scour protection (b).

Figure 9.
Temporal variations of phreatic surface in the levee body under the overflow: (a) Case B (GRS levee); (b) Case C (LDR levee).
Figure 9.
Temporal variations of phreatic surface in the levee body under the overflow: (a) Case B (GRS levee); (b) Case C (LDR levee).

Figure 10.
Time series of the residual rate of the cross-sectional area, time of flowing out of concrete panel at the back slope and the gaps between concrete panels: (a) Case A (armored levee) and Case B (GRS levee); (b) Cases C and D (LDR levee).
Figure 10.
Time series of the residual rate of the cross-sectional area, time of flowing out of concrete panel at the back slope and the gaps between concrete panels: (a) Case A (armored levee) and Case B (GRS levee); (b) Cases C and D (LDR levee).

Figure 11.
Time series of the residual length of the geogrid in the panel (No. 5), displacement of the panel (No. 5), the gaps between the concrete panels (Nos. 4–5 and Nos. 5–6), and the friction force of the geogrid: (a) Case C with L = 20 cm; (b) Case D with L = 10 cm.
Figure 11.
Time series of the residual length of the geogrid in the panel (No. 5), displacement of the panel (No. 5), the gaps between the concrete panels (Nos. 4–5 and Nos. 5–6), and the friction force of the geogrid: (a) Case C with L = 20 cm; (b) Case D with L = 10 cm.


Table 1.
Experimental conditions for model levees.
| Case | Levee Condition | Laying Length of Geogrid | Infiltration Conditions before Overflow | The Time of Infiltration | The Time of Overflow |
|---|---|---|---|---|---|
| A | Armored levee | - | Not tested | 0 h | 1.6 h |
| B | GRS * levee | 20 cm | Yes (h1 = 0.7 m) | 97.5 h | 1.8 h |
| C | LDR levee | 20 cm | Yes (h1 = 0.7 m) | 57 h | 4.7 h |
| D | 10 cm | Not tested | 0 h | 3.7 h |
* GRS: geosynthetic-reinforced soil.
© 2019 by the authors. Licensee MDPI, Basel, Switzerland. This article is an open access article distributed under the terms and conditions of the Creative Commons Attribution (CC BY) license (http://creativecommons.org/licenses/by/4.0/).
Share and Cite
MDPI and ACS Style
Kurakami, Y.; Nihei, Y. Resistance of Laminar Drain Reinforcement Levee against Overflow Erosion. Water 2019, 11, 1768. https://doi.org/10.3390/w11091768
AMA Style
Kurakami Y, Nihei Y. Resistance of Laminar Drain Reinforcement Levee against Overflow Erosion. Water. 2019; 11(9):1768. https://doi.org/10.3390/w11091768
Chicago/Turabian StyleKurakami, Yuki, and Yasuo Nihei. 2019. "Resistance of Laminar Drain Reinforcement Levee against Overflow Erosion" Water 11, no. 9: 1768. https://doi.org/10.3390/w11091768
Note that from the first issue of 2016, this journal uses article numbers instead of page numbers. See further details here.