
In Vivo Bioluminescence Imaging of HBV Replicating Hepatocytes Allows for the Monitoring of Anti-Viral Immunity

 , ,
, ,  and
and 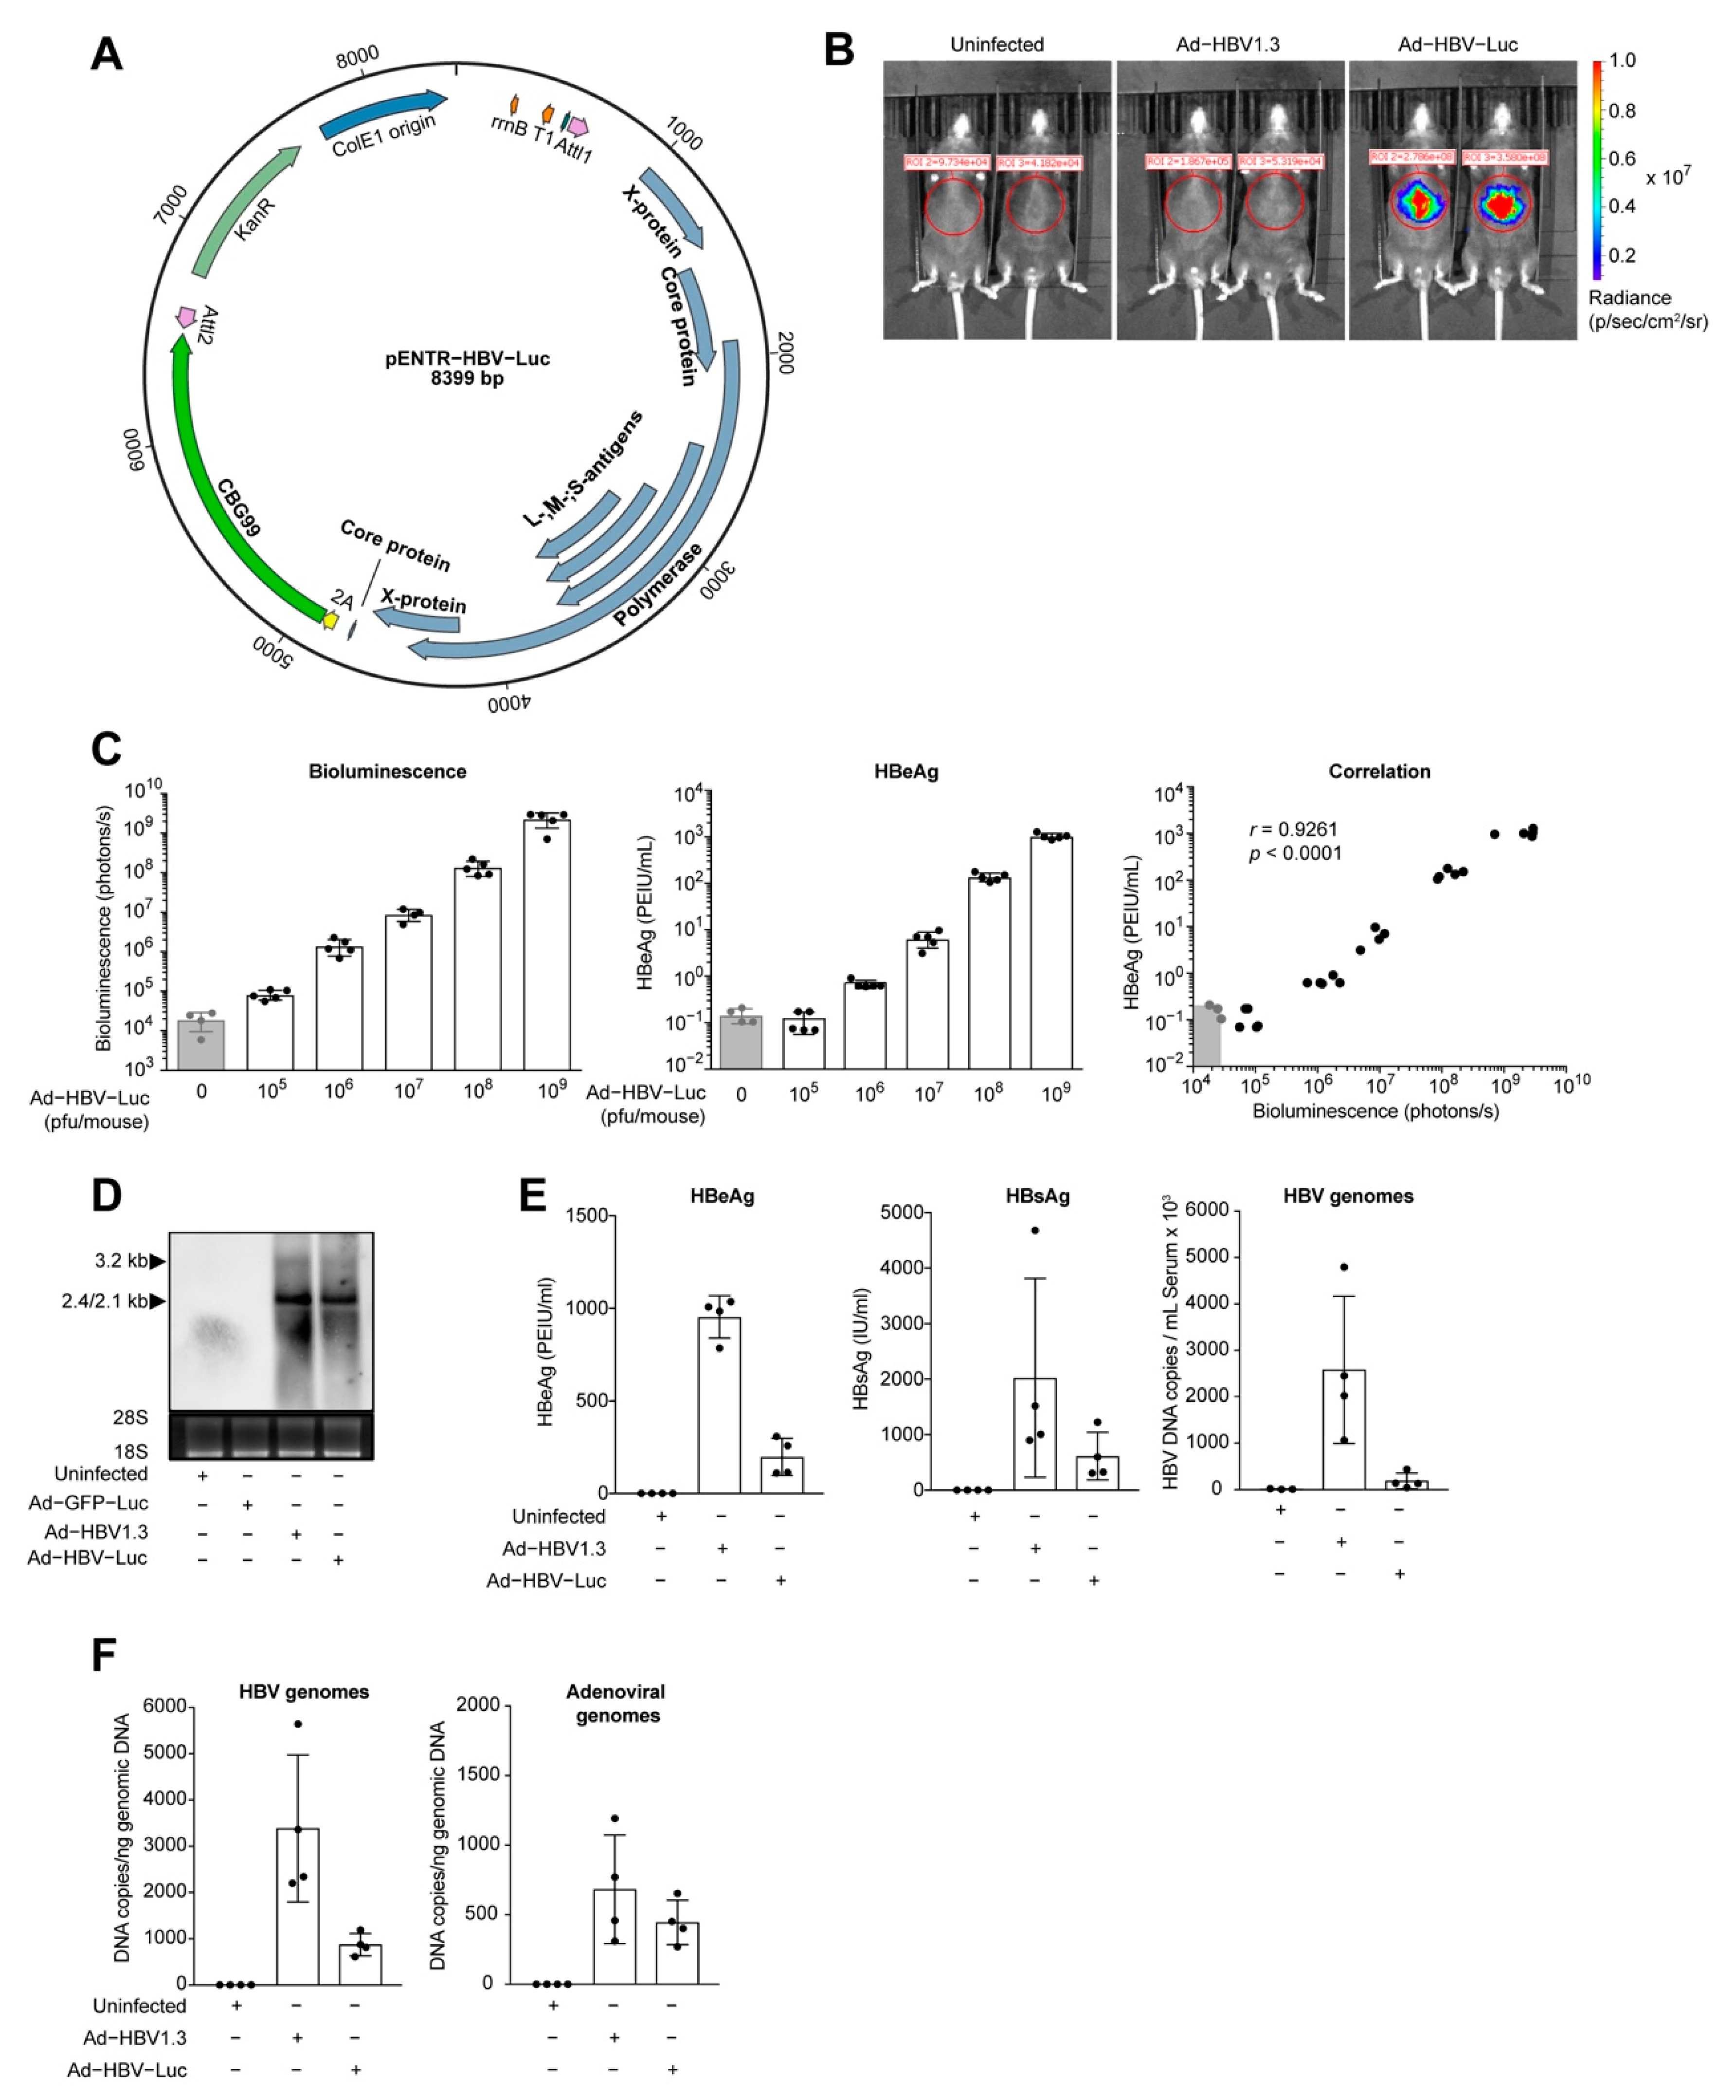
Abstract
:1. Introduction
2. Materials and Methods
2.1. Adenoviral Vector
2.2. Mice
2.3. Bioluminescence Imaging
2.4. Alanine Aminotransferase (ALT) Measurement
2.5. Quantitative Real-Time PCR
- (1)
- Adenovirus DNAforward (TAAGCGACGGATGTGG)reverse (CCACGTAAACGGTCAAAG);
- (2)
- HBV DNAforward (GTTGCCCGTTTGTCCTCTAATTC)reverse (GGAGGGATACATAGAGGTTCCTTGA);
- (3)
- HBV pgRNAforward (GAGTGTGGATTCGCACTCC)reverse (GAGGCGAGGGAGTTCTTCT);
- (4)
- Cyclophilinforward (ATGGTCAACCCCACCGTGT)reverse (TTCTGCTGTCTTTGGAACTTTGTC).
2.6. Quantification of HBe and HBs Antigen in Blood
2.7. Isolation of Liver-Associated Lymphocytes
2.8. Isolation of PBMCs
2.9. Flow Cytometry
2.10. Northern Blot Analysis of HBV RNA
2.11. Histology
2.12. Real-Time Viability: xCELLigence Kill Assay
2.13. Statistics
3. Results
3.1. Transfer of HBV Genomes in Mice
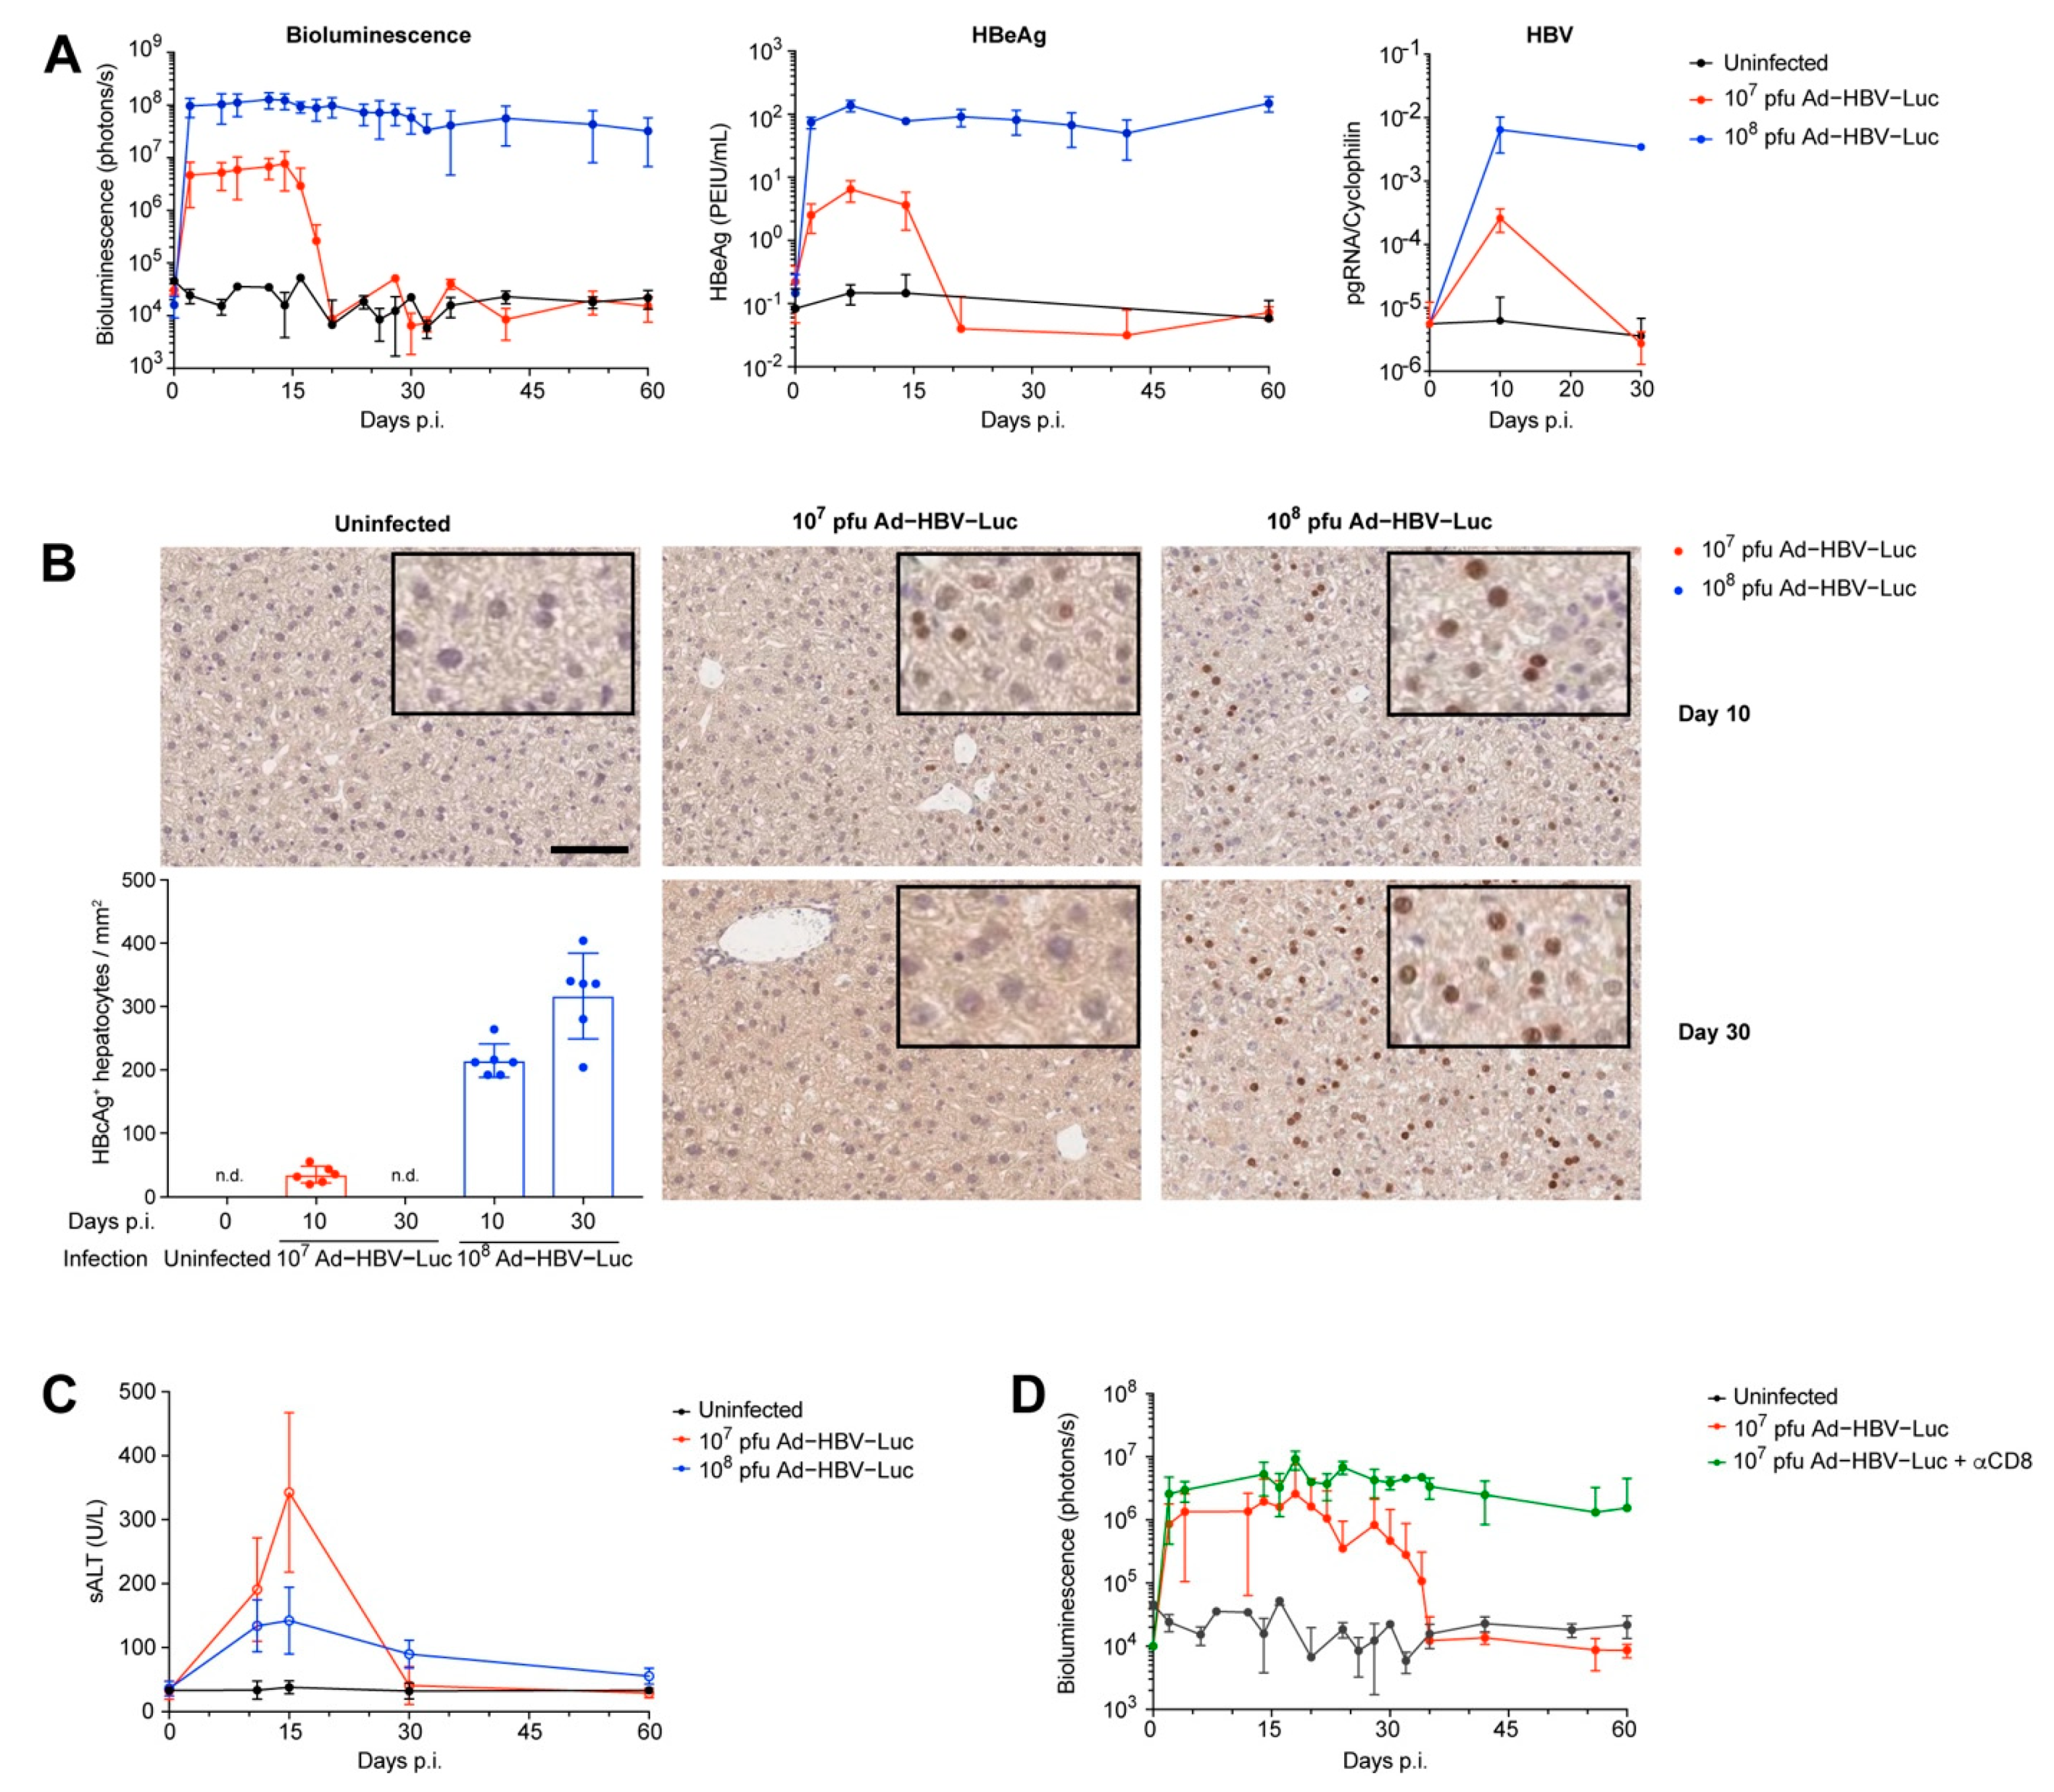
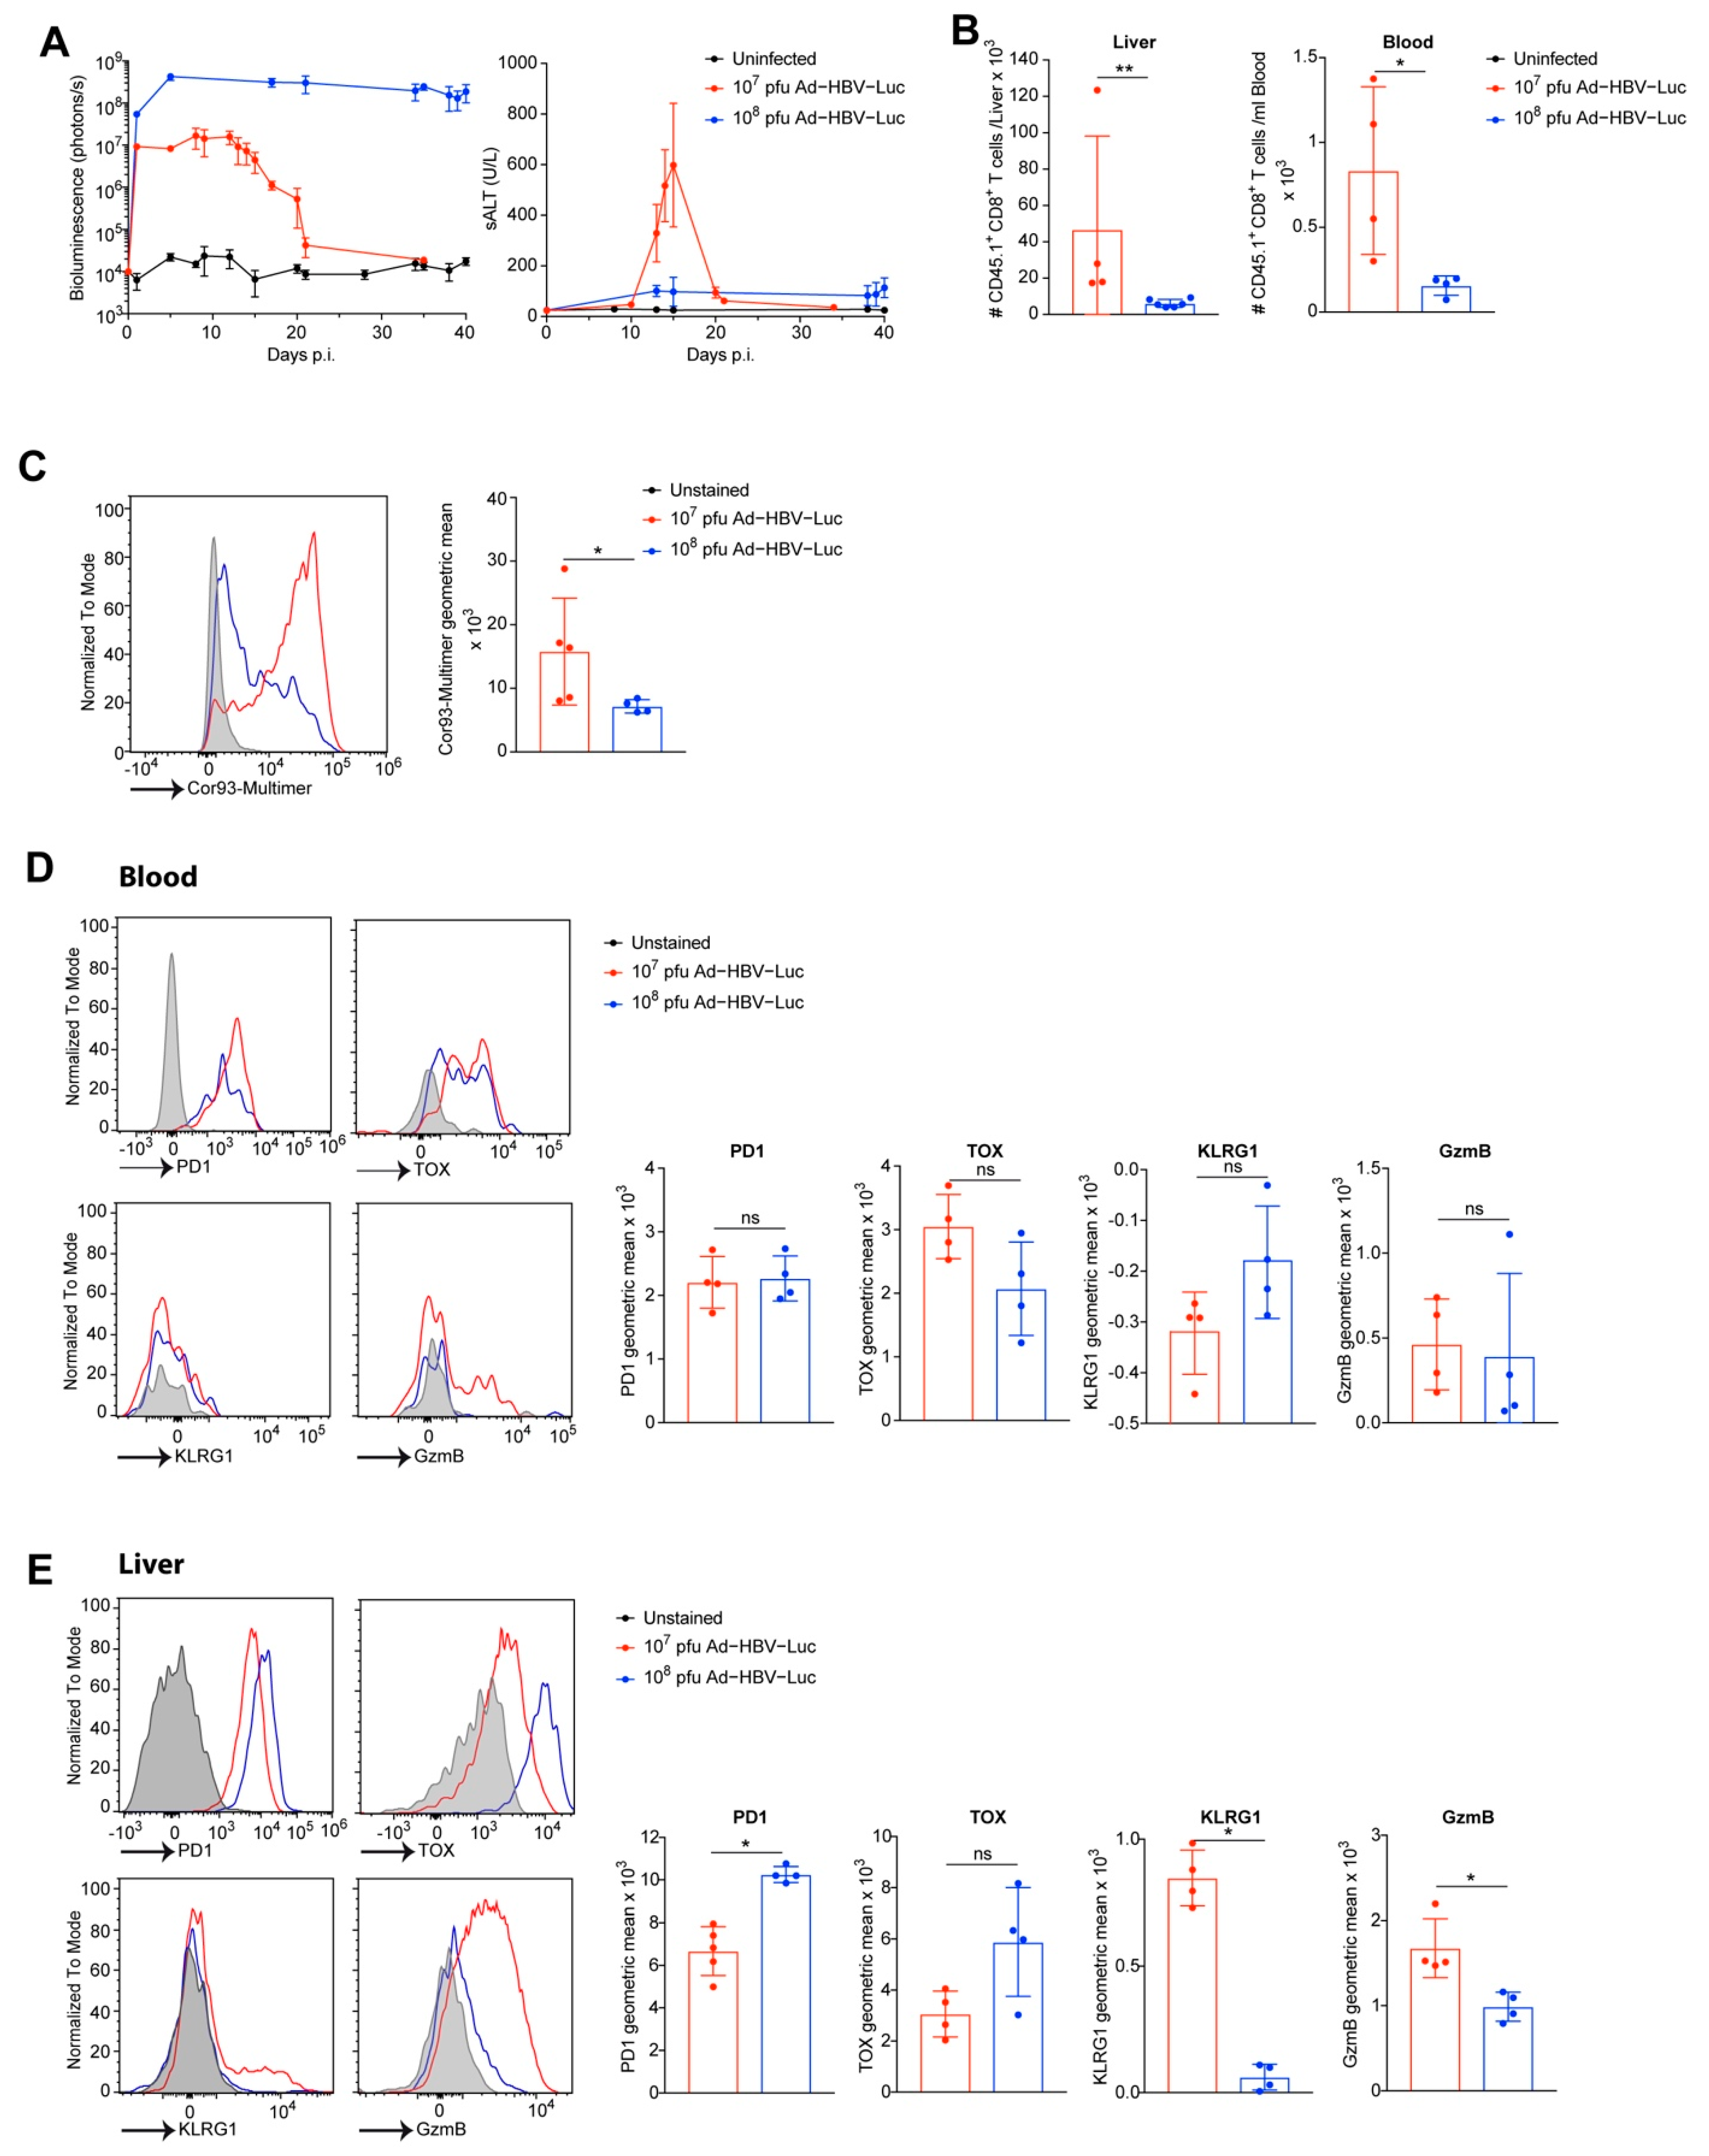
3.2. Ad-HBV-Luc Infection Develops into Acute or Chronic HBV Infection in Mice
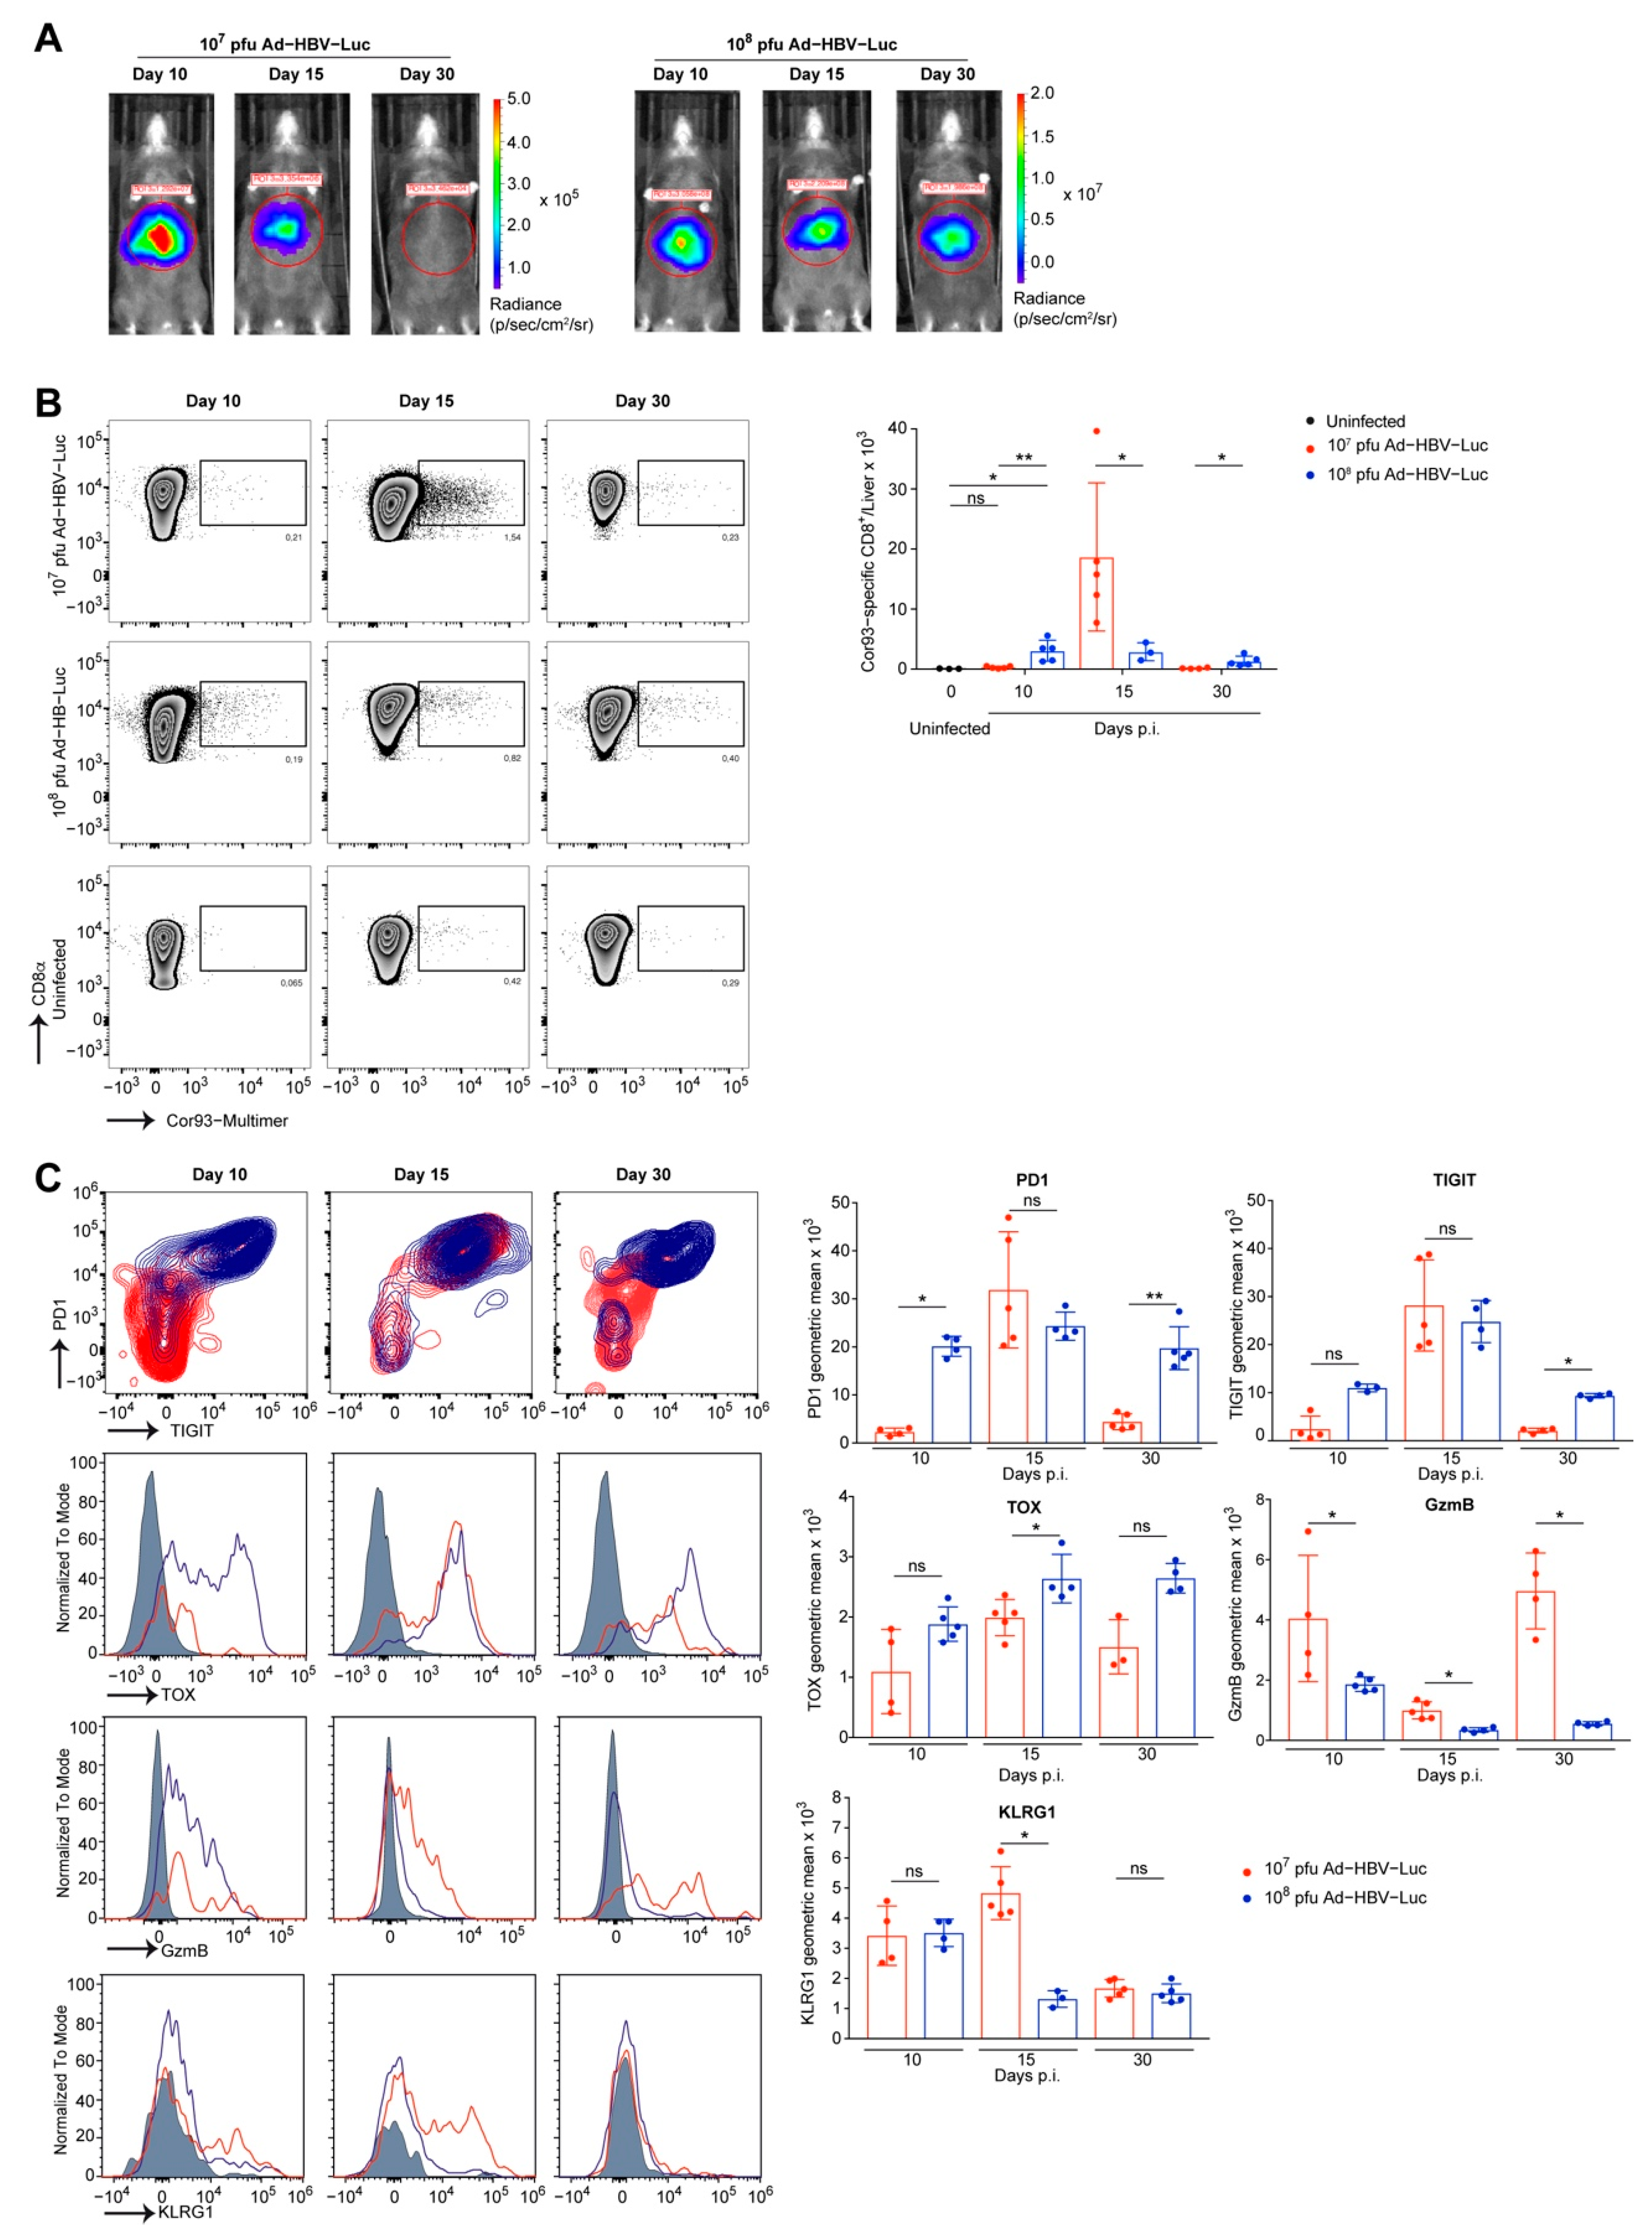
3.3. Phenotype of Endogenous HBV-Specific CD8 T Cells
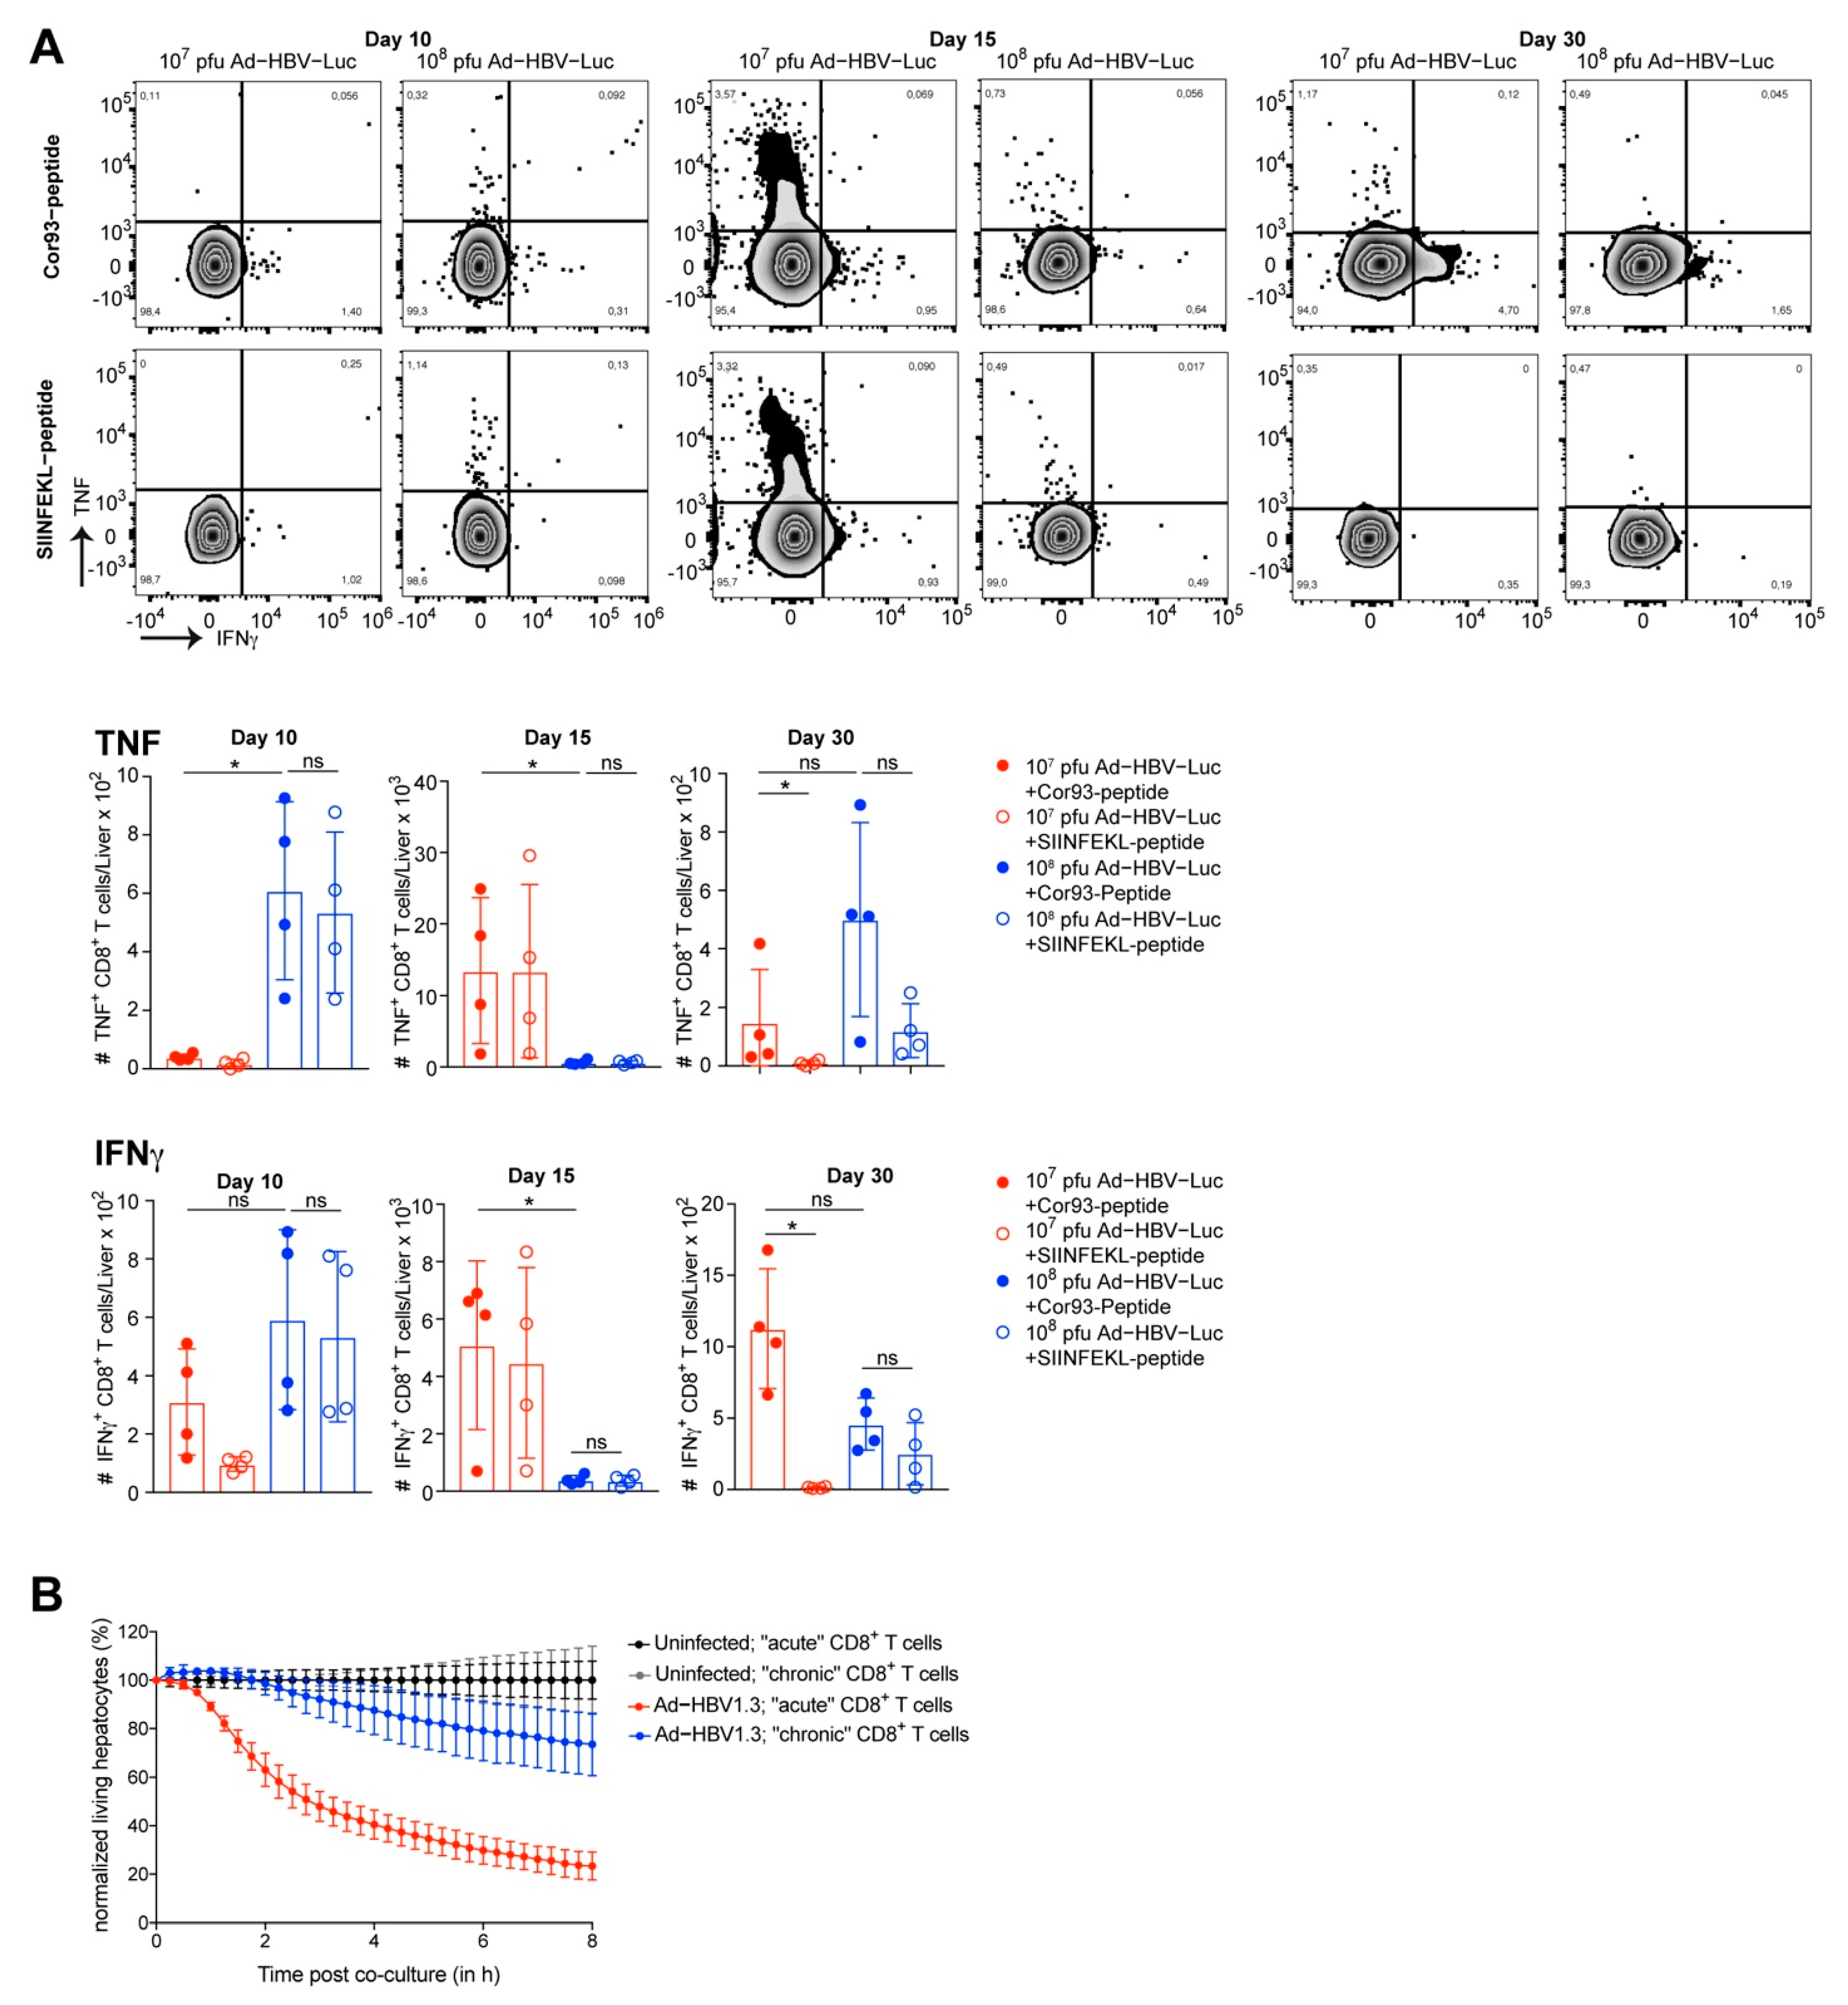
3.4. Adoptive Transfer of HBV-Specific T Cell Receptor Transgenic CD8 T Cells to Enhance Accuracy of CD8 T Cell Phenotyping
4. Discussion
Author Contributions
Funding
Institutional Review Board Statement
Acknowledgments
Conflicts of Interest
References
- WHO. Hepatitis B Fact Sheet. Available online: https://www.who.int/news-room/fact-sheets/detail/hepatitis-b (accessed on 26 June 2021).
- Lemoine, M.; Shimakawa, Y.; Njie, R.; Taal, M.; Ndow, G.; Chemin, I.; Ghosh, S.; Njai, H.F.; Jeng, A.; Sow, A.; et al. Acceptability and feasibility of a screen-and-treat programme for hepatitis B virus infection in The Gambia: The prevention of liver fibrosis and cancer in africa (prolifica) study. Lancet Glob. Health 2016, 4, e559–e567. [Google Scholar] [CrossRef] [Green Version]
- Shankar, H.; Blanas, D.; Bichoupan, K.; Ndiaye, D.; Carmody, E.; Martel-Laferriere, V.; Culpepper-Morgan, J.; Dieterich, D.T.; Branch, A.D.; Bekele, M.; et al. A novel collaborative community-based hepatitis B screening and linkage to care program for African immigrants. Clin. Infect. Dis. 2016, 62 (Suppl. S4), S289–S297. [Google Scholar] [CrossRef] [Green Version]
- Chisari, F.V.; Isogawa, M.; Wieland, S.F. Pathogenesis of hepatitis B virus infection. Pathol. Biol. 2010, 58, 258–266. [Google Scholar] [CrossRef] [Green Version]
- Racanelli, V.; Rehermann, B. The liver as an immunological organ. Hepatology 2006, 43 (Suppl. S1), S54–S62. [Google Scholar] [CrossRef]
- Protzer, U.; Maini, M.K.; Knolle, P.A. Living in the liver: Hepatic infections. Nat. Reviews. Immunol. 2012, 12, 201–213. [Google Scholar] [CrossRef]
- Bissell, D.M.; Wang, S.S.; Jarnagin, W.R.; Roll, F.J. Cell-specific expression of transforming growth factor-beta in rat liver. Evidence for autocrine regulation of hepatocyte proliferation. J. Clin. Investig. 1995, 96, 447–455. [Google Scholar] [CrossRef] [Green Version]
- Knolle, P.; Schlaak, J.; Uhrig, A.; Kempf, P.; Zum Buschenfelde, K.H.; Gerken, G. Human Kupffer cells secrete IL-10 in response to lipopolysaccharide (LPS) challenge. J. Hepatol. 1995, 22, 226–229. [Google Scholar] [CrossRef]
- Knolle, P.A.; Thimme, R. Hepatic immune regulation and its involvement in viral hepatitis infection. Gastroenterology 2014, 146, 1193–1207. [Google Scholar] [CrossRef] [PubMed]
- Gao, B.; Jeong, W.I.; Tian, Z. Liver: An organ with predominant innate immunity. Hepatology 2008, 47, 729–736. [Google Scholar] [CrossRef] [PubMed]
- Boni, C.; Fisicaro, P.; Valdatta, C.; Amadei, B.; Di Vincenzo, P.; Giuberti, T.; Laccabue, D.; Zerbini, A.; Cavalli, A.; Missale, G.; et al. Characterization of hepatitis B virus (HBV)-specific T-cell dysfunction in chronic HBV infection. J. Virol. 2007, 81, 4215–4225. [Google Scholar] [CrossRef] [PubMed] [Green Version]
- Lopes, A.R.; Kellam, P.; Das, A.; Dunn, C.; Kwan, A.; Turner, J.; Peppa, D.; Gilson, R.J.; Gehring, A.; Bertoletti, A.; et al. Bim-mediated deletion of antigen-specific CD8 T cells in patients unable to control HBV infection. J. Clin. Investig. 2008, 118, 1835–1845. [Google Scholar] [CrossRef] [PubMed]
- Rehermann, B. Pathogenesis of chronic viral hepatitis: Differential roles of T cells and NK cells. Nat. Med. 2013, 19, 859–868. [Google Scholar] [CrossRef] [Green Version]
- Schurich, A.; Khanna, P.; Lopes, A.R.; Han, K.J.; Peppa, D.; Micco, L.; Nebbia, G.; Kennedy, P.T.; Geretti, A.M.; Dusheiko, G.; et al. Role of the coinhibitory receptor cytotoxic T lymphocyte antigen-4 on apoptosis-Prone CD8 T cells in persistent hepatitis B virus infection. Hepatology 2011, 53, 1494–1503. [Google Scholar] [CrossRef] [PubMed]
- Gehring, A.J.; Protzer, U. Targeting innate and adaptive immune responses to cure chronic HBV infection. Gastroenterology 2019, 156, 325–337. [Google Scholar] [CrossRef] [Green Version]
- WHO. Guidelines for the Prevention, Care and Treatment of Persons with Chronic Hepatitis B Infection; WHO Library Cataloguing-in-Publication Data: Geneva, Switzerland, 2015. [Google Scholar]
- Grossi, G.; Viganò, M.; Loglio, A.; Lampertico, P. Hepatitis B virus long-term impact of antiviral therapy nucleot(s)ide analogues (NUCs). Liver Int. 2017, 37 (Suppl. S1), 45–51. [Google Scholar] [CrossRef] [PubMed] [Green Version]
- Lucifora, J.; Protzer, U. Attacking hepatitis B virus cccDNA—The holy grail to hepatitis B cure. J. Hepatol. 2016, 64, S41–S48. [Google Scholar] [CrossRef]
- Bock, C.T.; Schwinn, S.; Locarnini, S.; Fyfe, J.; Manns, M.P.; Trautwein, C.; Zentgraf, H. Structural organization of the hepatitis B virus minichromosome. J. Mol. Biol. 2001, 307, 183–196. [Google Scholar] [CrossRef]
- Maini, M.K.; Boni, C.; Ogg, G.S.; King, A.S.; Reignat, S.; Lee, C.K.; Larrubia, J.R.; Webster, G.J.; McMichael, A.J.; Ferrari, C.; et al. Direct ex vivo analysis of hepatitis B virus-specific CD8(+) T cells associated with the control of infection. Gastroenterology 1999, 117, 1386–1396. [Google Scholar] [CrossRef]
- Thimme, R.; Wieland, S.; Steiger, C.; Ghrayeb, J.; Reimann, K.A.; Purcell, R.H.; Chisari, F.V. CD8(+) T cells mediate viral clearance and disease pathogenesis during acute hepatitis B virus infection. J. Virol. 2003, 77, 68–76. [Google Scholar] [CrossRef] [Green Version]
- Fisicaro, P.; Valdatta, C.; Massari, M.; Loggi, E.; Biasini, E.; Sacchelli, L.; Cavallo, M.C.; Silini, E.M.; Andreone, P.; Missale, G.; et al. Antiviral intrahepatic T-cell responses can be restored by blocking programmed death-1 pathway in chronic hepatitis B. Gastroenterology 2010, 138, 682–693. [Google Scholar] [CrossRef]
- Schulze, A.; Mills, K.; Weiss, T.S.; Urban, S. Hepatocyte polarization is essential for the productive entry of the hepatitis B virus. Hepatology 2012, 55, 373–383. [Google Scholar] [CrossRef]
- Dandri, M.; Petersen, J. Mechanism of hepatitis B virus persistence in hepatocytes and its carcinogenic potential. Clin. Infect. Dis. 2016, 62 (Suppl. 4), S281–S288. [Google Scholar] [CrossRef] [PubMed] [Green Version]
- Protzer, U. Viral hepatitis: The bumpy road to animal models for HBV infection. Nat. Rev. Gastroenterol. Hepatol. 2017, 14, 327–328. [Google Scholar] [CrossRef]
- Yang, P.L.; Althage, A.; Chung, J.; Chisari, F.V. Hydrodynamic injection of viral DNA: A mouse model of acute hepatitis B virus infection. Proc. Natl. Acad. Sci. USA 2002, 99, 13825–13830. [Google Scholar] [CrossRef] [PubMed] [Green Version]
- Michler, T.; Kosinska, A.D.; Festag, J.; Bunse, T.; Su, J.; Ringelhan, M.; Imhof, H.; Grimm, D.; Steiger, K.; Mogler, C.; et al. Knockdown of virus antigen expression increases therapeutic vaccine efficacy in high-titer hepatitis B virus carrier mice. Gastroenterology 2020, 158, 1762–1775. [Google Scholar] [CrossRef] [PubMed]
- Sprinzl, M.F.; Oberwinkler, H.; Schaller, H.; Protzer, U. Transfer of hepatitis B virus genome by adenovirus vectors into cultured cells and mice: Crossing the species barrier. J. Virol. 2001, 75, 5108–5118. [Google Scholar] [CrossRef] [PubMed] [Green Version]
- Manske, K.; Kallin, N.; Konig, V.; Schneider, A.; Kurz, S.; Bosch, M.; Welz, M.; Cheng, R.L.; Bengsch, B.; Steiger, K.; et al. Outcome of anti-viral immunity in the liver is shaped by the level of antigen expressed in infected hepatocytes. Hepatology 2018, 68, 2089–2105. [Google Scholar] [CrossRef] [PubMed]
- Ko, C.; Chakraborty, A.; Chou, W.M.; Hasreiter, J.; Wettengel, J.M.; Stadler, D.; Bester, R.; Asen, T.; Zhang, K.; Wisskirchen, K.; et al. Hepatitis B virus genome recycling and de novo secondary infection events maintain stable cccdna levels. J. Hepatol. 2018, 69, 1231–1241. [Google Scholar] [CrossRef]
- Ko, C.; Su, J.; Festag, J.; Bester, R.; Kosinska, A.D.; Protzer, U. Intramolecular recombination enables the formation of hepatitis B virus (HBV) cccdna in mice after HBV genome transfer using recombinant AAV vectors. Antivir. Res. 2021, 194, 105140. [Google Scholar] [CrossRef]
- Dudek, M.; Pfister, D.; Donakonda, S.; Filpe, P.; Schneider, A.; Laschinger, M.; Hartmann, D.; Hüser, N.; Meiser, P.; Bayerl, F.; et al. Auto-aggressive CXCR6(+) CD8 T cells cause liver immune pathology in NASH. Nature 2021, 592, 444–449. [Google Scholar] [CrossRef]
- Iannacone, M.; Guidotti, L.G. Mouse models of hepatitis B virus pathogenesis. Cold Spring Harb. Perspect. Med. 2015, 5, a021477. [Google Scholar] [CrossRef] [Green Version]
- Liu, Y.; Maya, S.; Ploss, A. Animal models of hepatitis B virus infection–success, challenges, and future directions. Viruses 2021, 13, 777. [Google Scholar] [CrossRef] [PubMed]
- Guidotti, L.G.; Matzke, B.; Schaller, H.; Chisari, F.V. High-level hepatitis B virus replication in transgenic mice. J. Virol. 1995, 69, 6158–6169. [Google Scholar] [CrossRef] [PubMed] [Green Version]
- Dion, S.; Bourgine, M.; Godon, O.; Levillayer, F.; Michel, M.L. Adeno-associated virus-mediated gene transfer leads to persistent hepatitis B virus replication in mice expressing HLA-A2 and HLA-DR1 molecules. J. Virol. 2013, 87, 5554–5563. [Google Scholar] [CrossRef] [Green Version]
- Huang, L.R.; Gabel, Y.A.; Graf, S.; Arzberger, S.; Kurts, C.; Heikenwalder, M.; Knolle, P.A.; Protzer, U. Transfer of HBV genomes using low doses of adenovirus vectors leads to persistent infection in immune competent mice. Gastroenterology 2012, 142, 1447–1450. [Google Scholar] [CrossRef] [PubMed] [Green Version]
- Wieland, S.; Thimme, R.; Purcell, R.H.; Chisari, F.V. Genomic analysis of the host response to hepatitis B virus infection. Proc. Natl. Acad. Sci. USA 2004, 101, 6669–6674. [Google Scholar] [CrossRef] [PubMed] [Green Version]
- Lampl, S.; Janas, M.K.; Donakonda, S.; Brugger, M.; Lohr, K.; Schneider, A.; Manske, K.; Sperl, L.E.; Klager, S.; Kuster, B.; et al. Reduced mitochondrial resilience enables non-canonical induction of apoptosis after TNF receptor signaling in virus-infected hepatocytes. J. Hepatol. 2020, 73, 1347–1359. [Google Scholar] [CrossRef] [PubMed]
- Asabe, S.; Wieland, S.F.; Chattopadhyay, P.K.; Roederer, M.; Engle, R.E.; Purcell, R.H.; Chisari, F.V. The size of the viral inoculum contributes to the outcome of hepatitis B virus infection. J. Virol. 2009, 83, 9652–9662. [Google Scholar] [CrossRef] [Green Version]
- Lempp, F.A.; Wiedtke, E.; Qu, B.; Roques, P.; Chemin, I.; Vondran, F.W.R.; Le Grand, R.; Grimm, D.; Urban, S. Sodium taurocholate cotransporting polypeptide is the limiting host factor of hepatitis B virus infection in macaque and pig hepatocytes. Hepatology 2017, 66, 703–716. [Google Scholar] [CrossRef] [Green Version]
- Dusseaux, M.; Masse-Ranson, G.; Darche, S.; Ahodantin, J.; Li, Y.; Fiquet, O.; Beaumont, E.; Moreau, P.; Riviere, L.; Neuveut, C.; et al. Viral load affects the immune response to HBV in mice with humanized immune system and liver. Gastroenterology 2017, 153, 1647–1661. [Google Scholar] [CrossRef] [Green Version]
- Bility, M.T.; Cheng, L.; Zhang, Z.; Luan, Y.; Li, F.; Chi, L.; Zhang, L.; Tu, Z.; Gao, Y.; Fu, Y.; et al. Hepatitis B virus infection and immunopathogenesis in a humanized mouse model: Induction of human-specific liver fibrosis and m2-like macrophages. PLoS Pathog. 2014, 10, e1004032. [Google Scholar] [CrossRef] [PubMed] [Green Version]
- Yuan, L.; Jiang, J.; Liu, X.; Zhang, Y.; Zhang, L.; Xin, J.; Wu, K.; Li, X.; Cao, J.; Guo, X.; et al. Hbv infection-induced liver cirrhosis development in dual-humanised mice with human bone mesenchymal stem cell transplantation. Gut 2019, 68, 2044–2056. [Google Scholar] [CrossRef] [PubMed] [Green Version]
- Das, A.K.; Yang, Q.Y.; Fu, X.; Liang, J.F.; Duarte, M.S.; Zhu, M.J.; Trobridge, G.D.; Du, M. Amp-activated protein kinase stimulates myostatin expression in C2C12 cells. Biochem. Biophys. Res. Commun. 2012, 427, 36–40. [Google Scholar] [CrossRef] [PubMed] [Green Version]
- Podetz-Pedersen, K.M.; Vezys, V.; Somia, N.V.; Russell, S.J.; McIvor, R.S. Cellular immune response against firefly luciferase after sleeping beauty-mediated gene transfer in vivo. Hum. Gene Ther. 2014, 25, 955–965. [Google Scholar] [CrossRef] [PubMed] [Green Version]
- Mueller, S.N.; Ahmed, R. High antigen levels are the cause of T cell exhaustion during chronic viral infection. Proc. Natl. Acad. Sci. USA 2009, 106, 8623–8628. [Google Scholar] [CrossRef] [PubMed] [Green Version]
- Alfei, F.; Kanev, K.; Hofmann, M.; Wu, M.; Ghoneim, H.E.; Roelli, P.; Utzschneider, D.T.; Von Hoesslin, M.; Cullen, J.G.; Fan, Y.; et al. Tox reinforces the phenotype and longevity of exhausted T cells in chronic viral infection. Nature 2019, 571, 265–269. [Google Scholar] [CrossRef]
- Utzschneider, D.T.; Alfei, F.; Roelli, P.; Barras, D.; Chennupati, V.; Darbre, S.; Delorenzi, M.; Pinschewer, D.D.; Zehn, D. High antigen levels induce an exhausted phenotype in a chronic infection without impairing T cell expansion and survival. J. Exp. Med. 2016, 213, 1819–1834. [Google Scholar] [CrossRef] [PubMed]
- Ochel, A.; Cebula, M.; Riehn, M.; Hillebrand, U.; Lipps, C.; Schirmbeck, R.; Hauser, H.; Wirth, D. Effective intrahepatic CD8+ T-cell immune responses are induced by low but not high numbers of antigen-expressing hepatocytes. Cell Mol. Immunol. 2016, 13, 805–815. [Google Scholar] [CrossRef] [PubMed] [Green Version]
- Isogawa, M.; Chung, J.; Murata, Y.; Kakimi, K.; Chisari, F.V. Cd40 activation rescues antiviral CD8(+) T cells from PD-1-mediated exhaustion. PLoS Pathog. 2013, 9, e1003490. [Google Scholar] [CrossRef] [Green Version]


Publisher’s Note: MDPI stays neutral with regard to jurisdictional claims in published maps and institutional affiliations. |
© 2021 by the authors. Licensee MDPI, Basel, Switzerland. This article is an open access article distributed under the terms and conditions of the Creative Commons Attribution (CC BY) license (https://creativecommons.org/licenses/by/4.0/).
Share and Cite
Manske, K.; Schneider, A.; Ko, C.; Knolle, P.A.; Steiger, K.; Protzer, U.; Wohlleber, D. In Vivo Bioluminescence Imaging of HBV Replicating Hepatocytes Allows for the Monitoring of Anti-Viral Immunity. Viruses 2021, 13, 2273. https://doi.org/10.3390/v13112273
Manske K, Schneider A, Ko C, Knolle PA, Steiger K, Protzer U, Wohlleber D. In Vivo Bioluminescence Imaging of HBV Replicating Hepatocytes Allows for the Monitoring of Anti-Viral Immunity. Viruses. 2021; 13(11):2273. https://doi.org/10.3390/v13112273
Chicago/Turabian StyleManske, Katrin, Annika Schneider, Chunkyu Ko, Percy A. Knolle, Katja Steiger, Ulrike Protzer, and Dirk Wohlleber. 2021. "In Vivo Bioluminescence Imaging of HBV Replicating Hepatocytes Allows for the Monitoring of Anti-Viral Immunity" Viruses 13, no. 11: 2273. https://doi.org/10.3390/v13112273