
Evaluation of Biochemical Juice Attributes and Color-Related Traits in Muscadine Grape Population

 , , , and
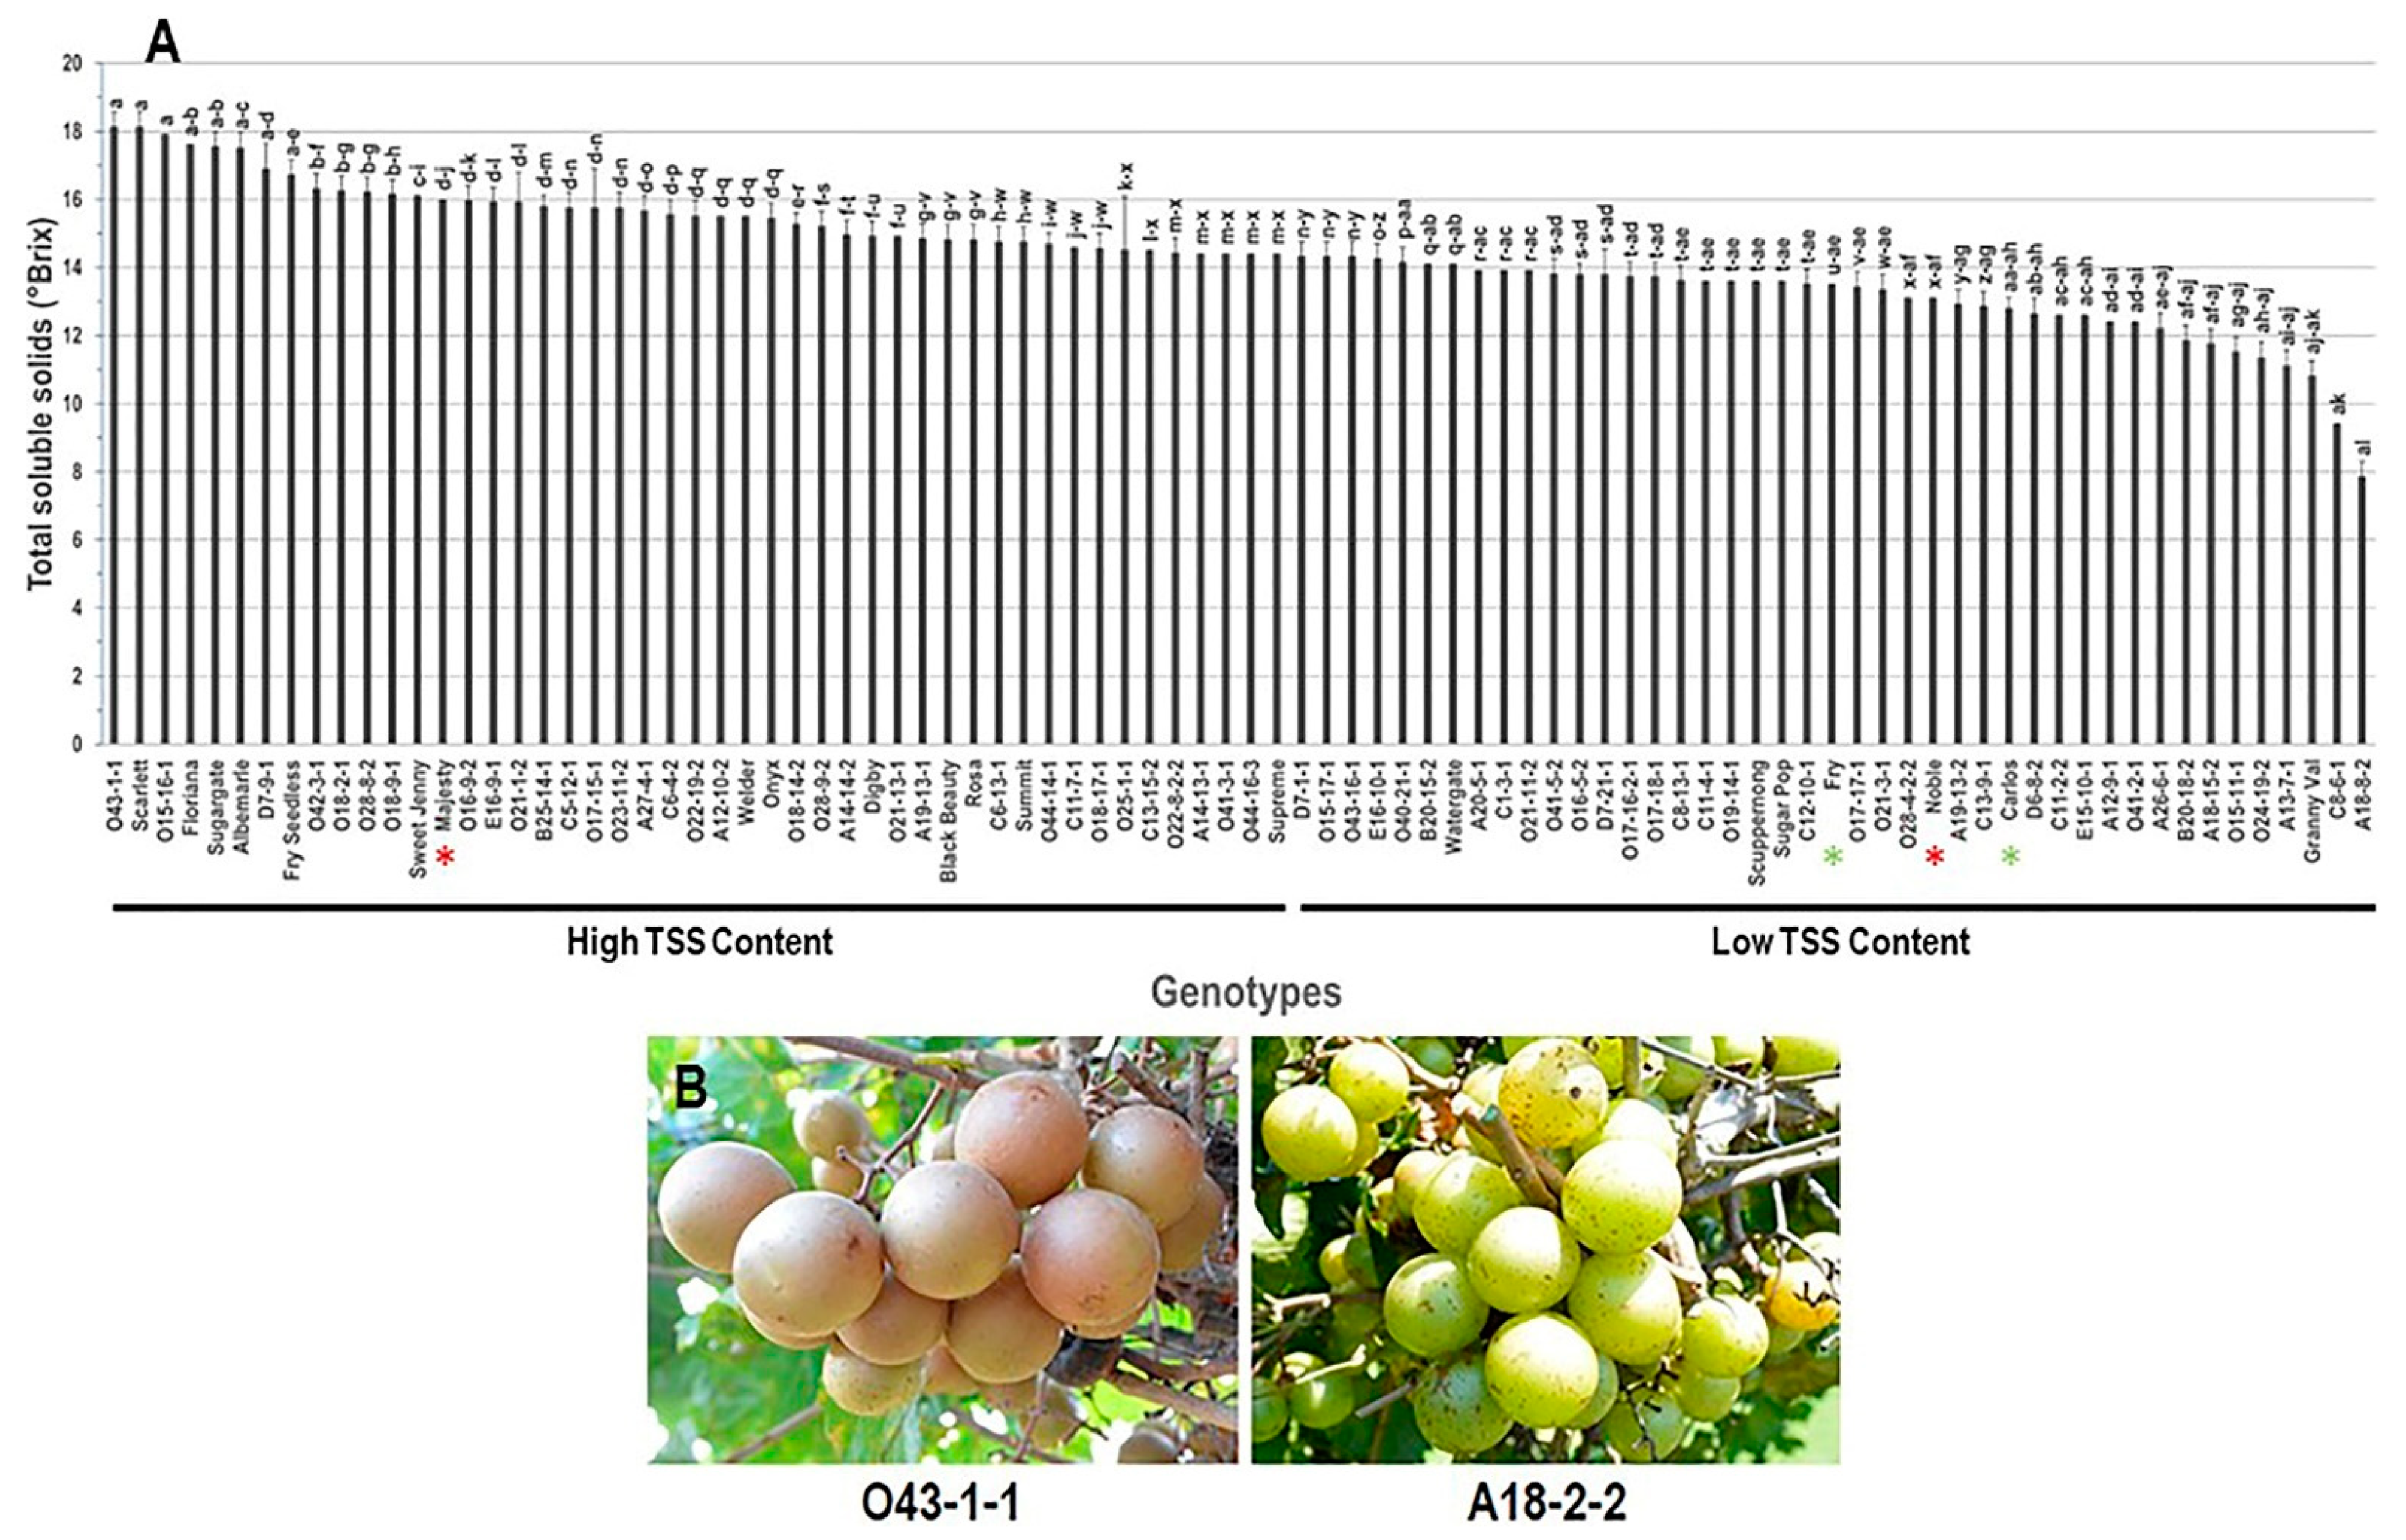
Abstract
:1. Introduction
2. Materials and Methods
2.1. Plant Material
2.2. Biochemical-Related Traits
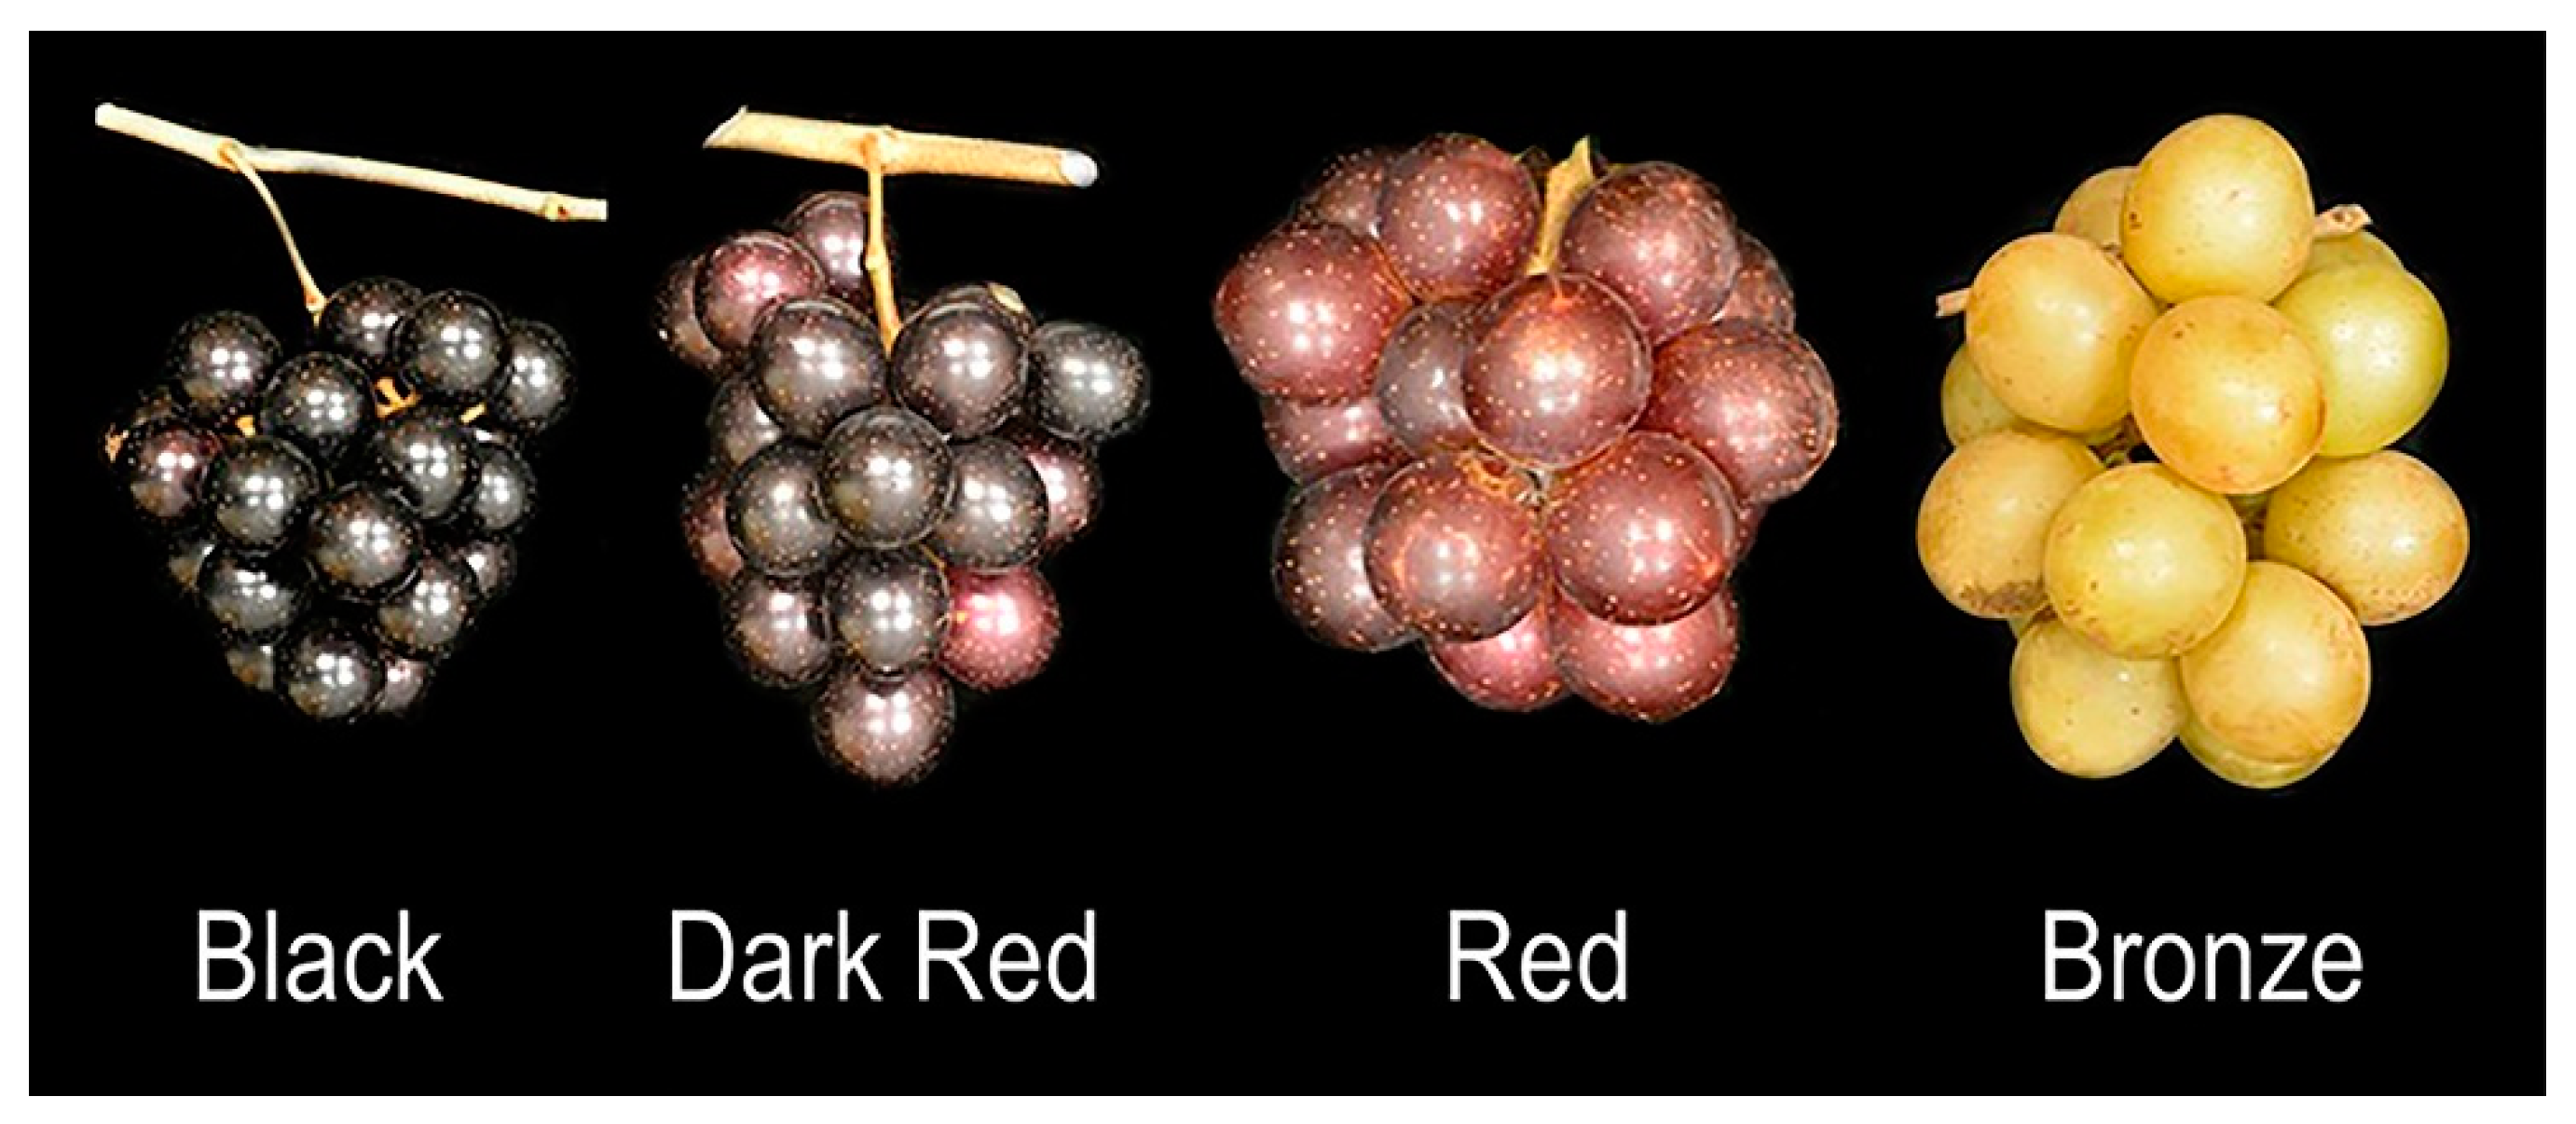
2.3. Color-Related Traits
2.3.1. Color Parameter Values
2.3.2. Estimation of Total Anthocyanins Content (TAC)
2.4. Statistical Analysis
3. Results
3.1. Biochemical-Related Traits
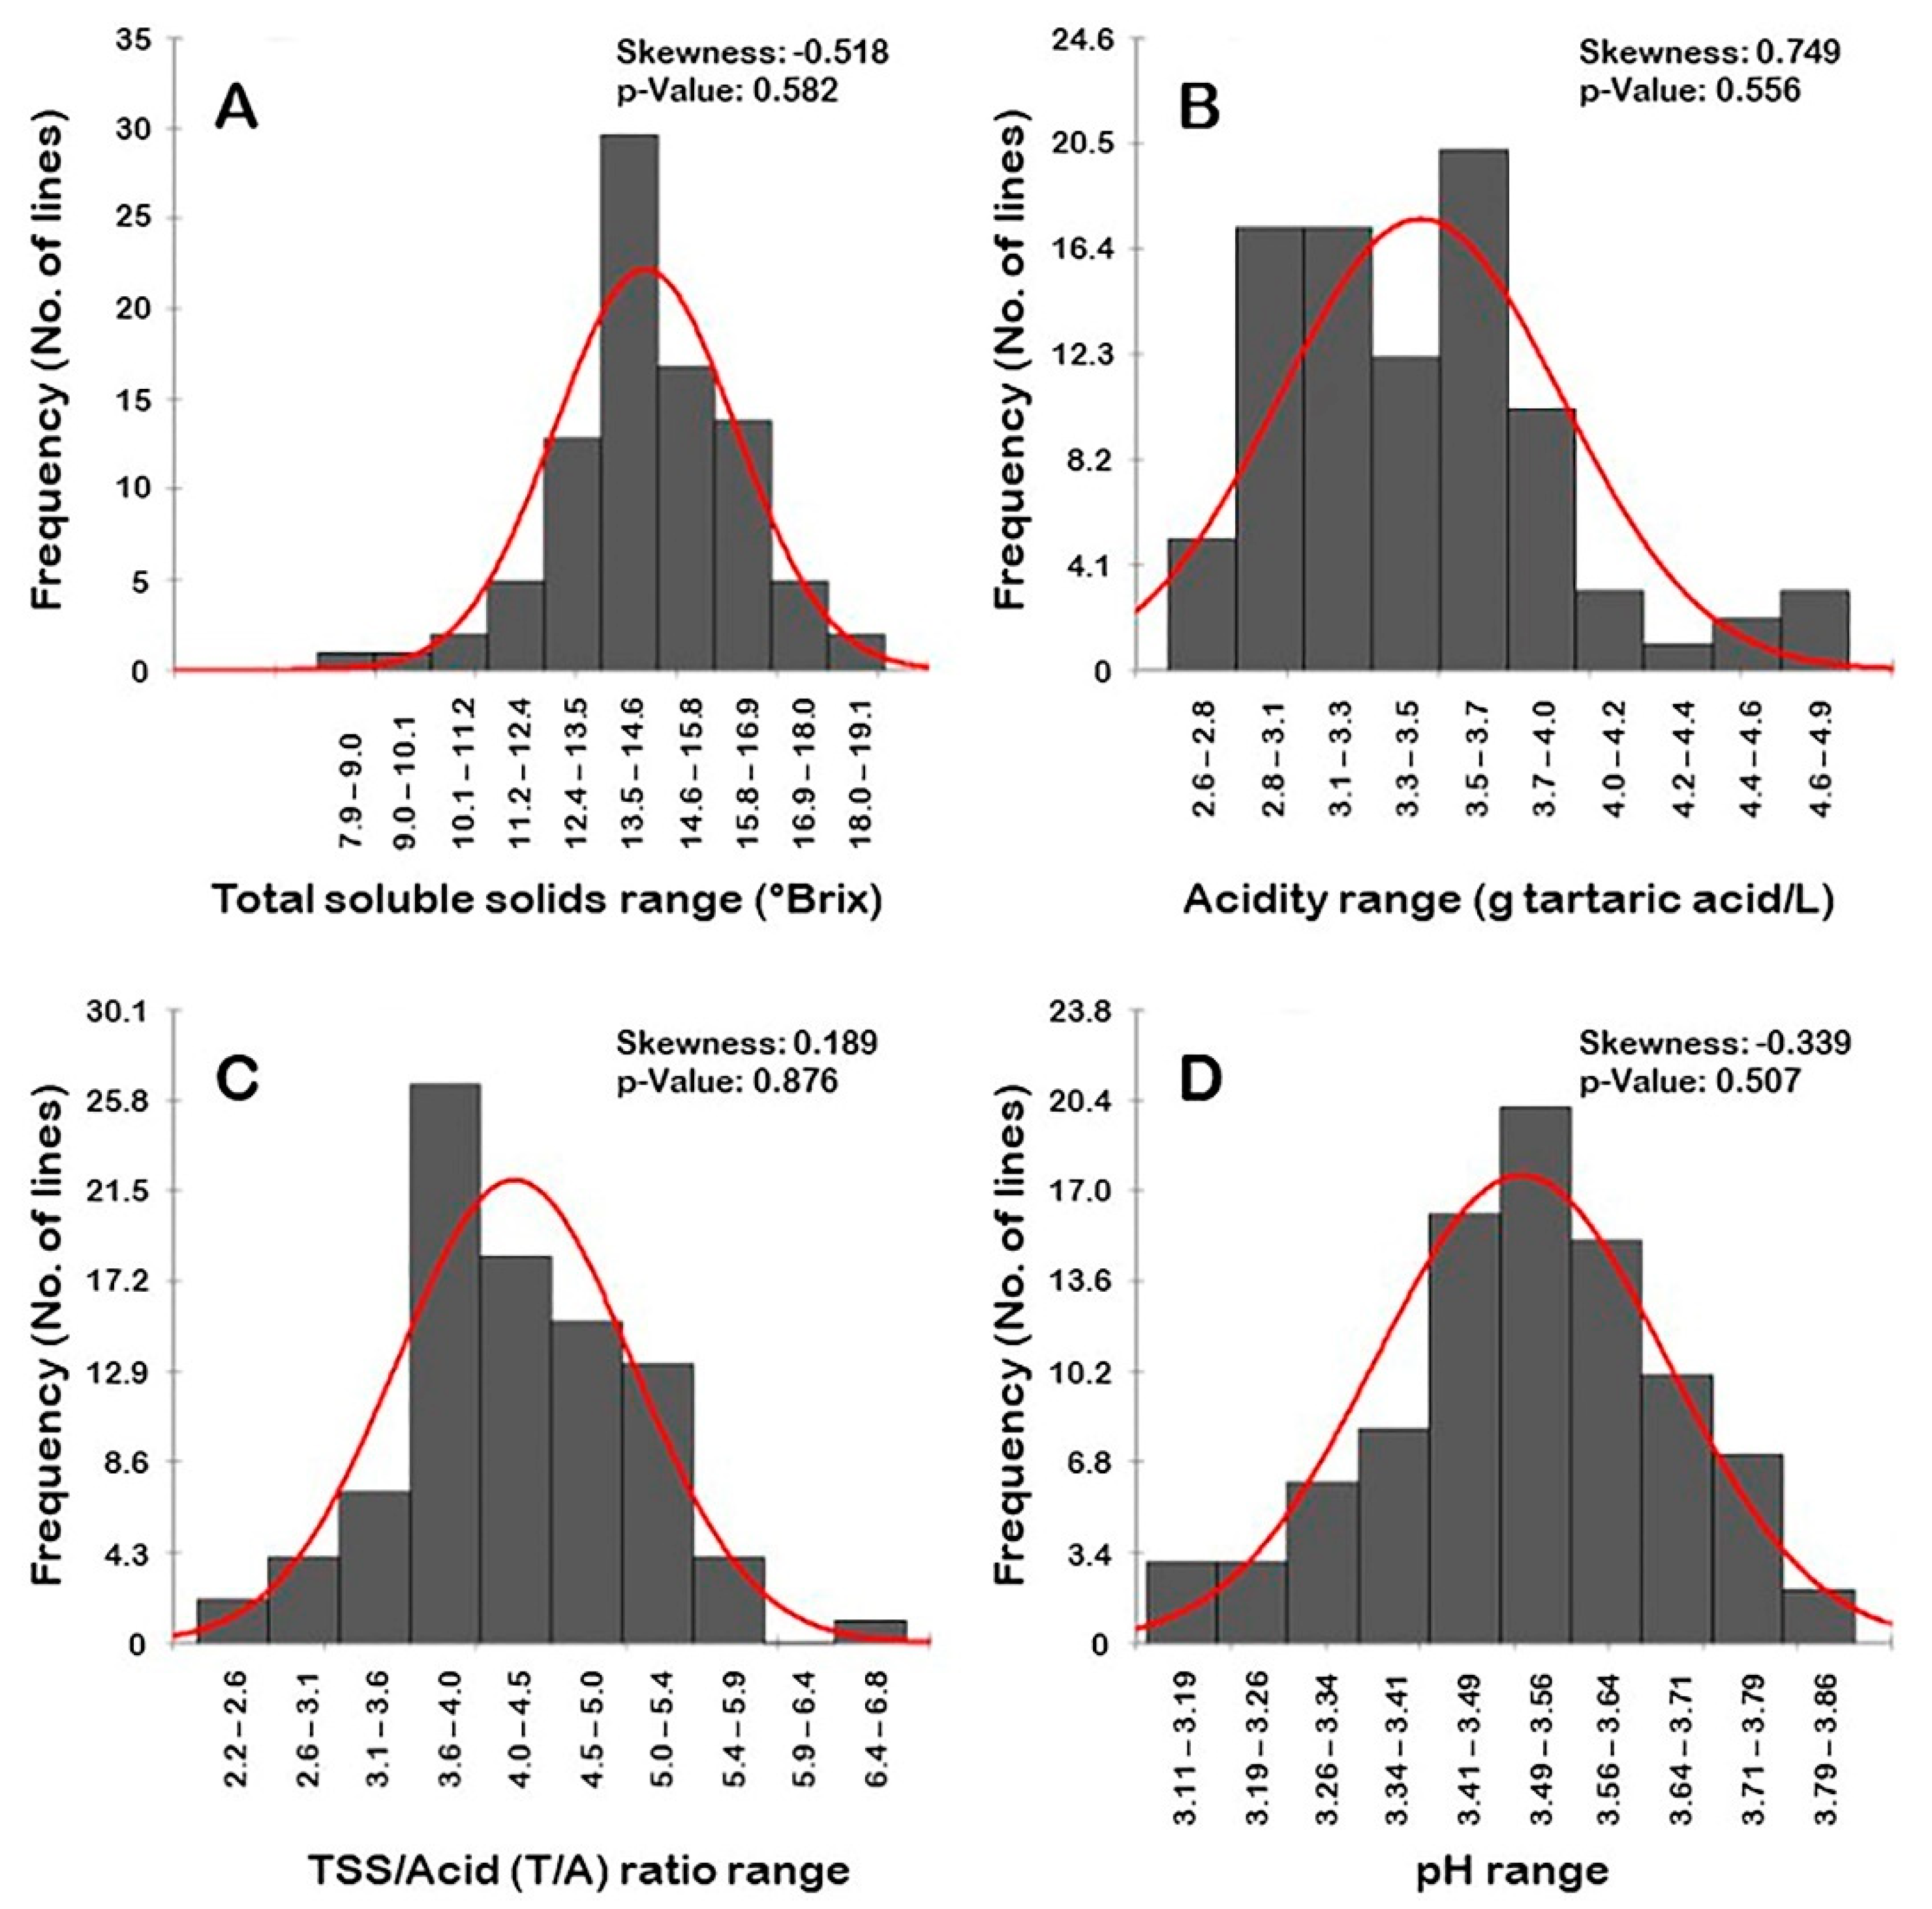
3.1.1. Total Soluble Solids (TSS) Trait
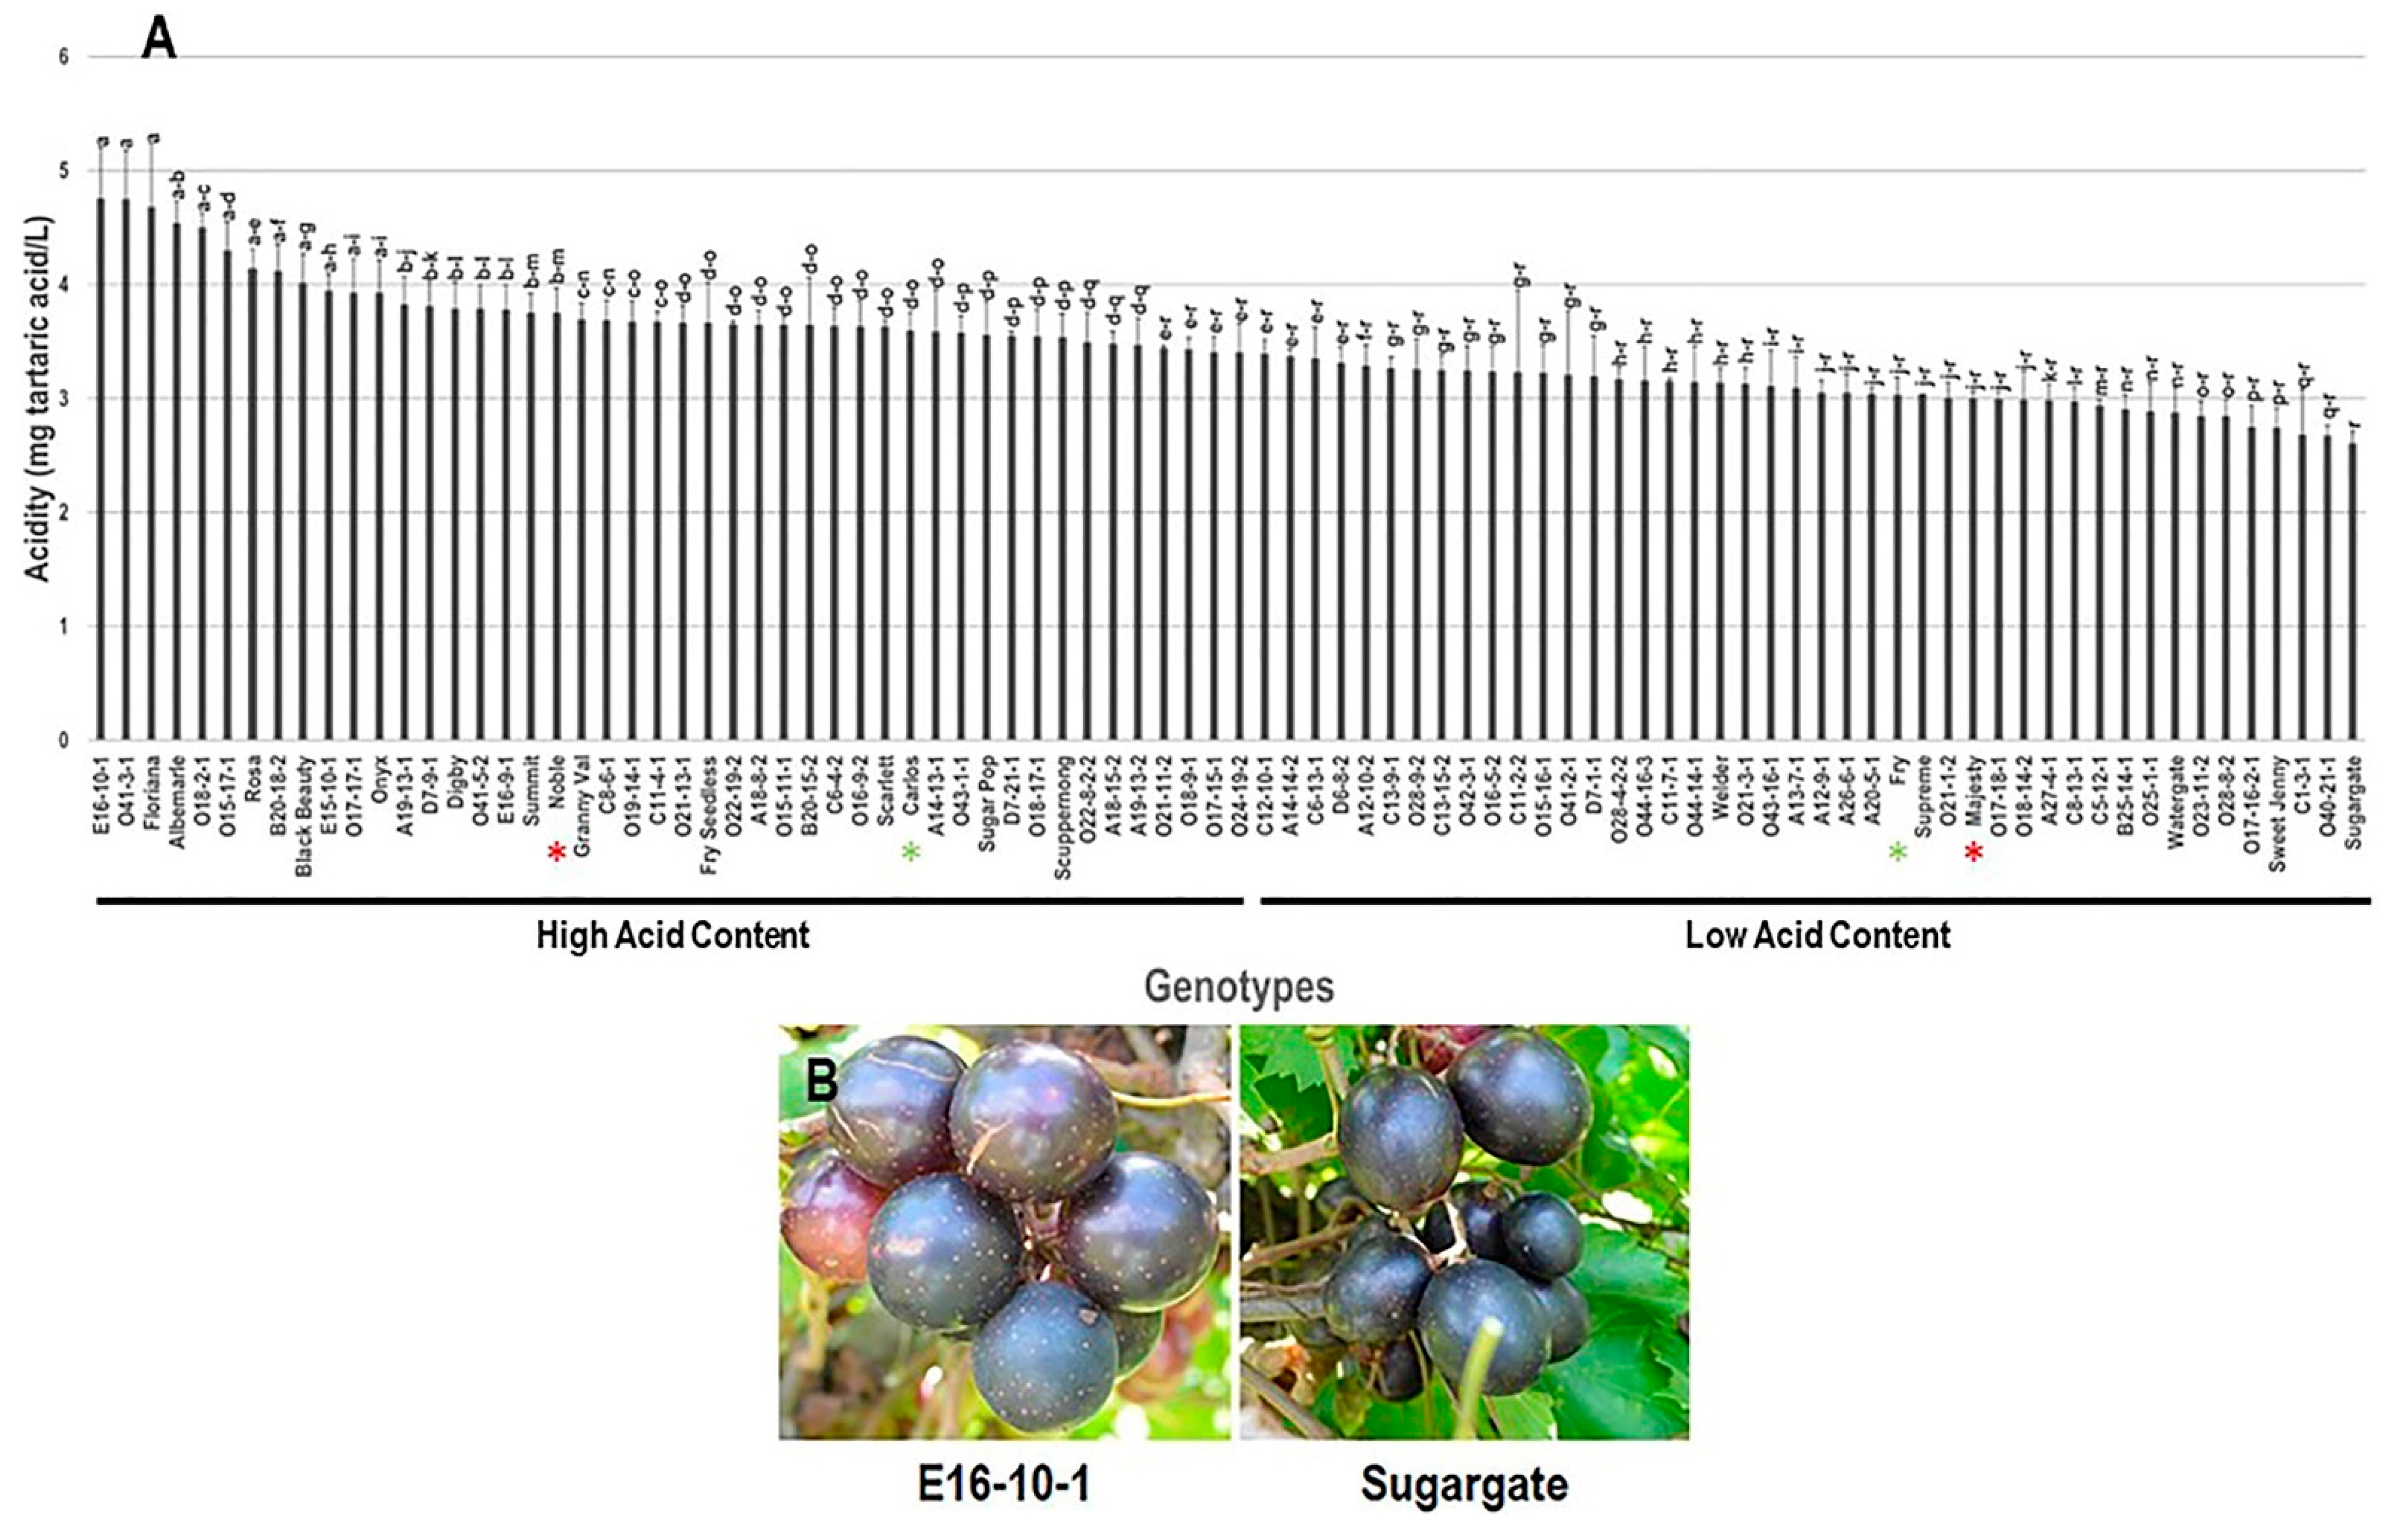
3.1.2. Acidity Trait
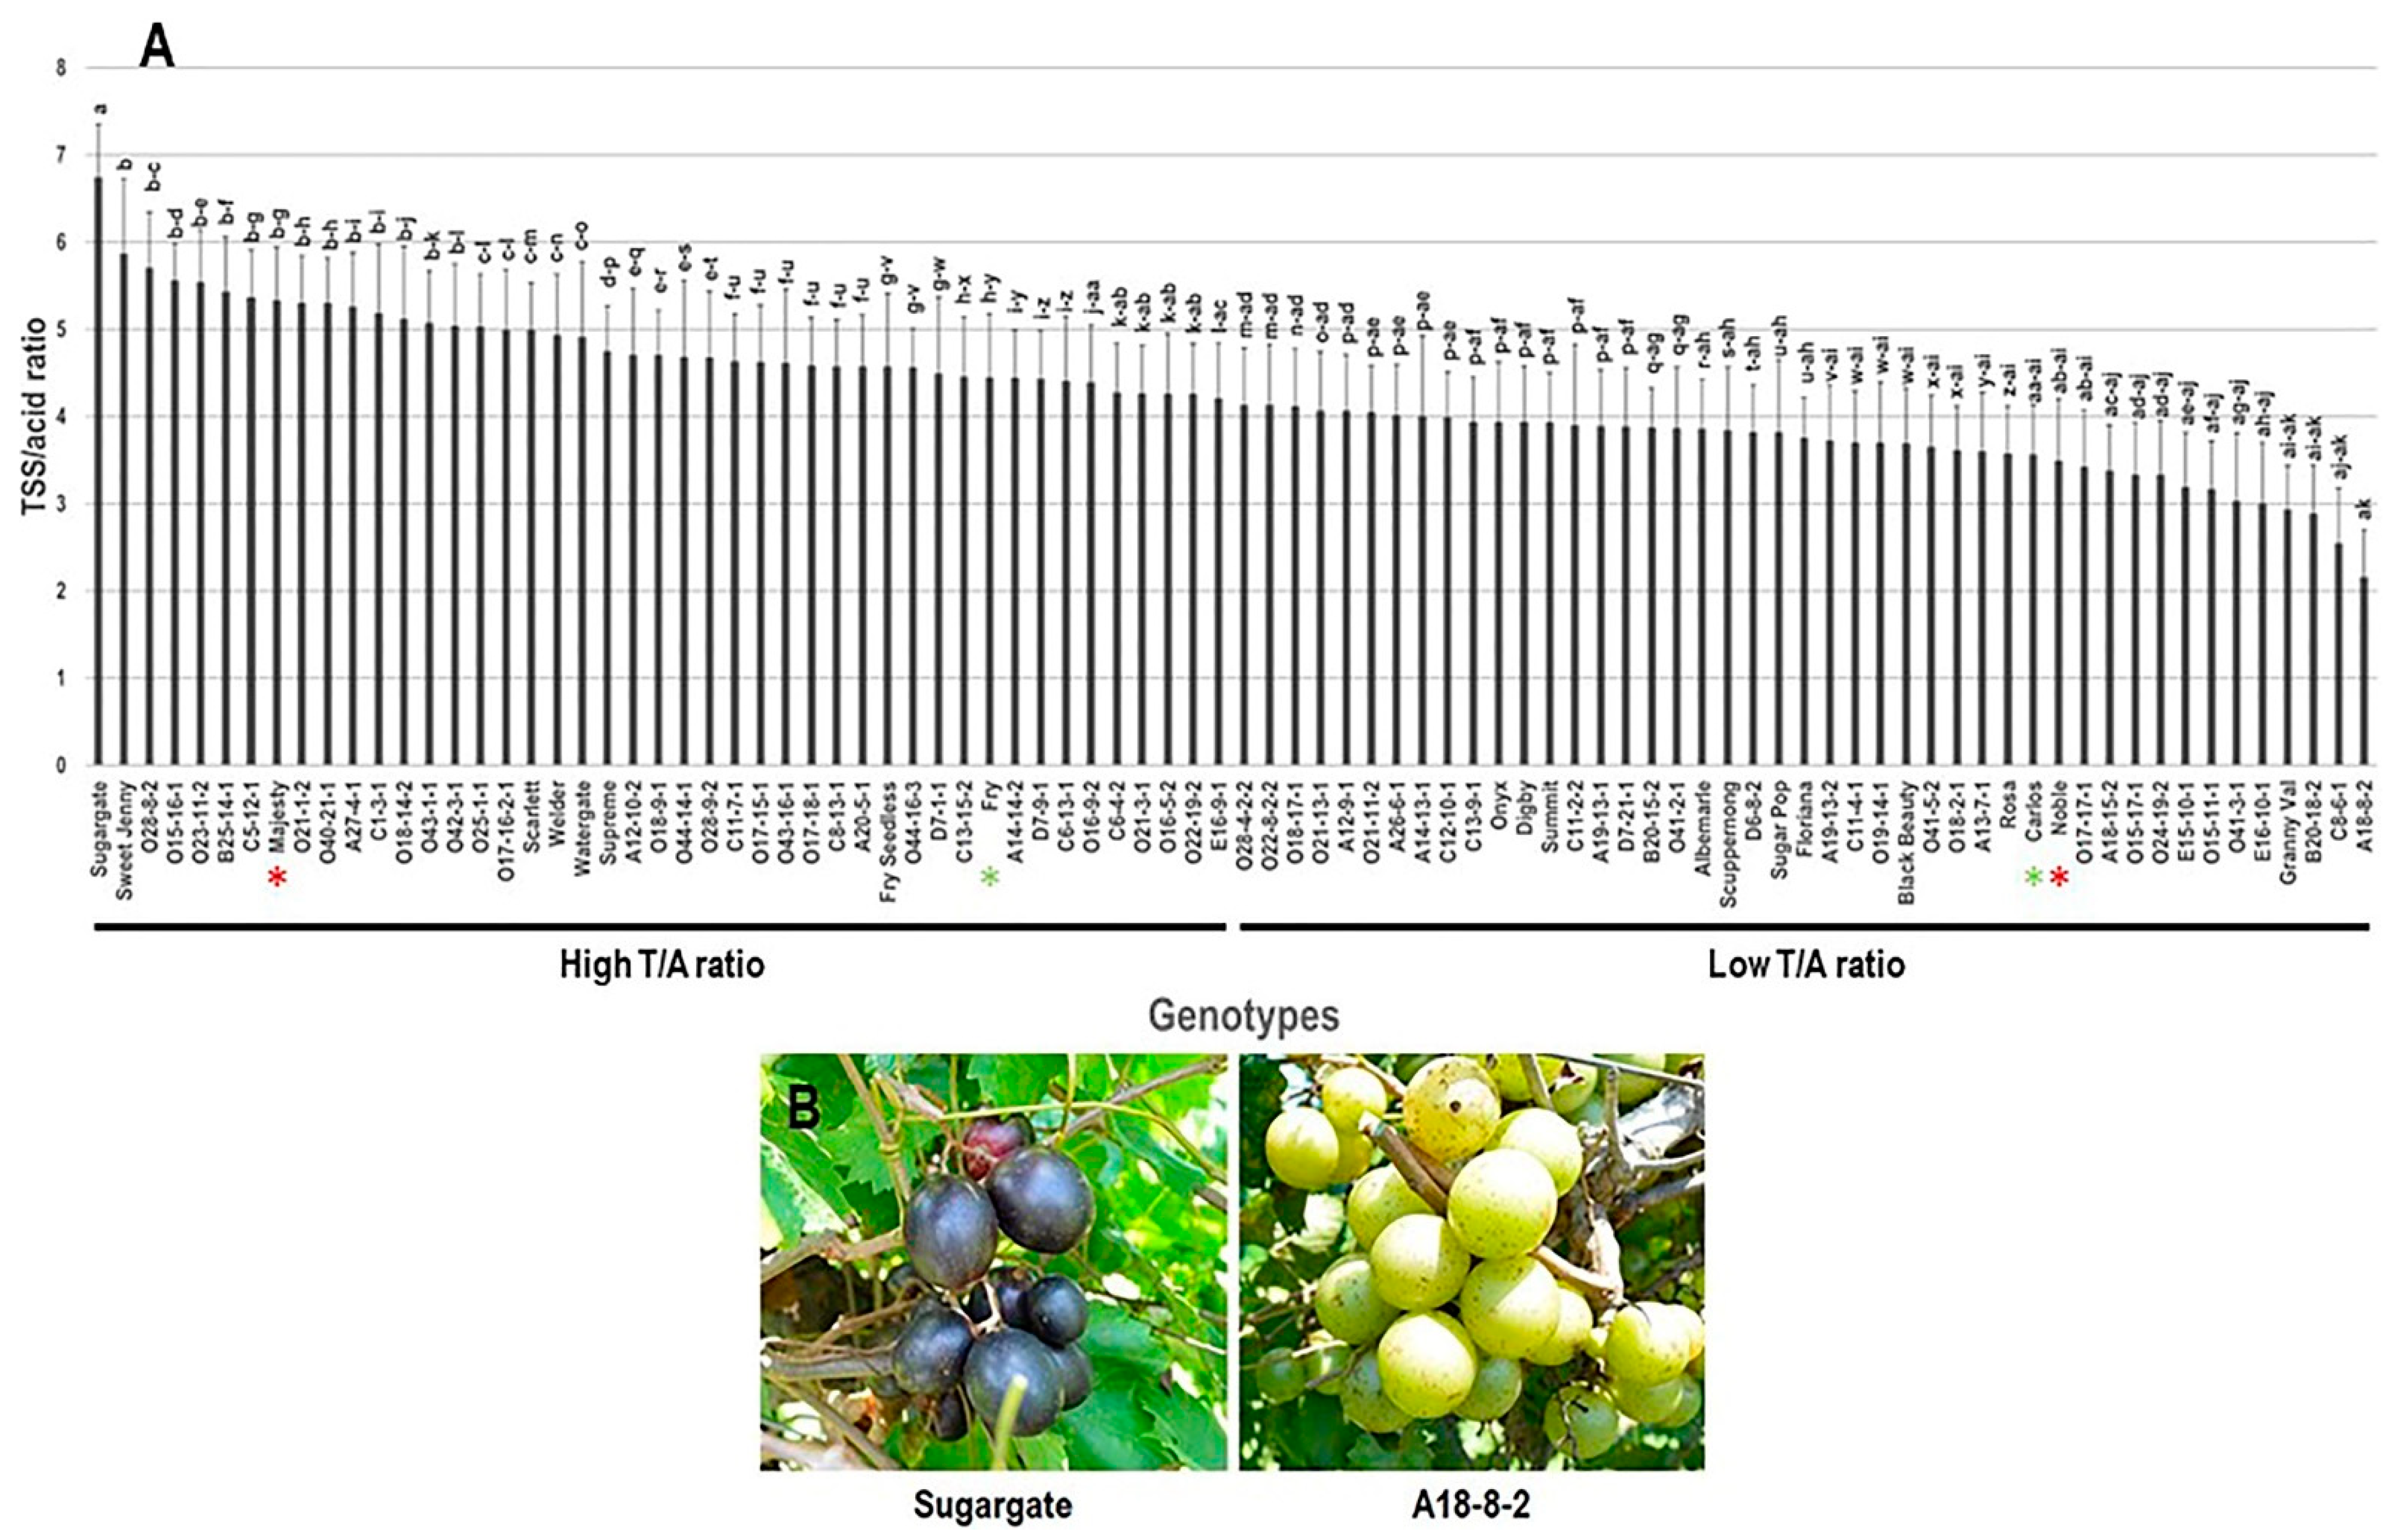
3.1.3. TSS/Acid (T/A) Ratio Trait
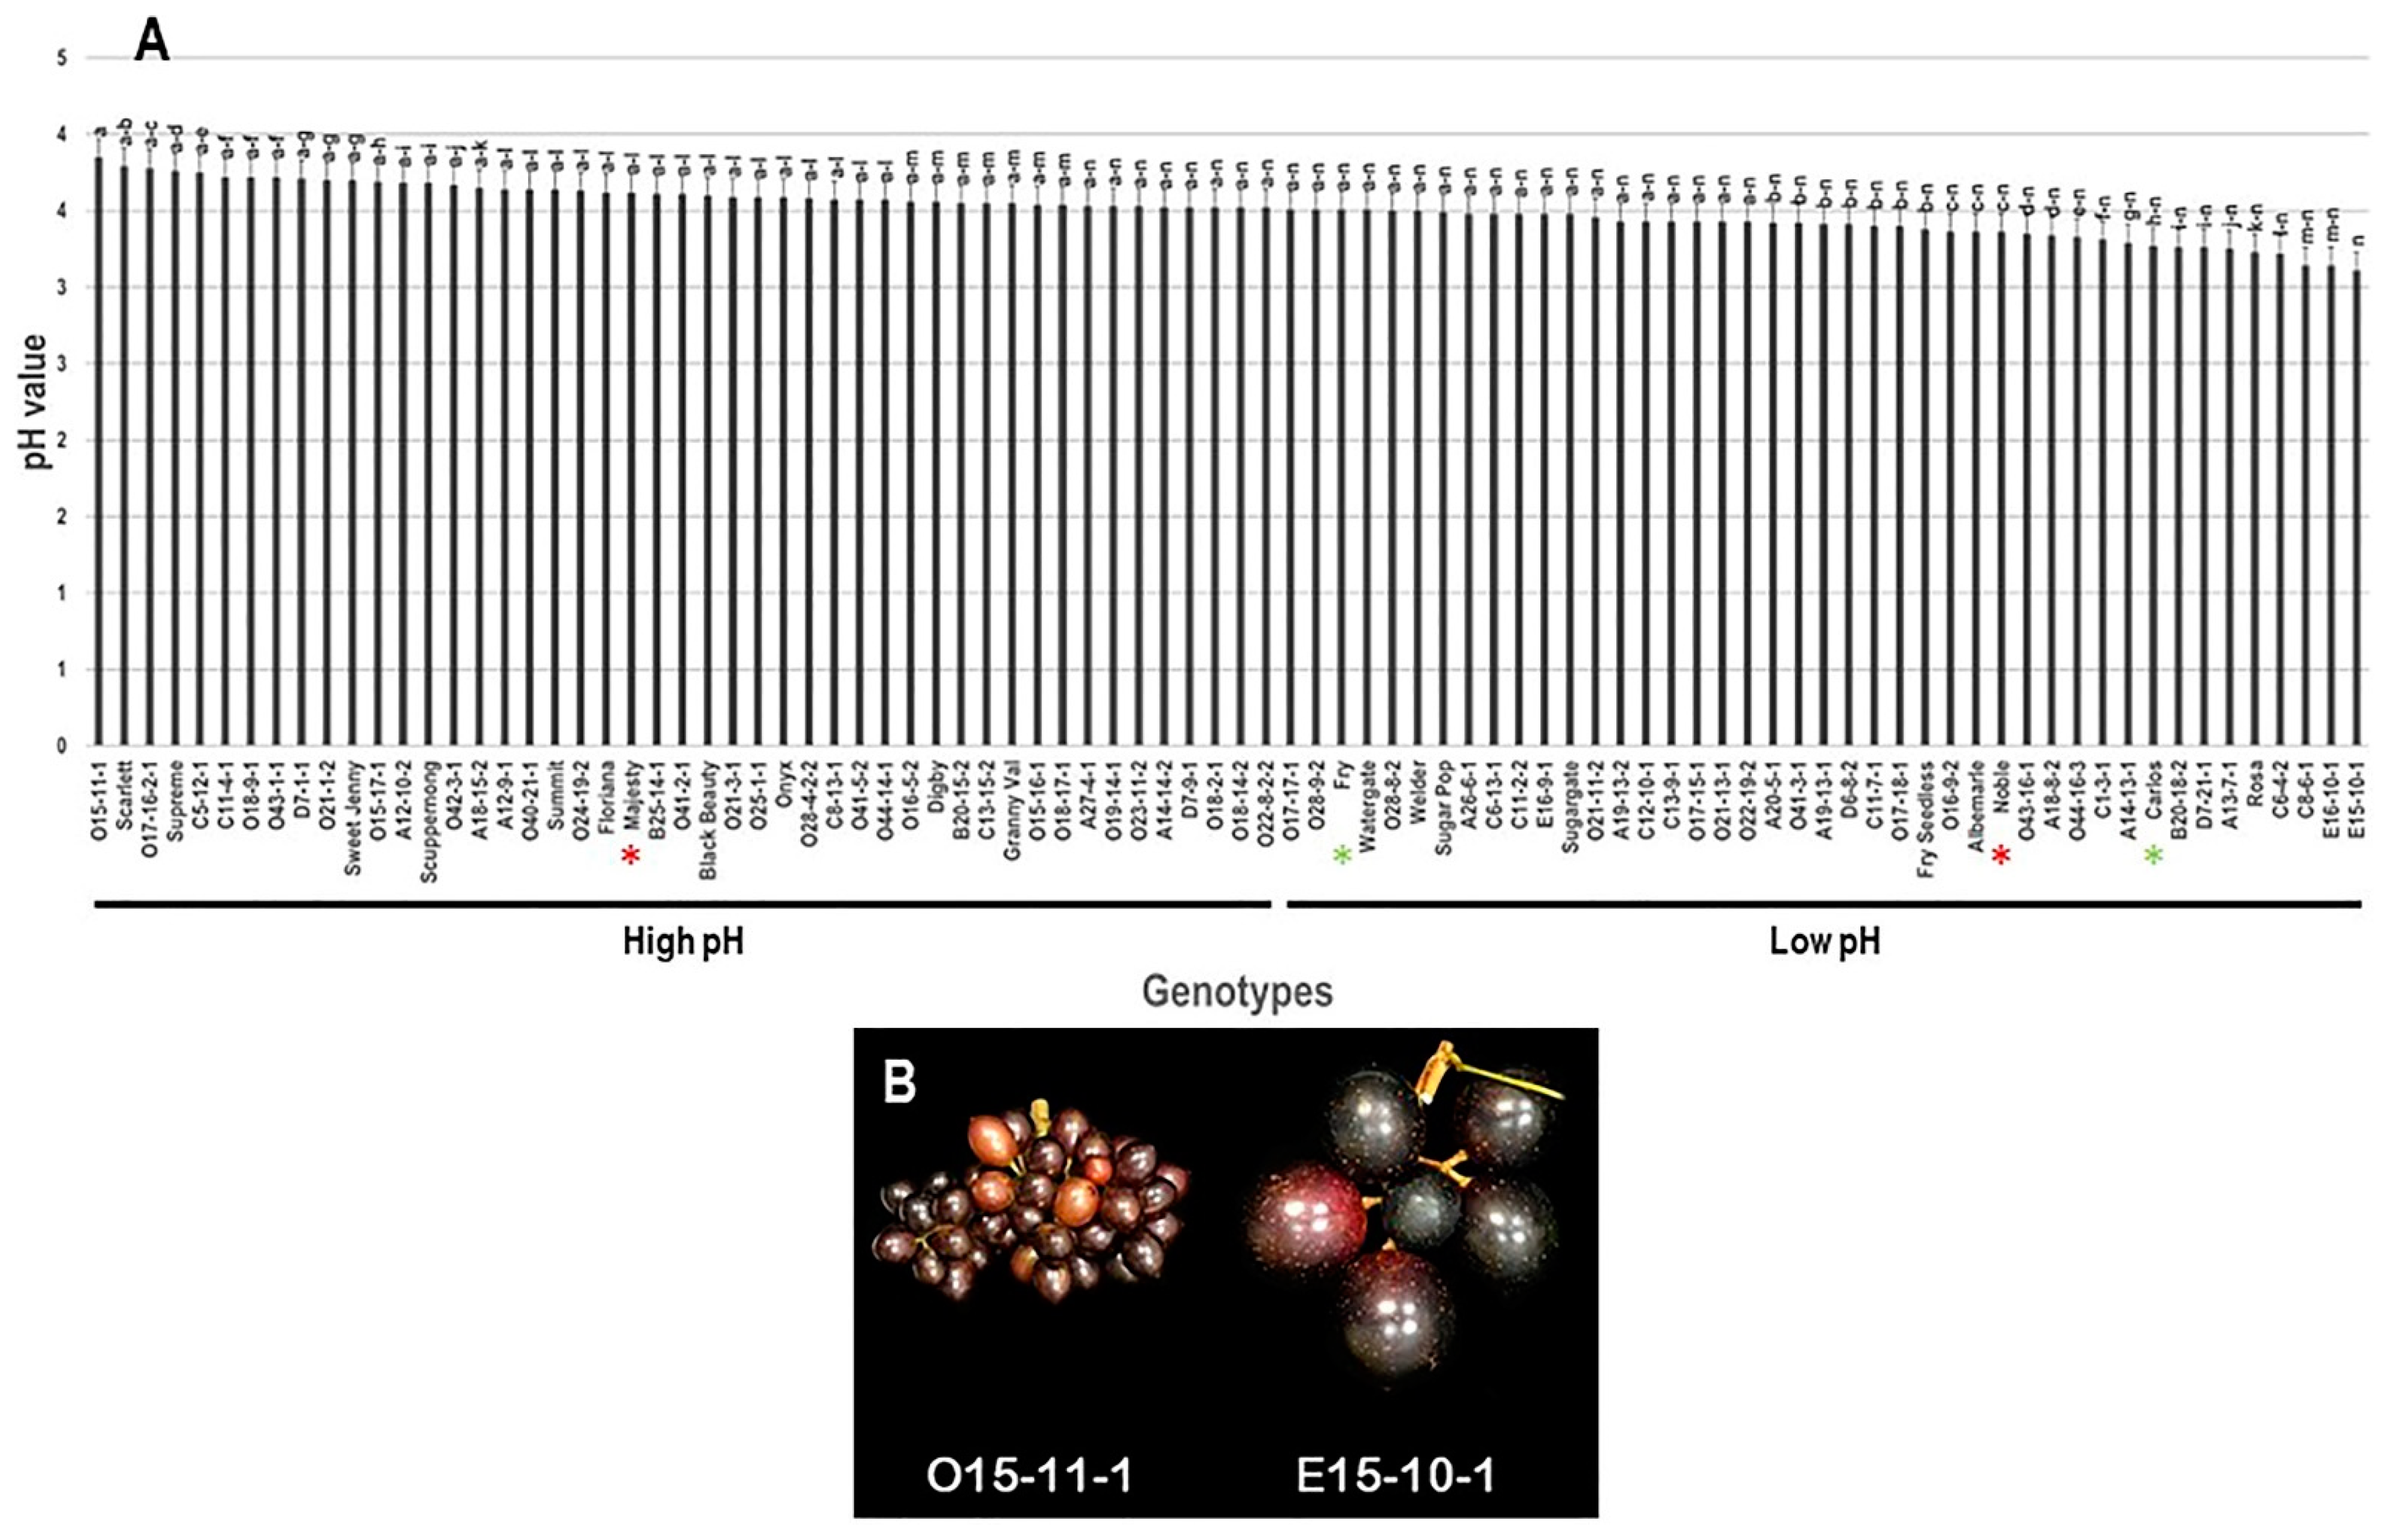
3.1.4. pH Trait
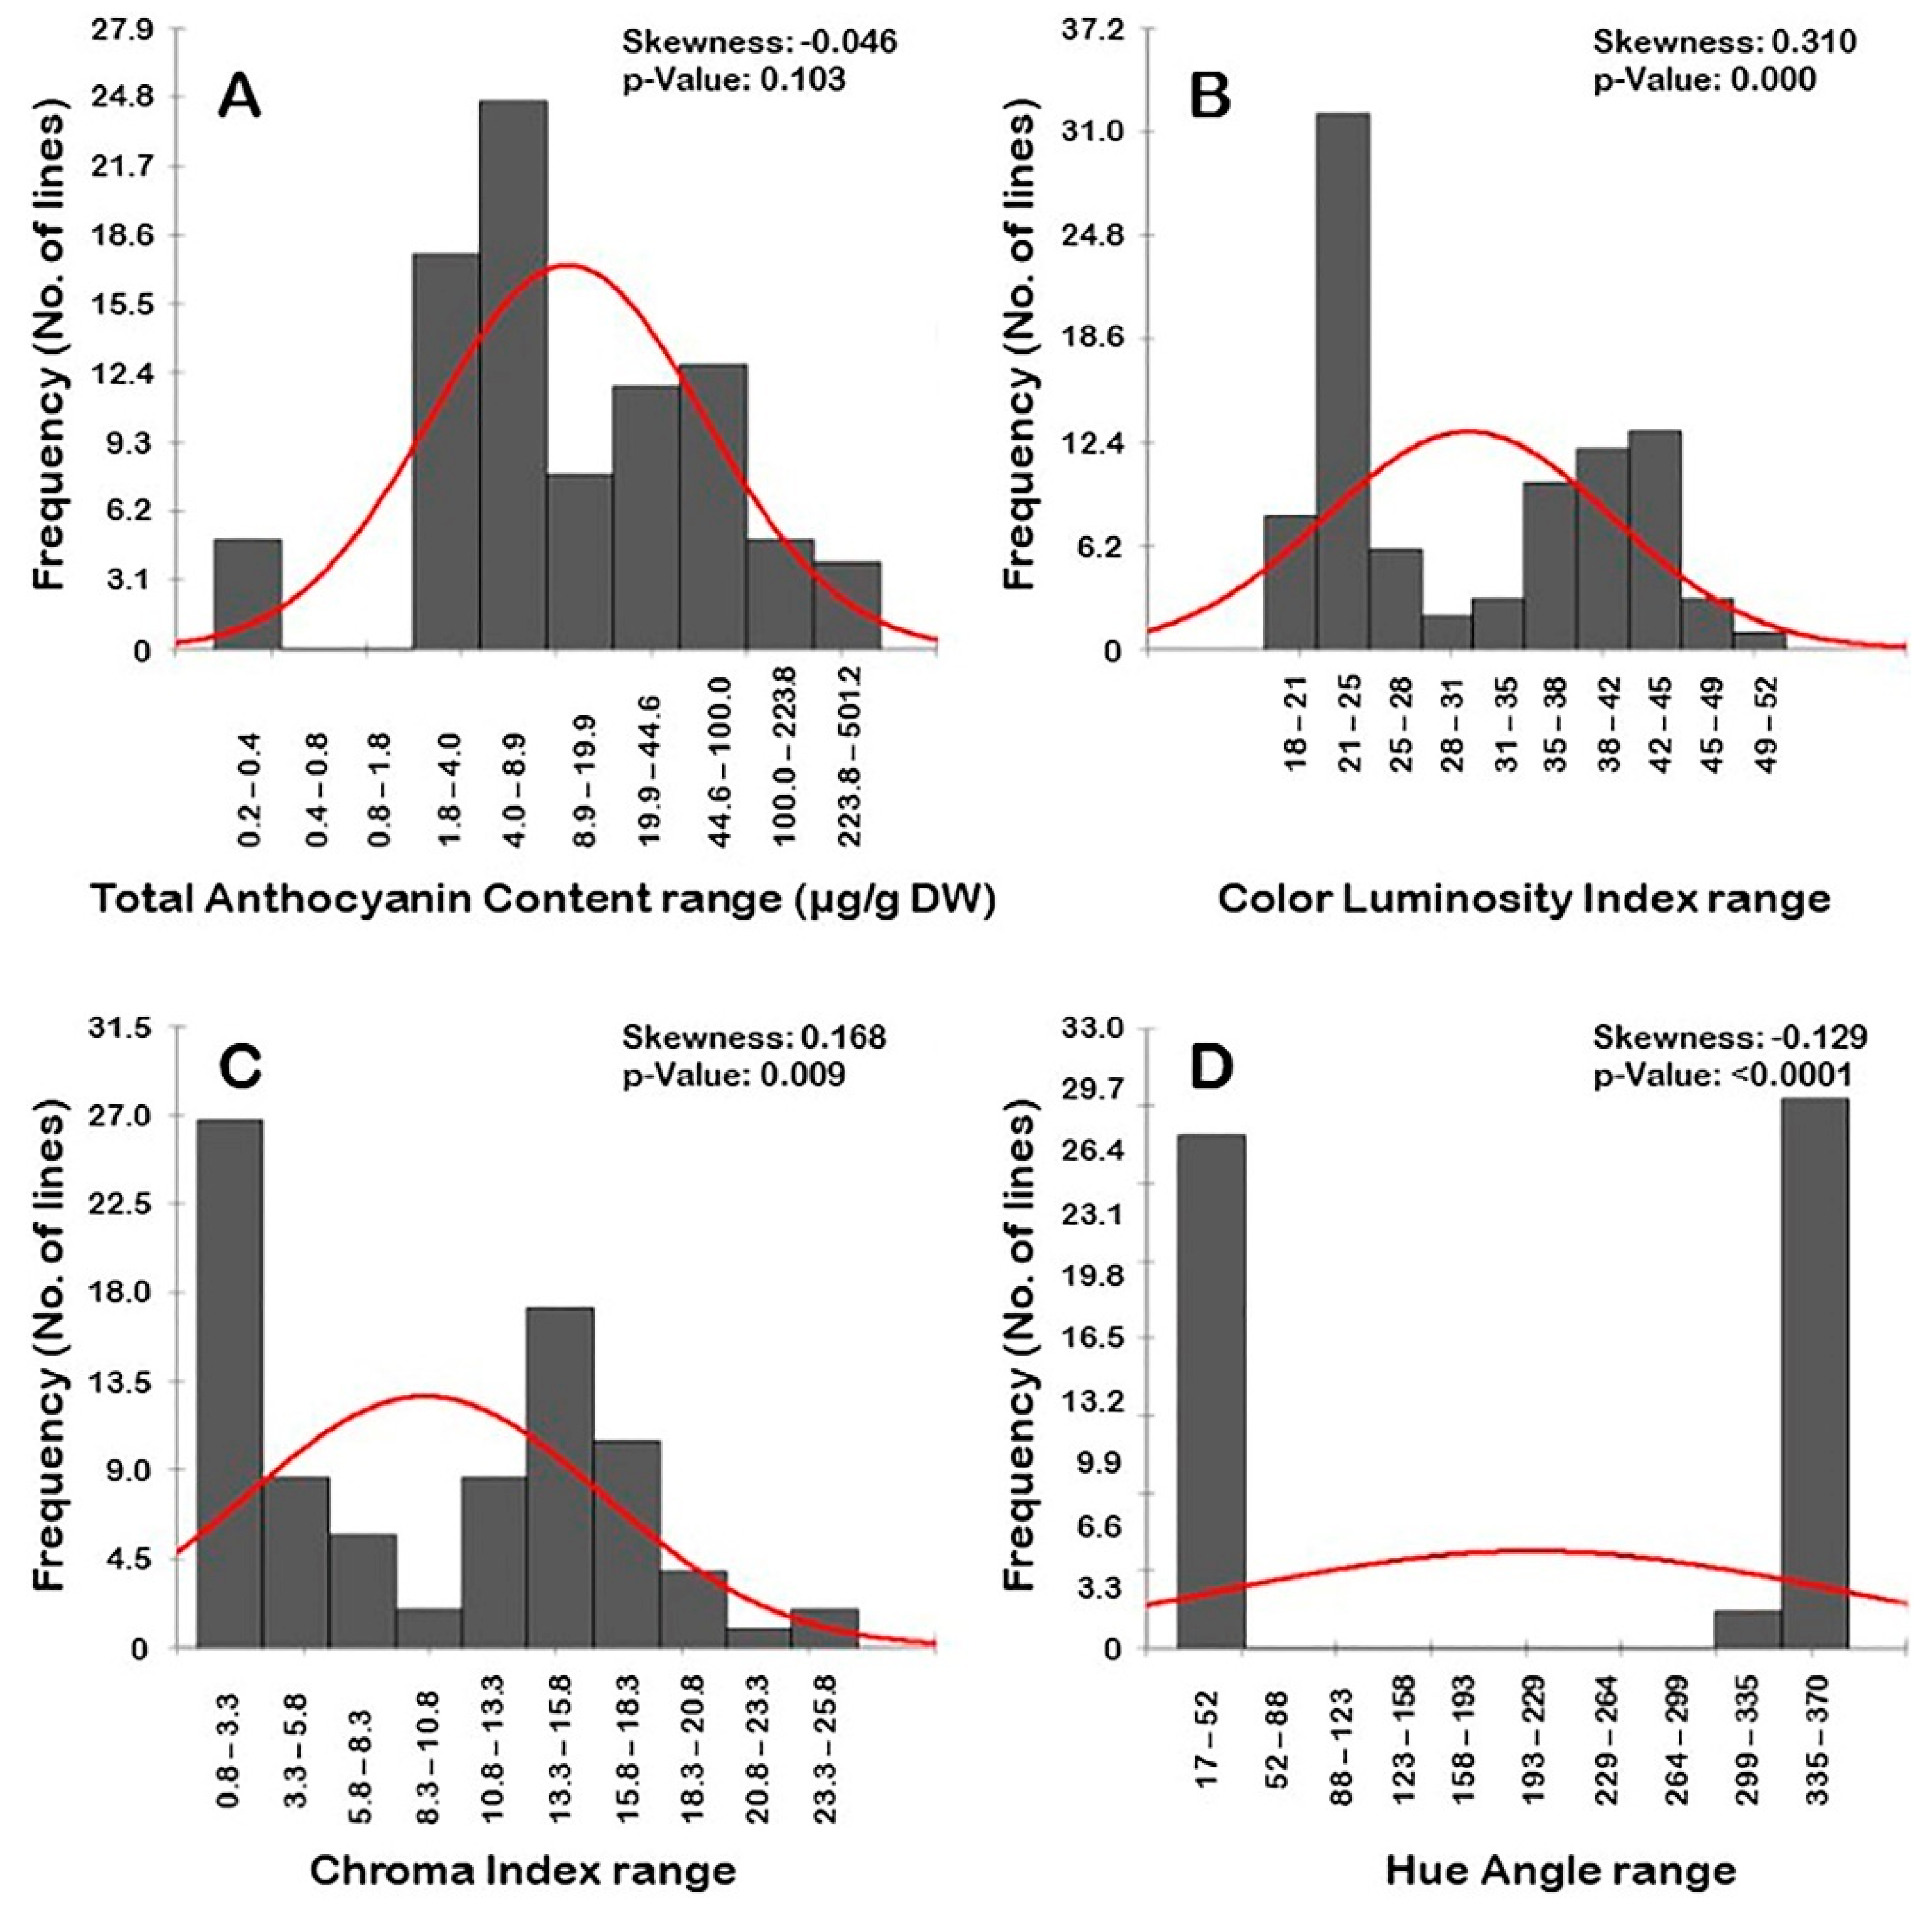
3.1.5. Frequency Distribution of Berry Biochemical Traits
3.2. Color-Related Traits
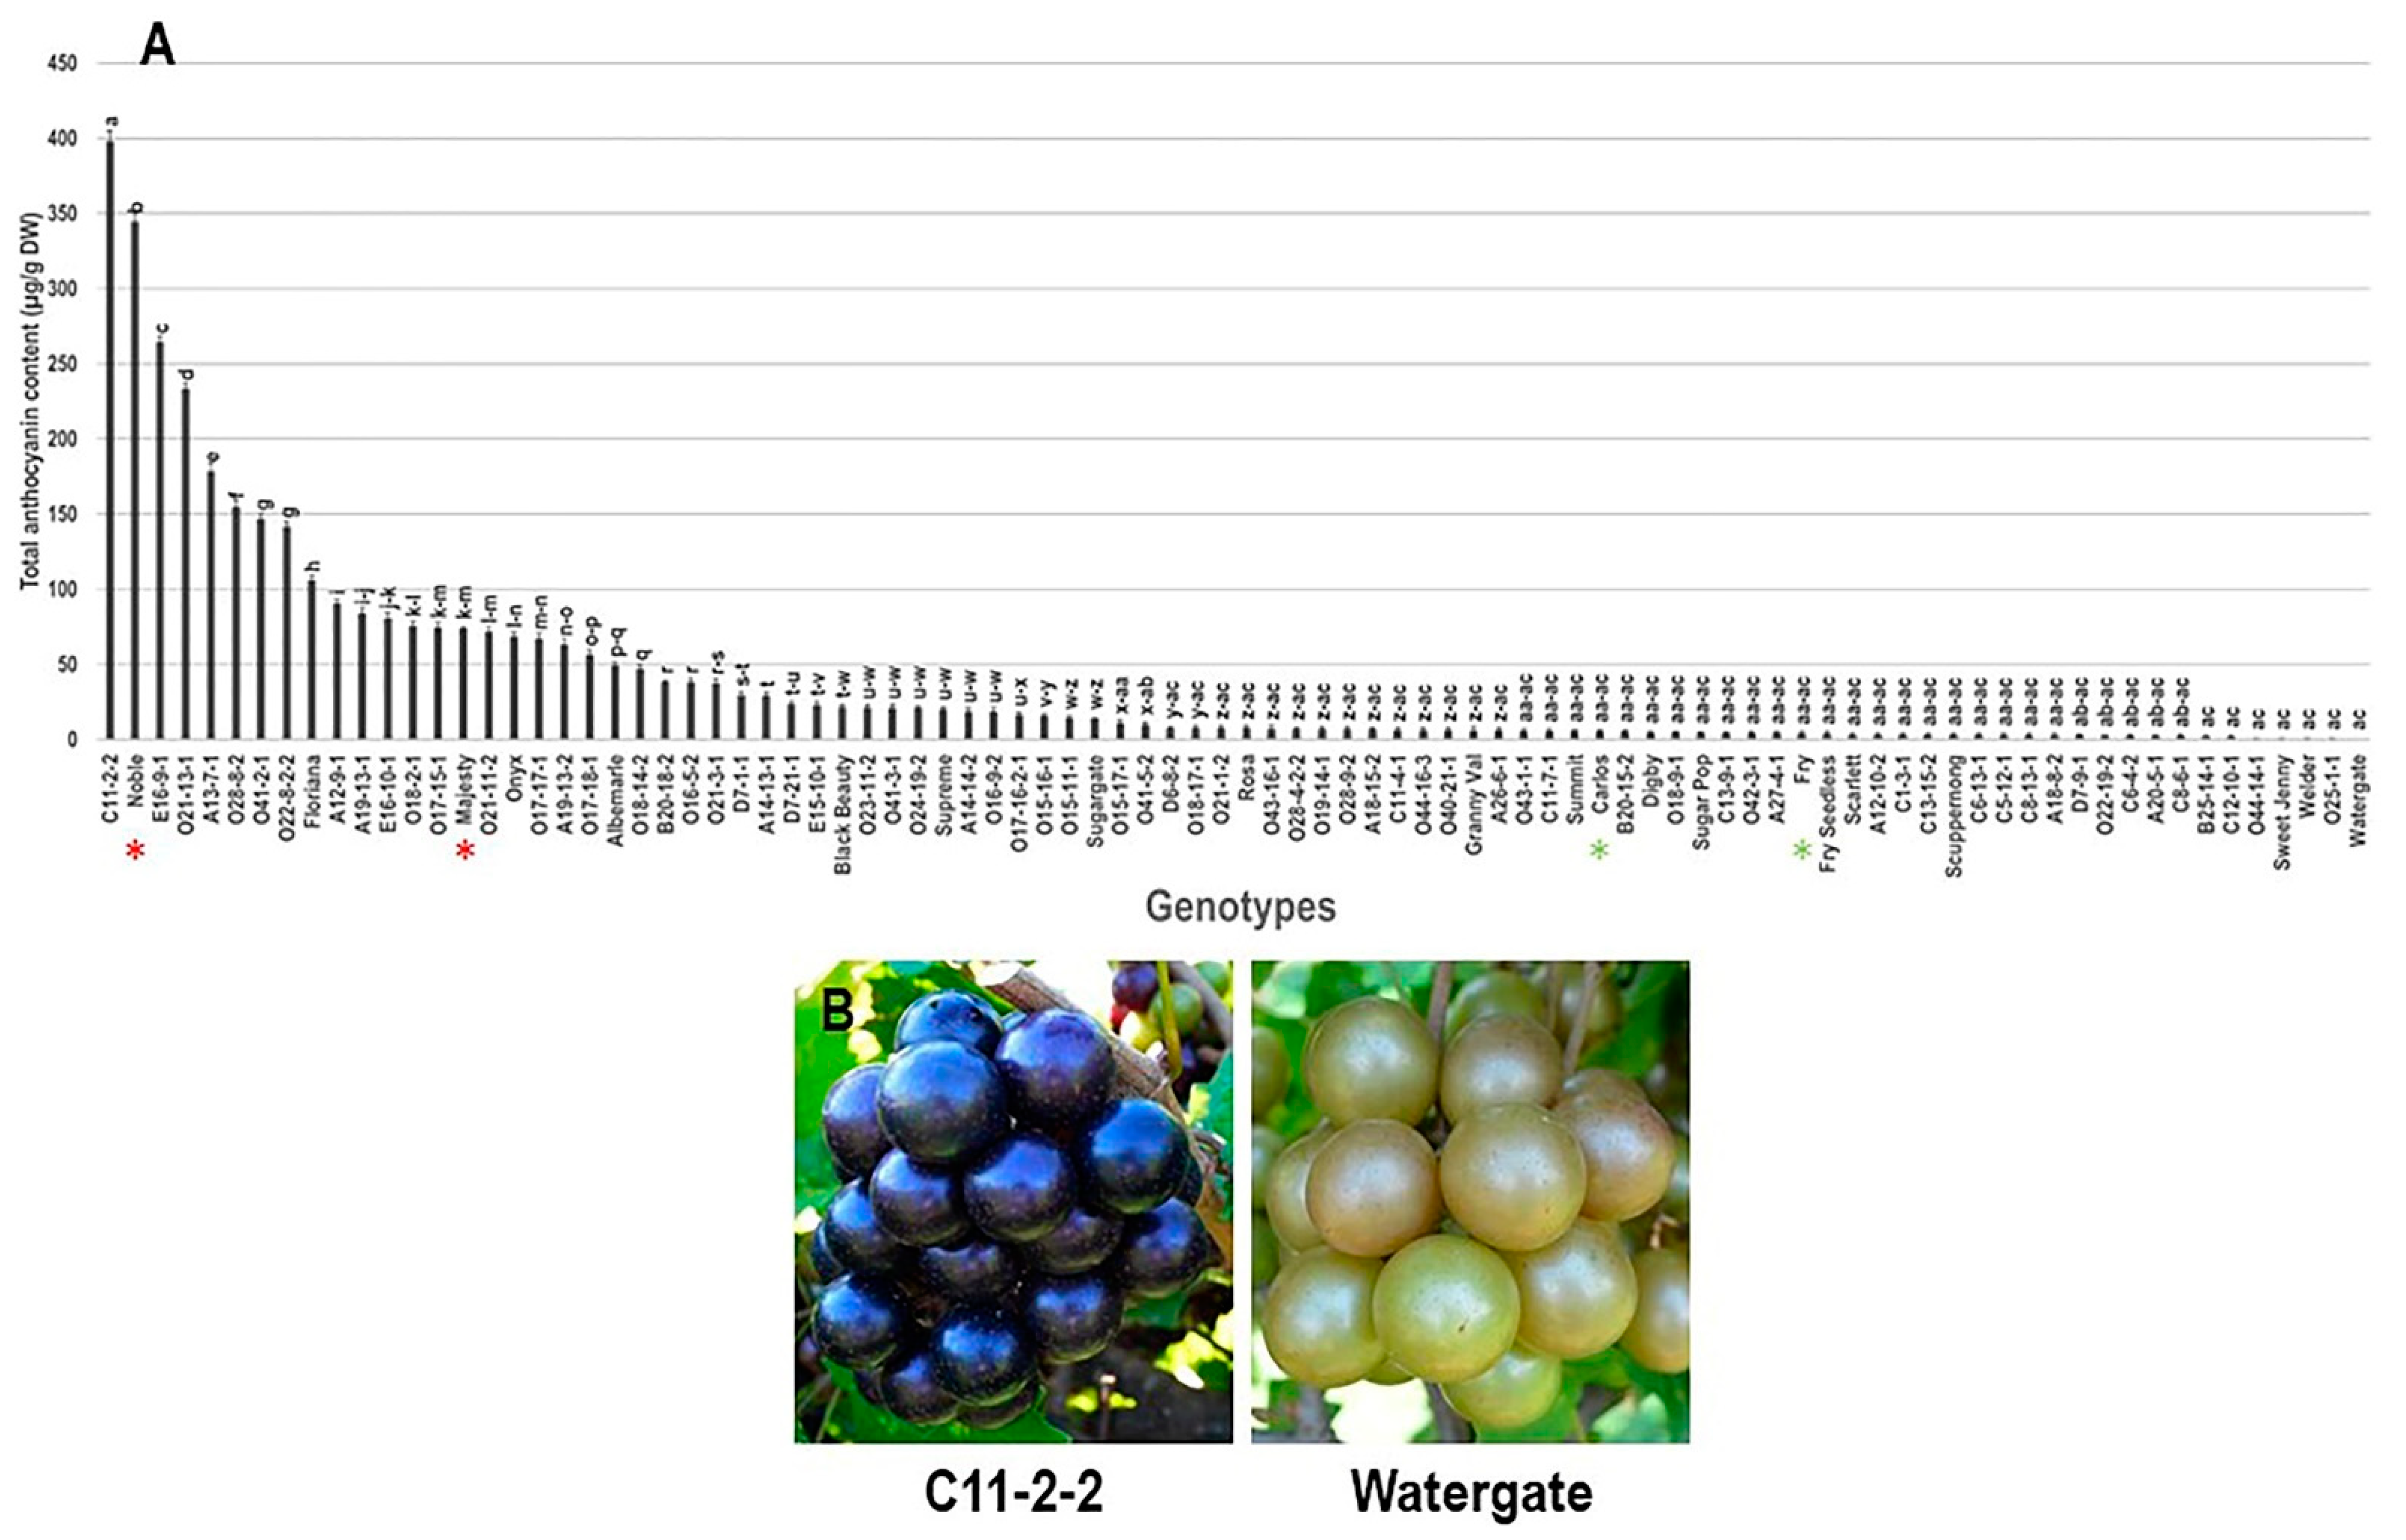
3.2.1. Total Anthocyanin Content (TAC) Trait
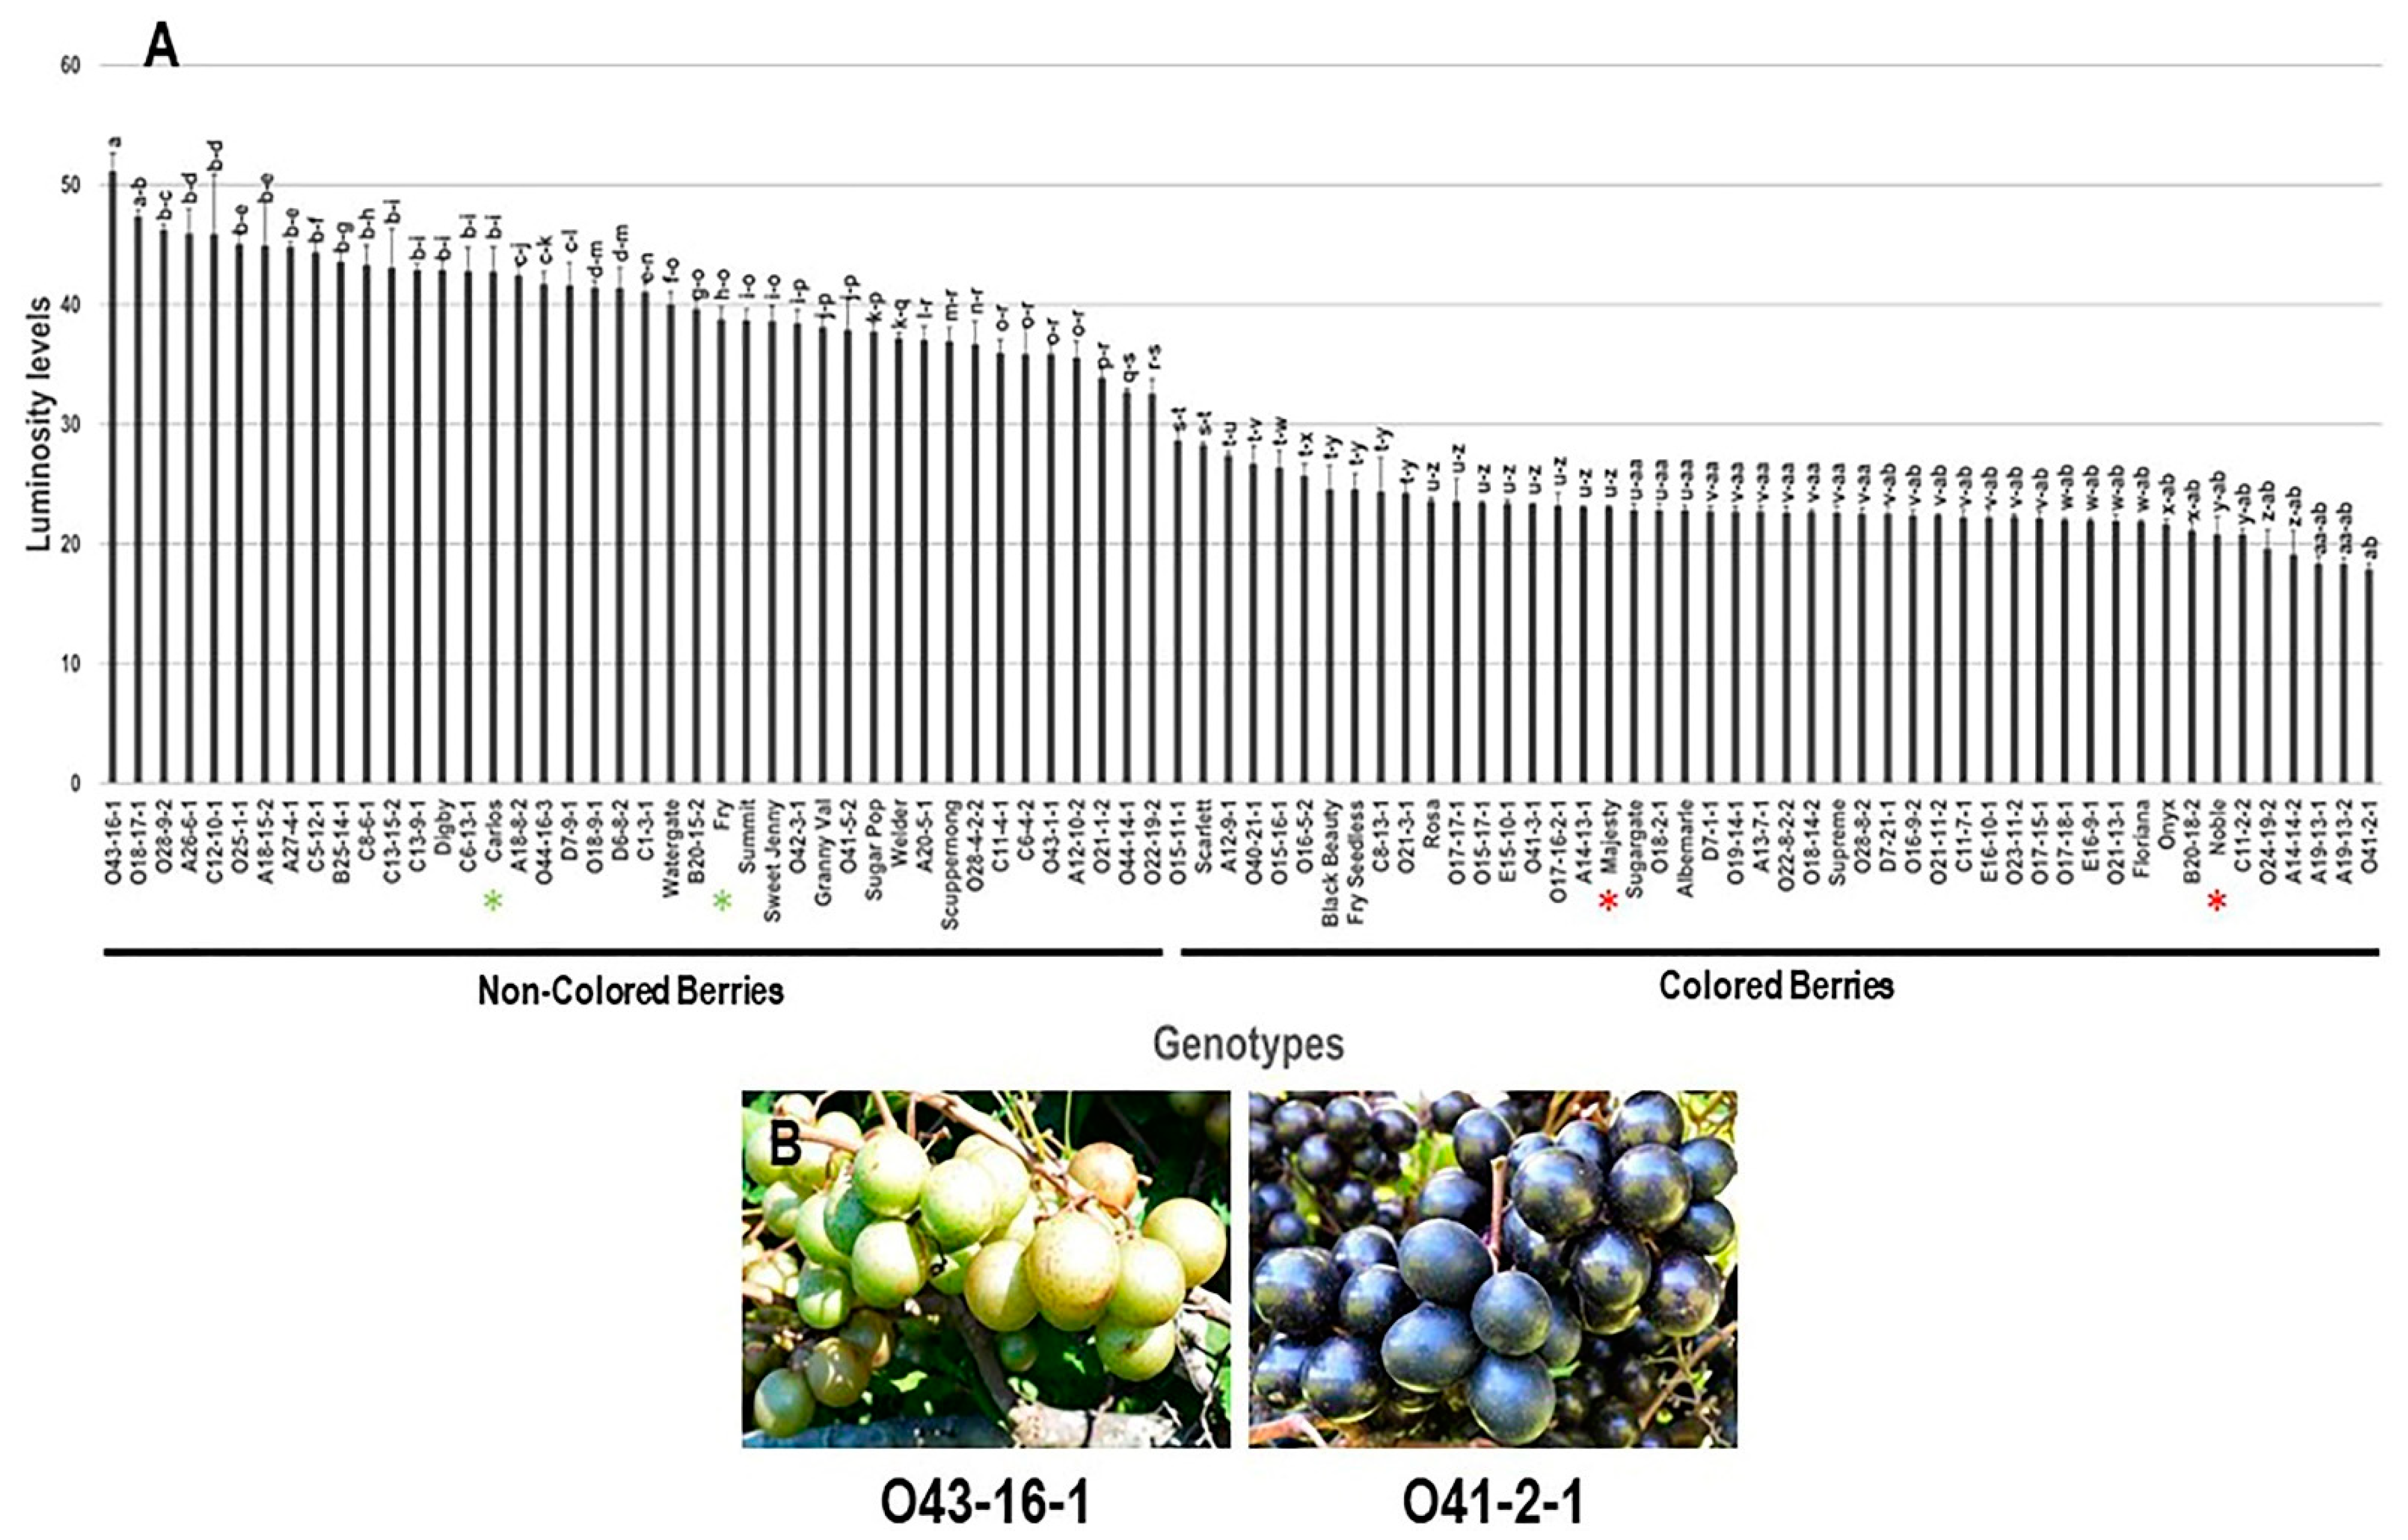
3.2.2. Color Luminosity Index (L*) Trait
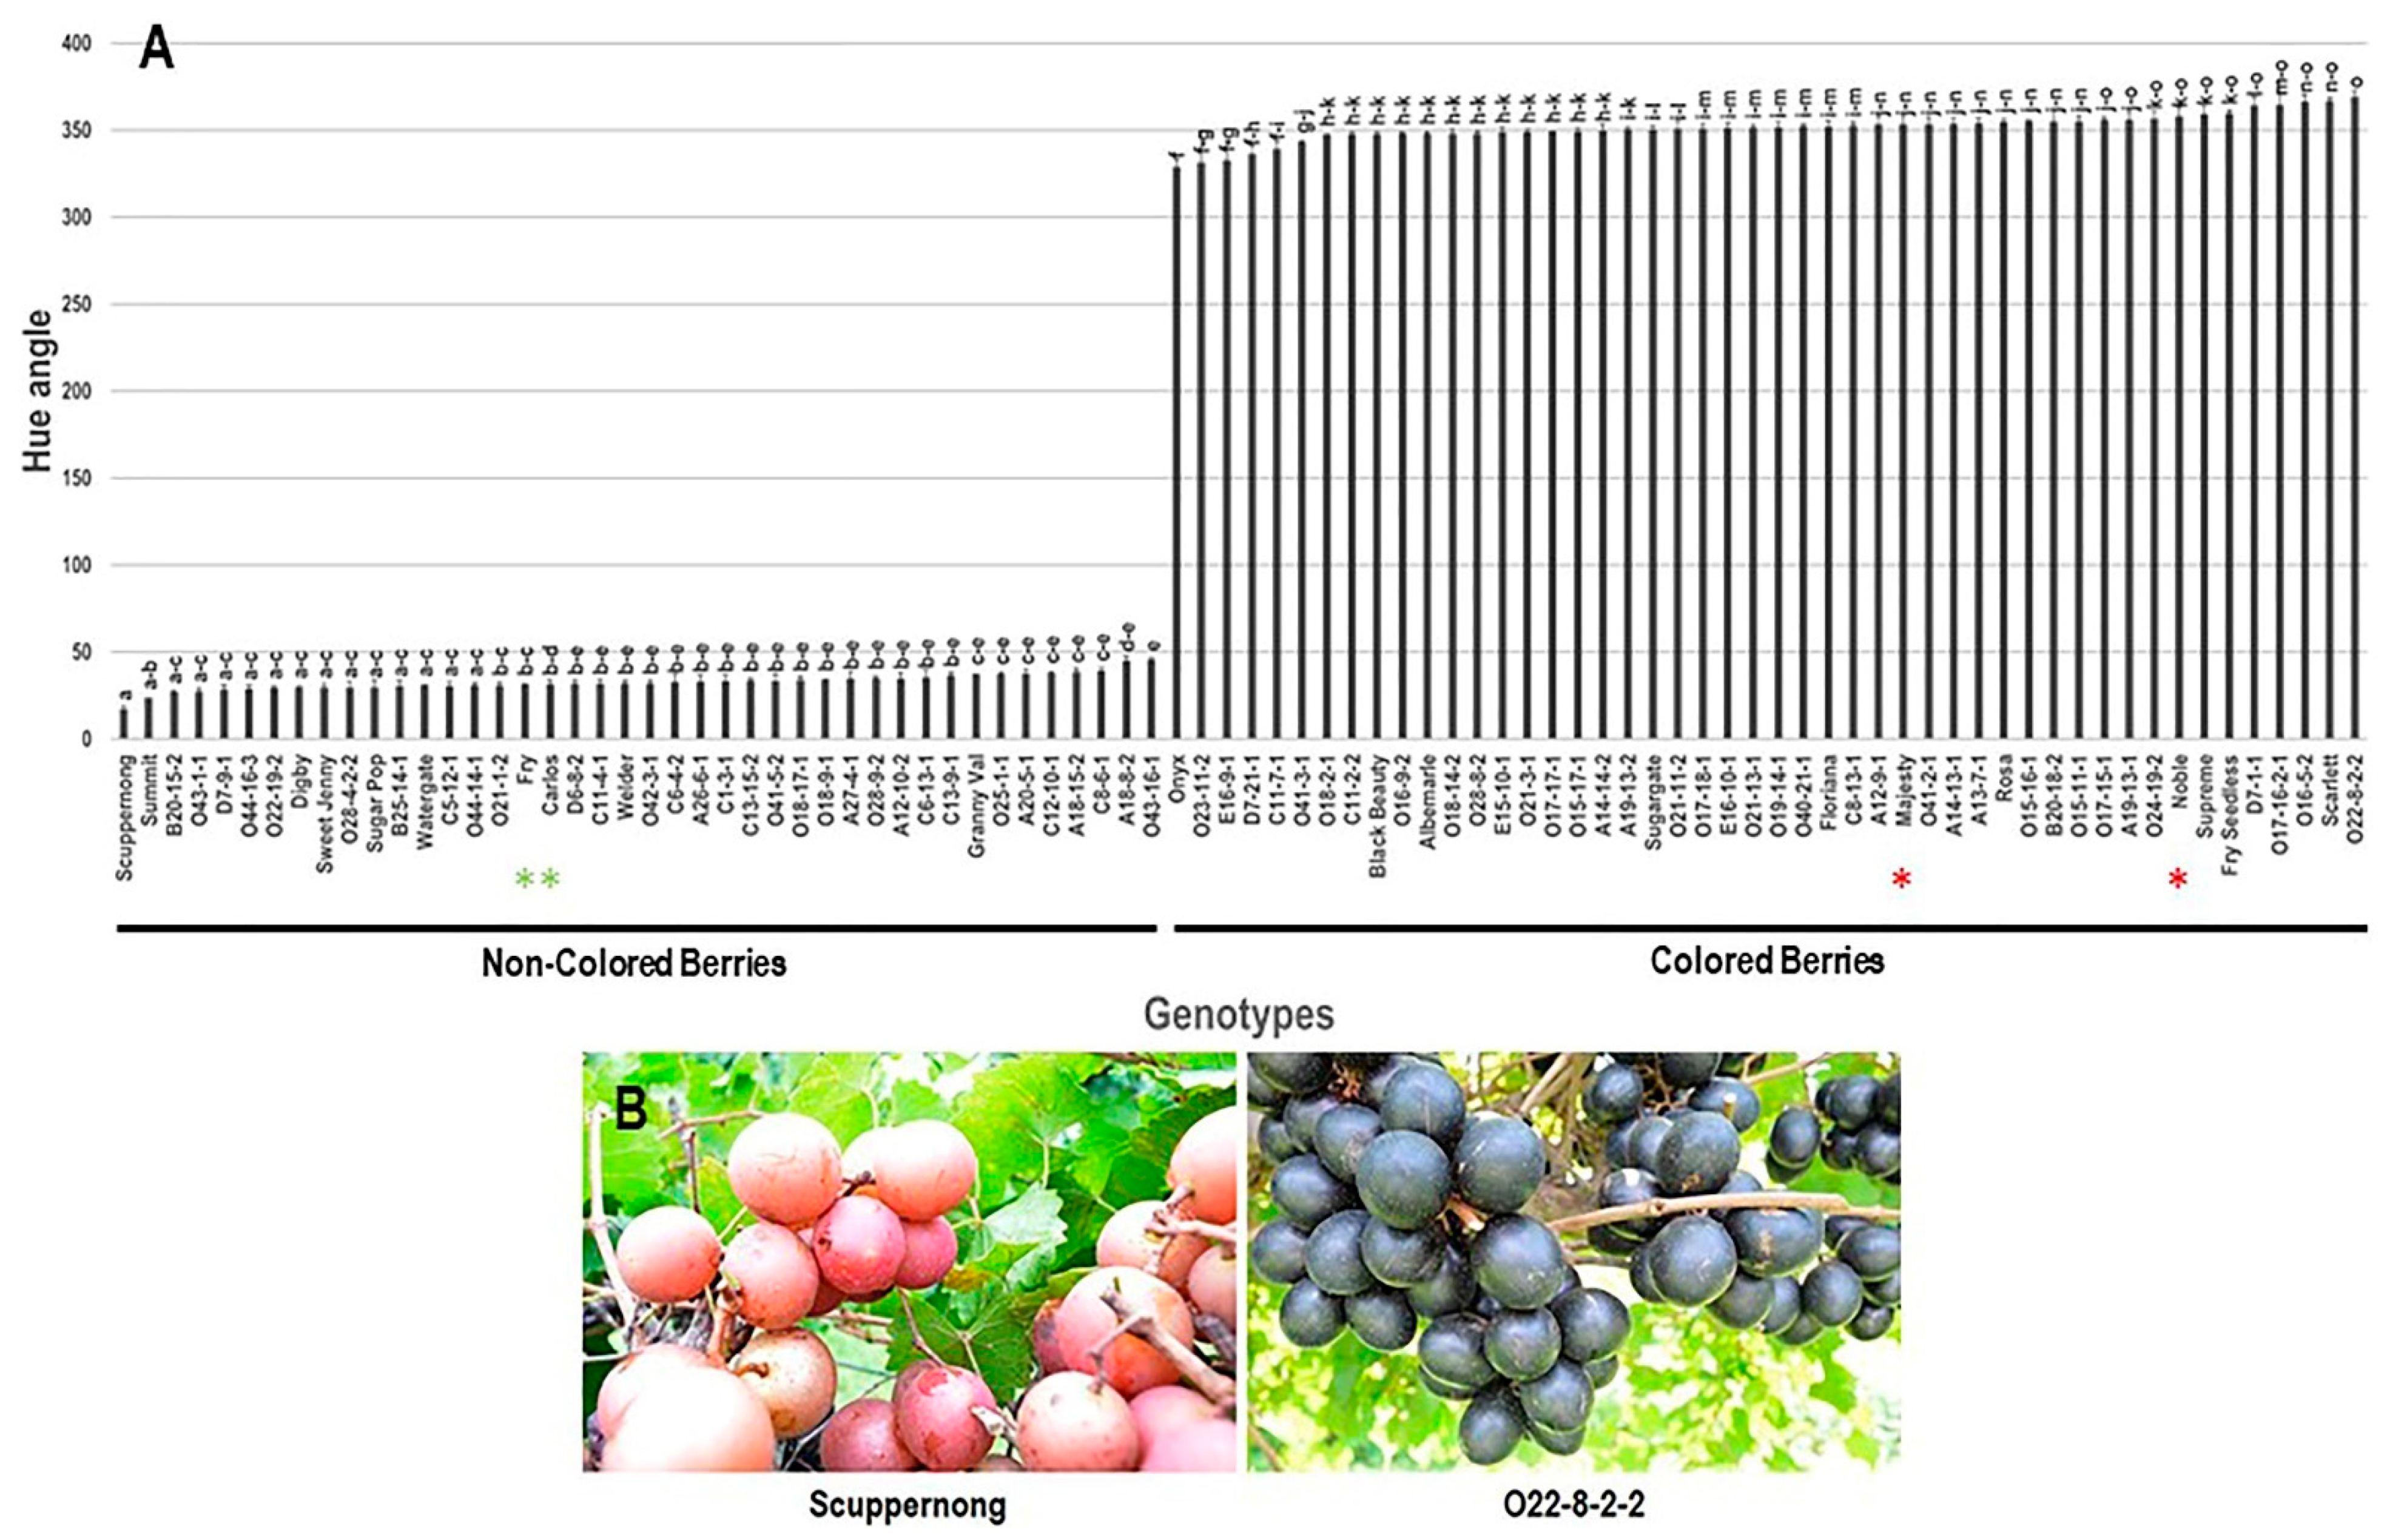
3.2.3. Hue Angle (h°) Trait
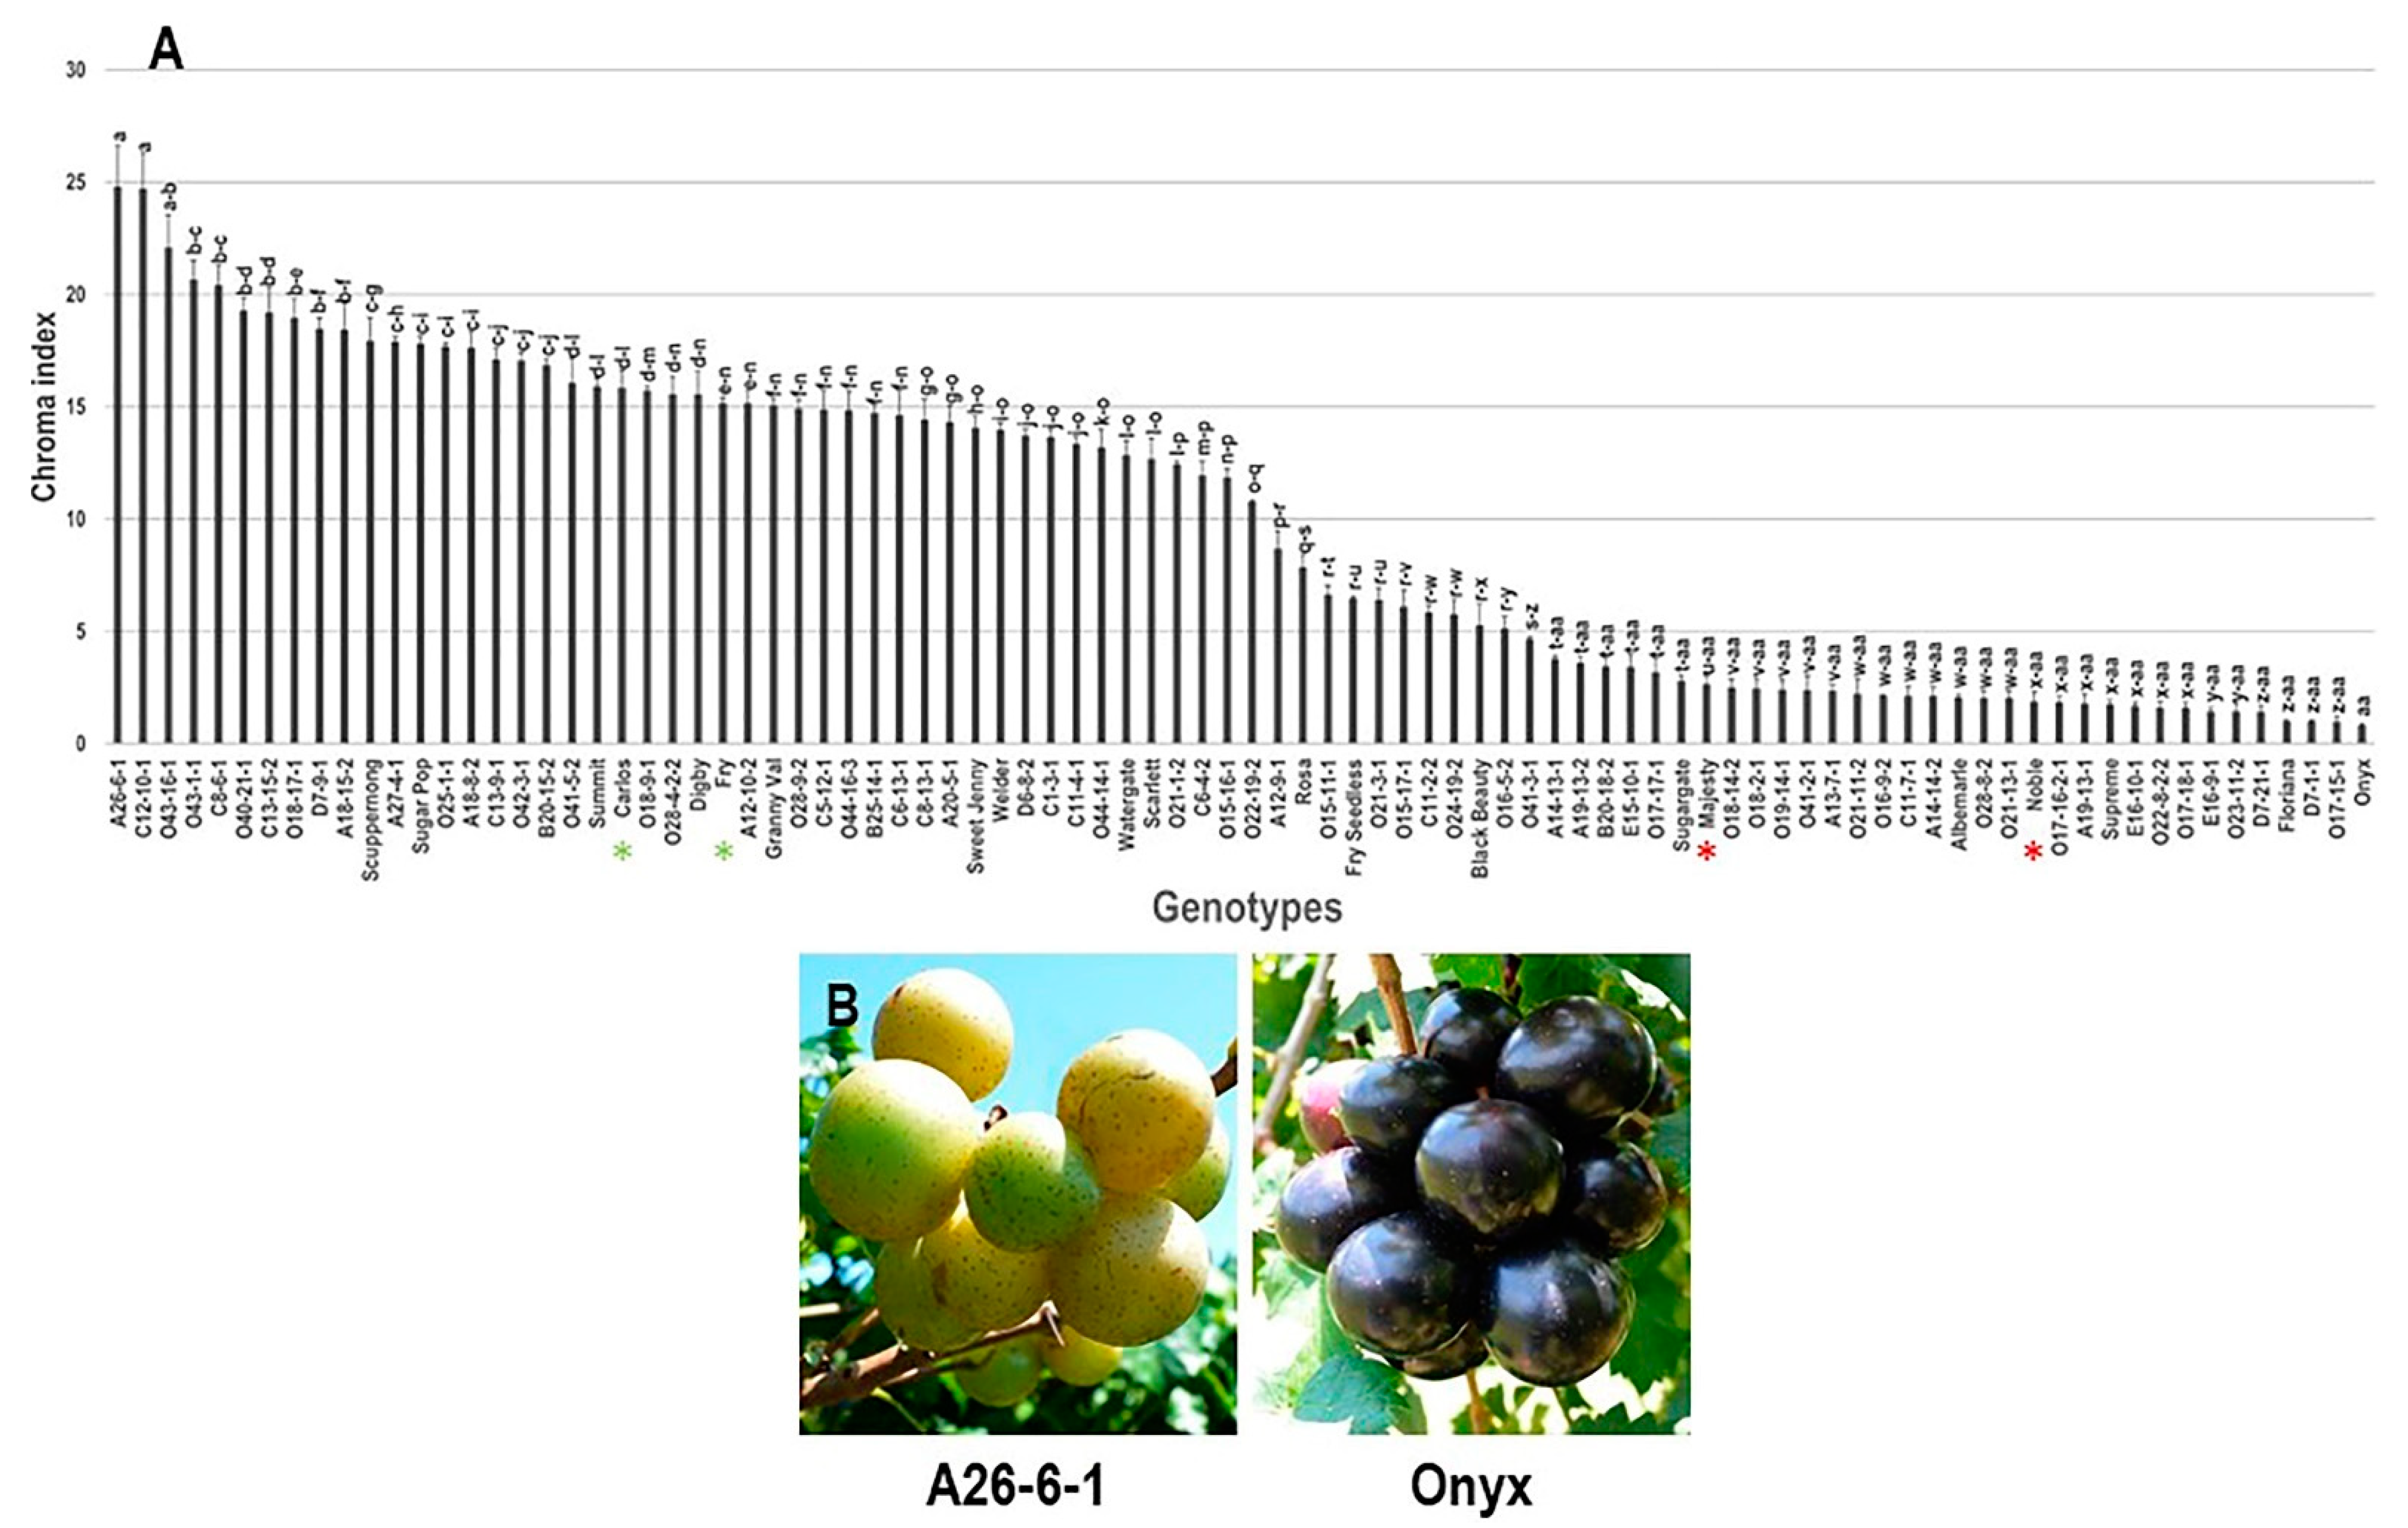
3.2.4. Chroma Index (C*) Trait
3.2.5. Frequency Distribution of Color-Related Traits
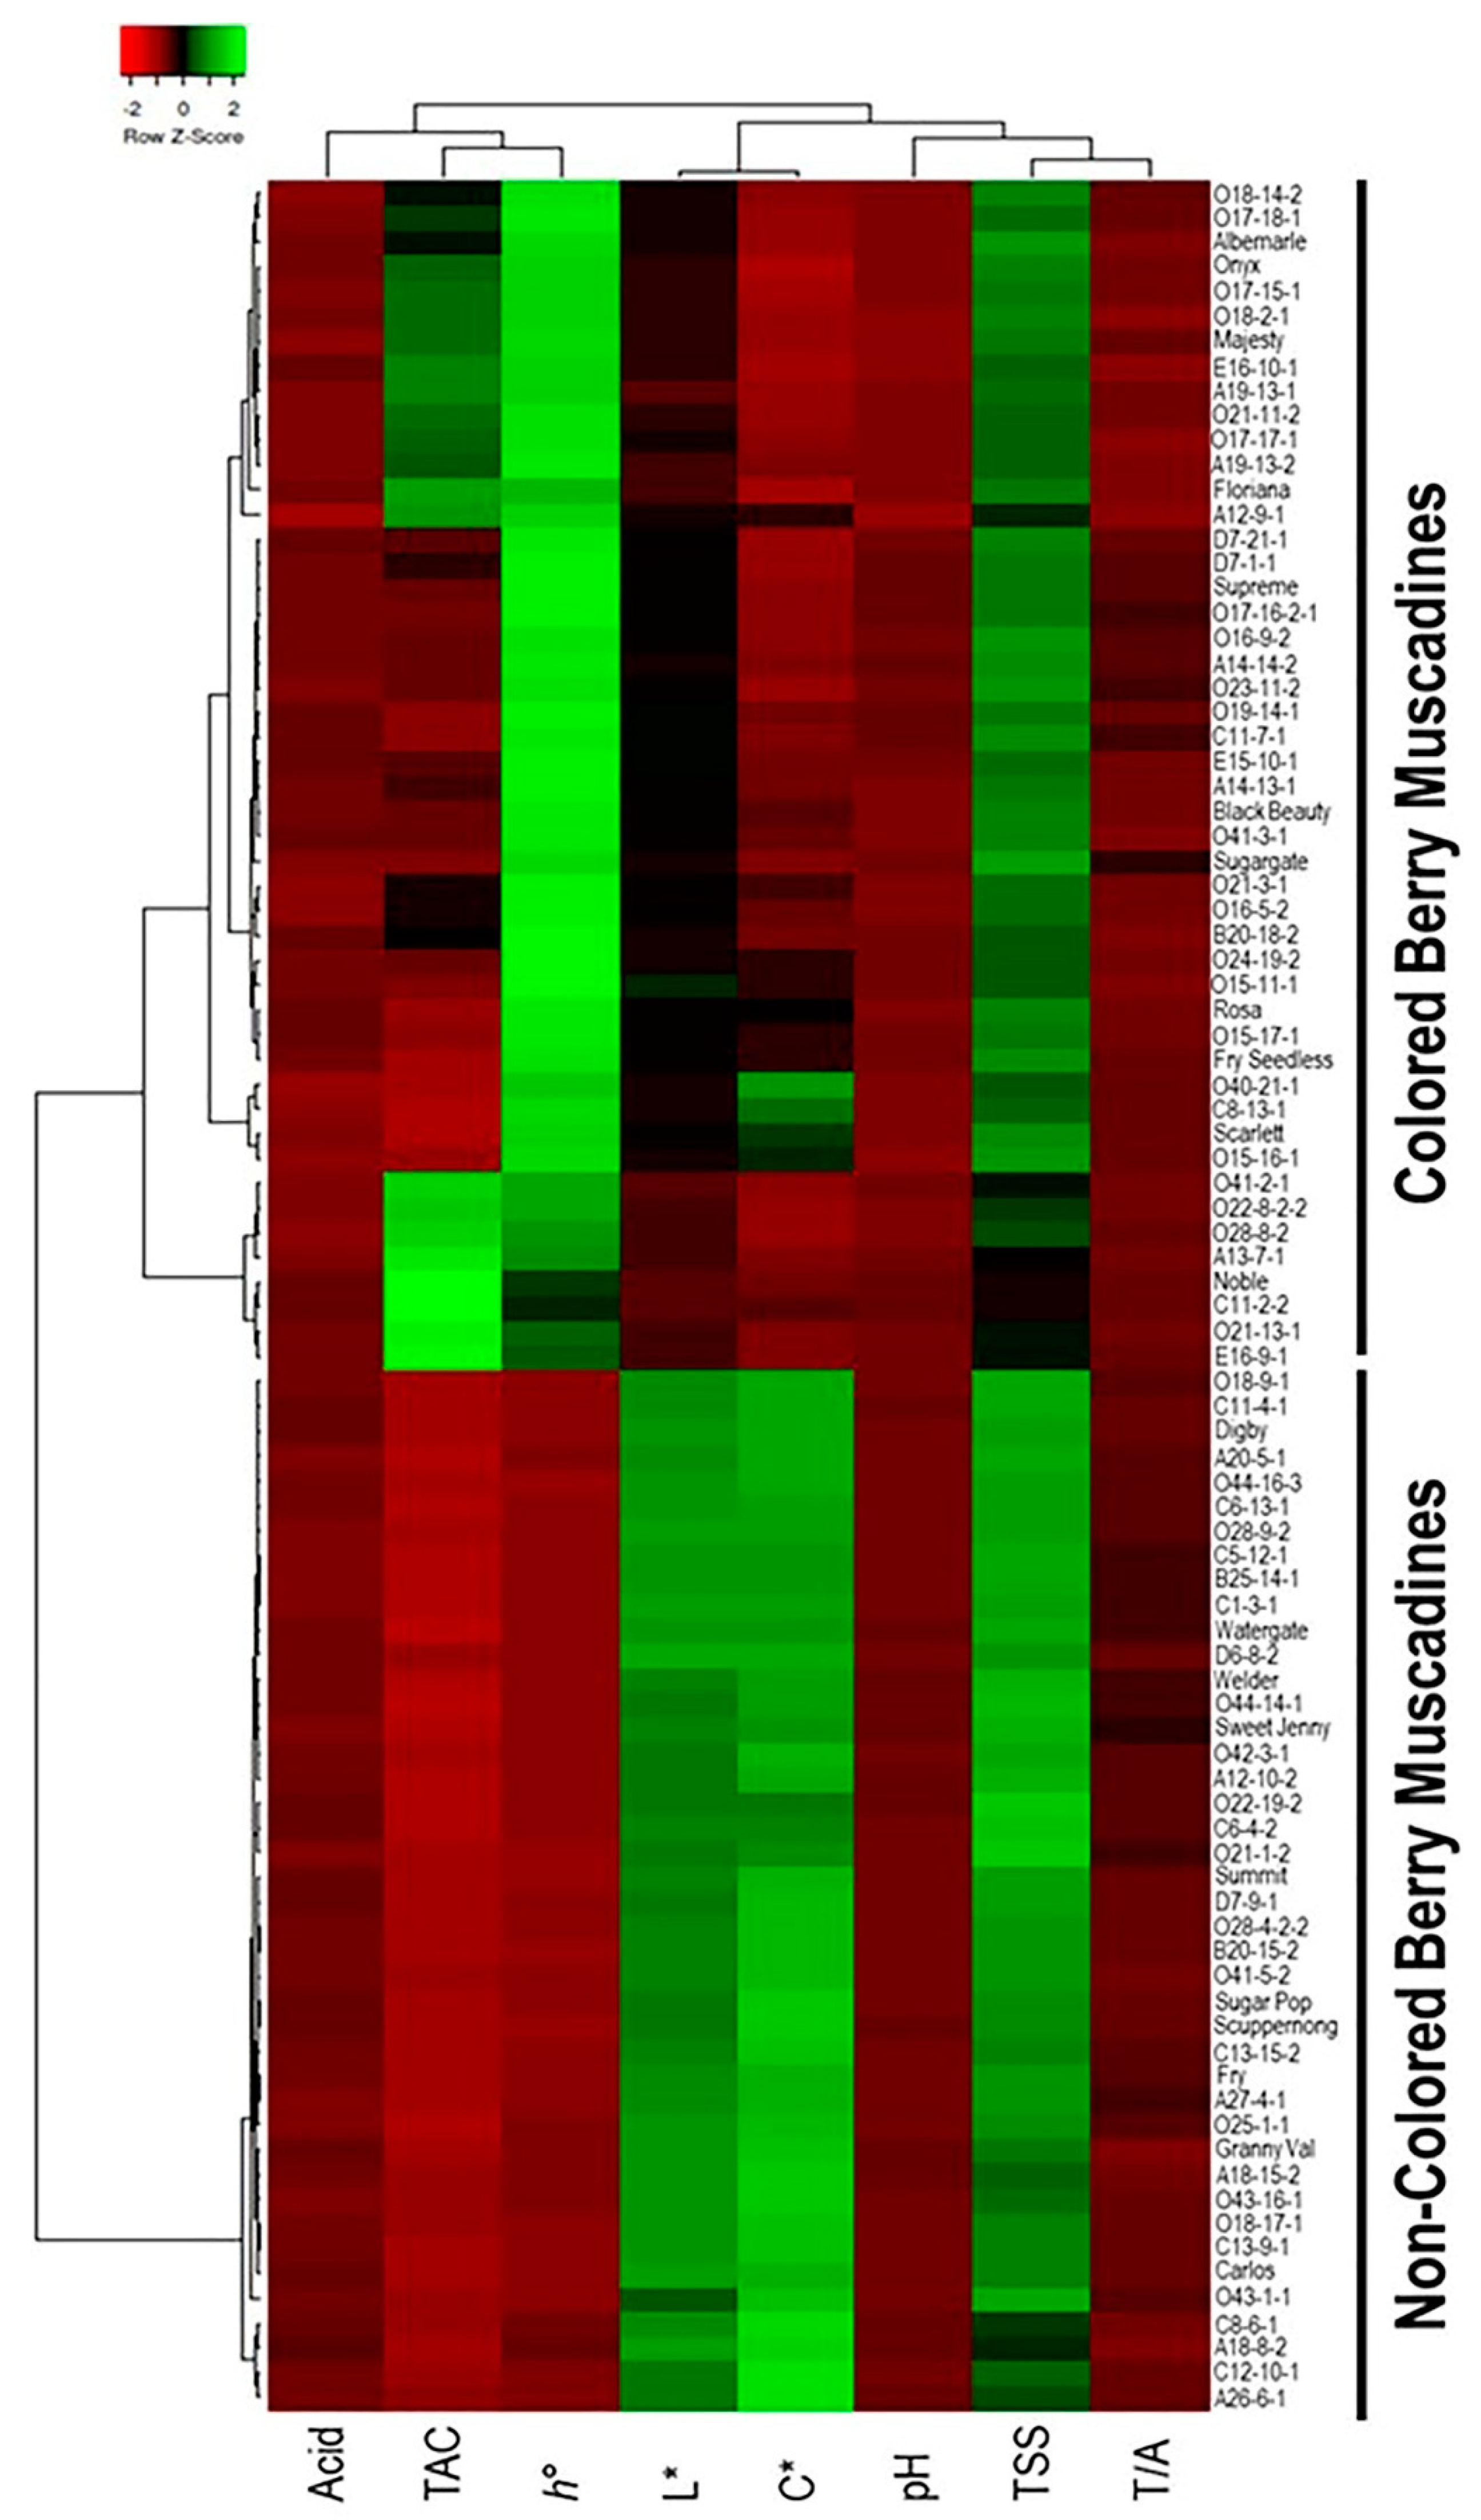
3.2.6. Classification of Muscadine Genotypes Based on the Evaluated Traits
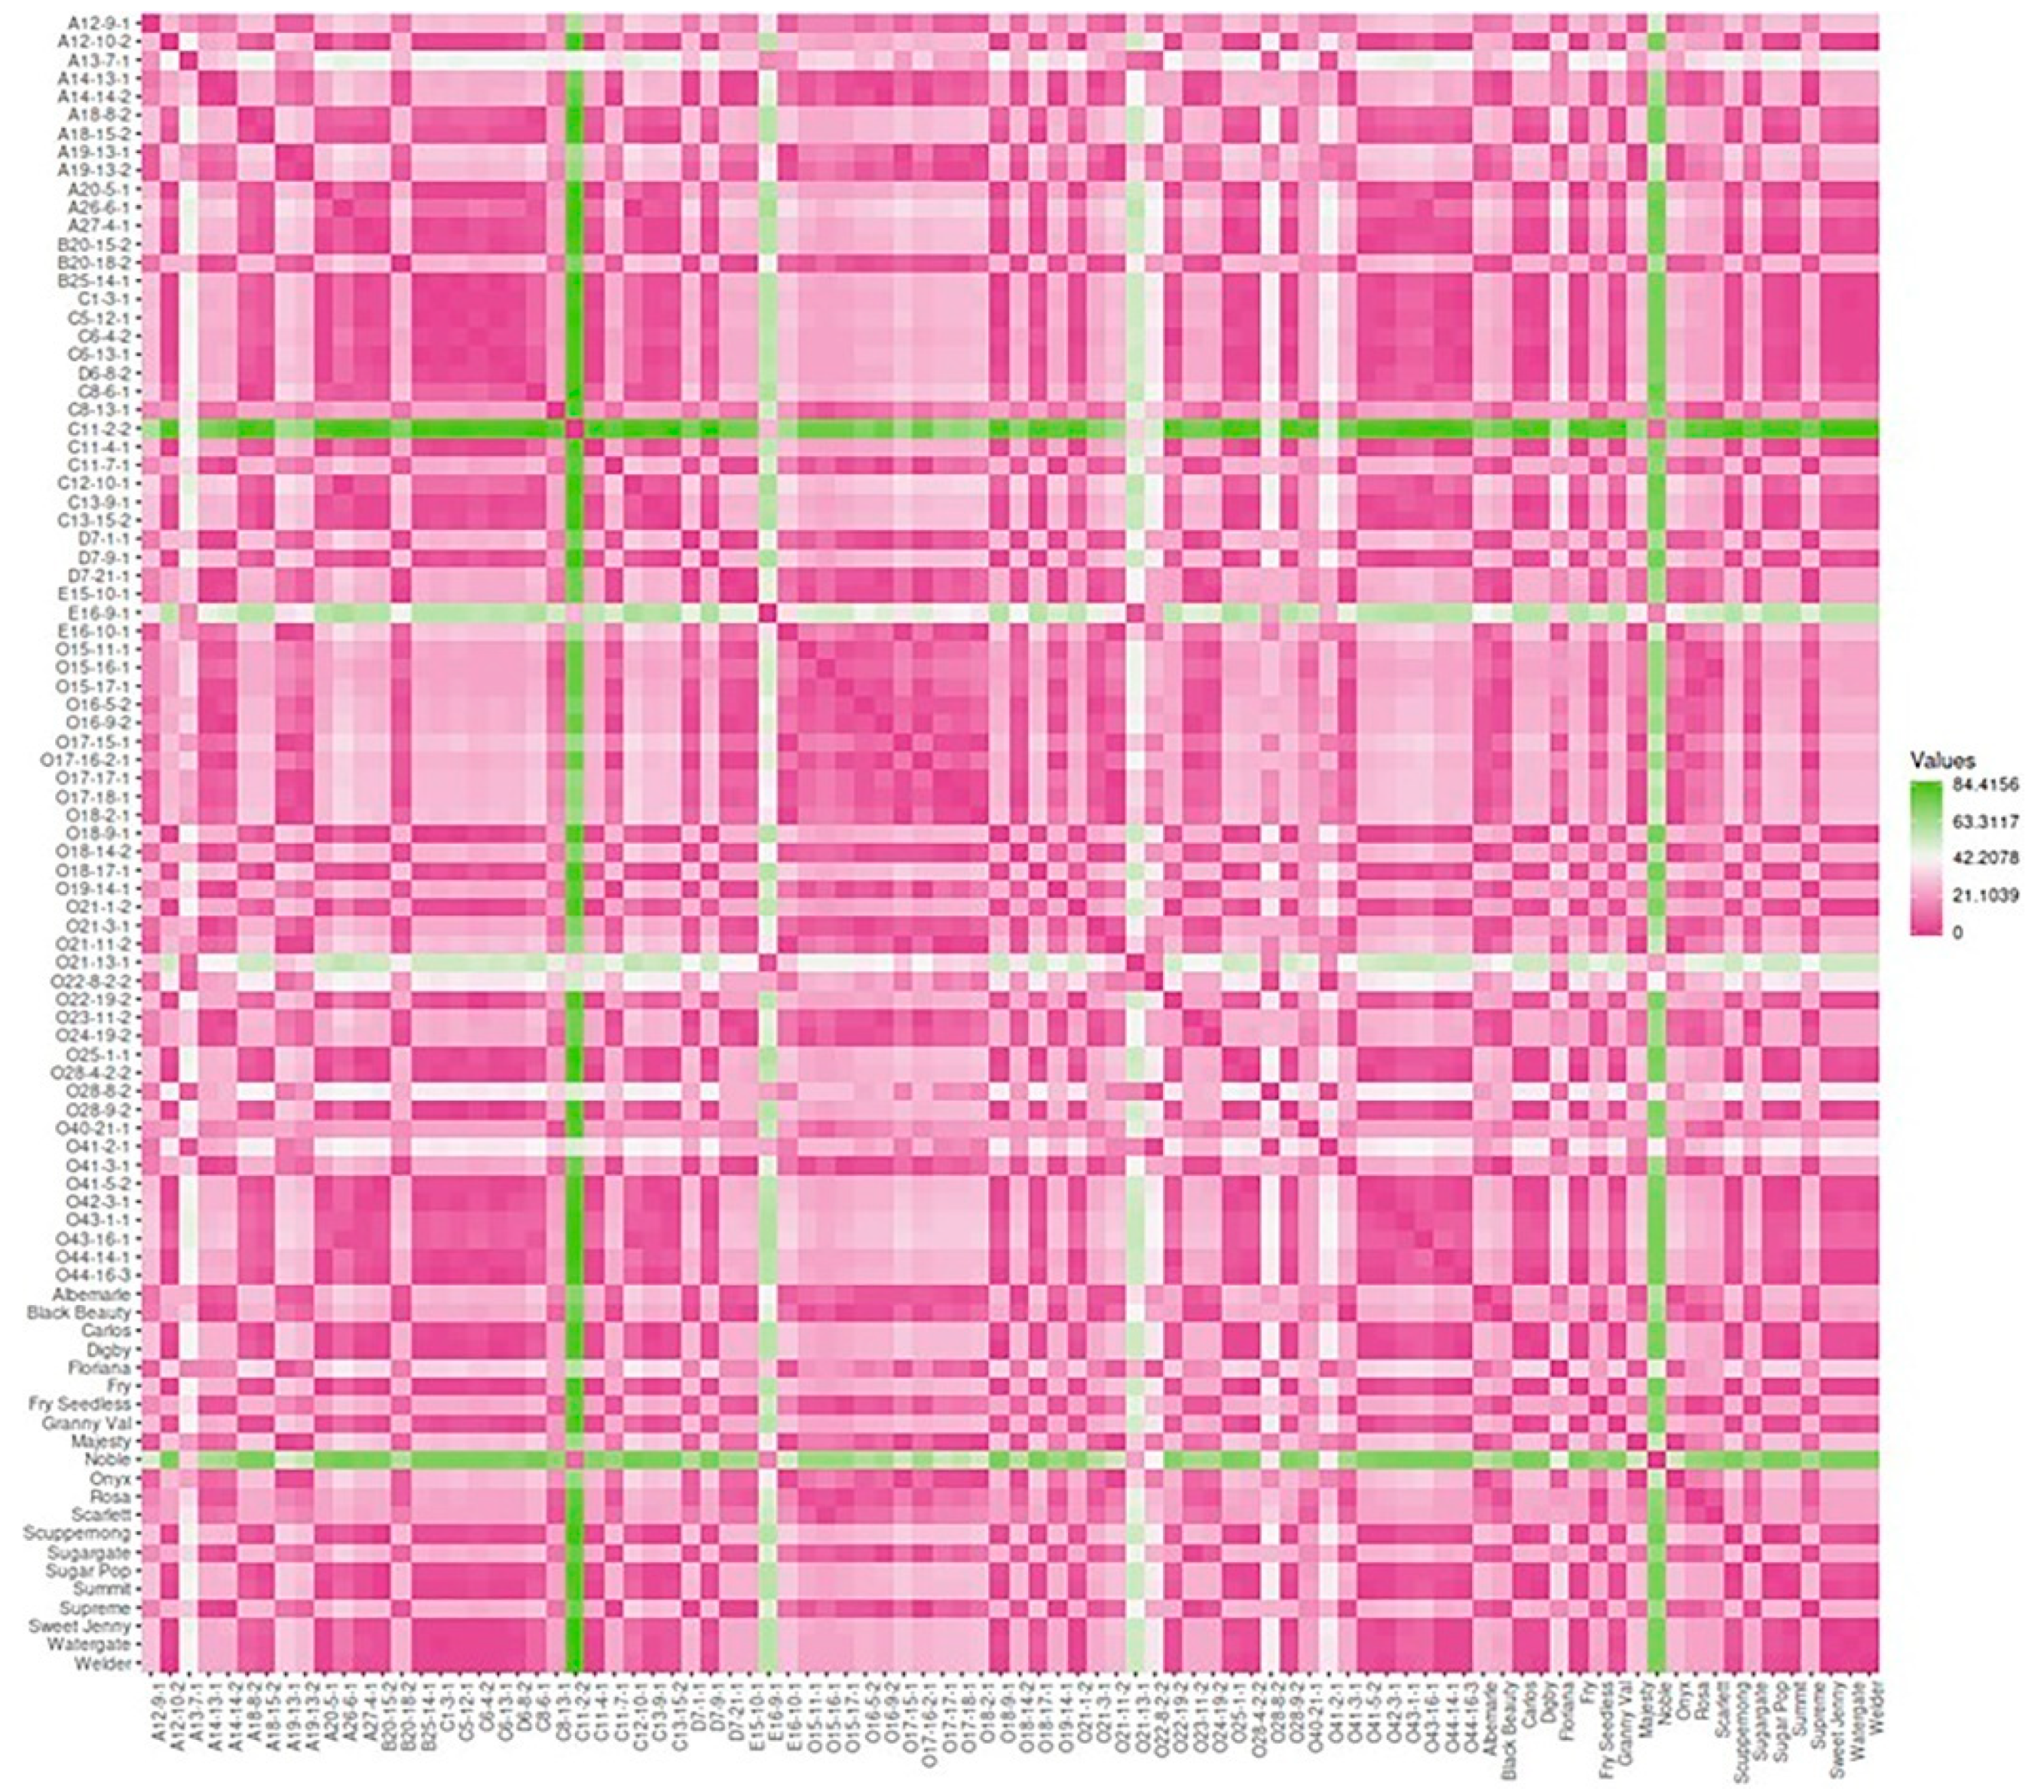
3.2.7. Dissimilarity Matrix Analysis among the Population
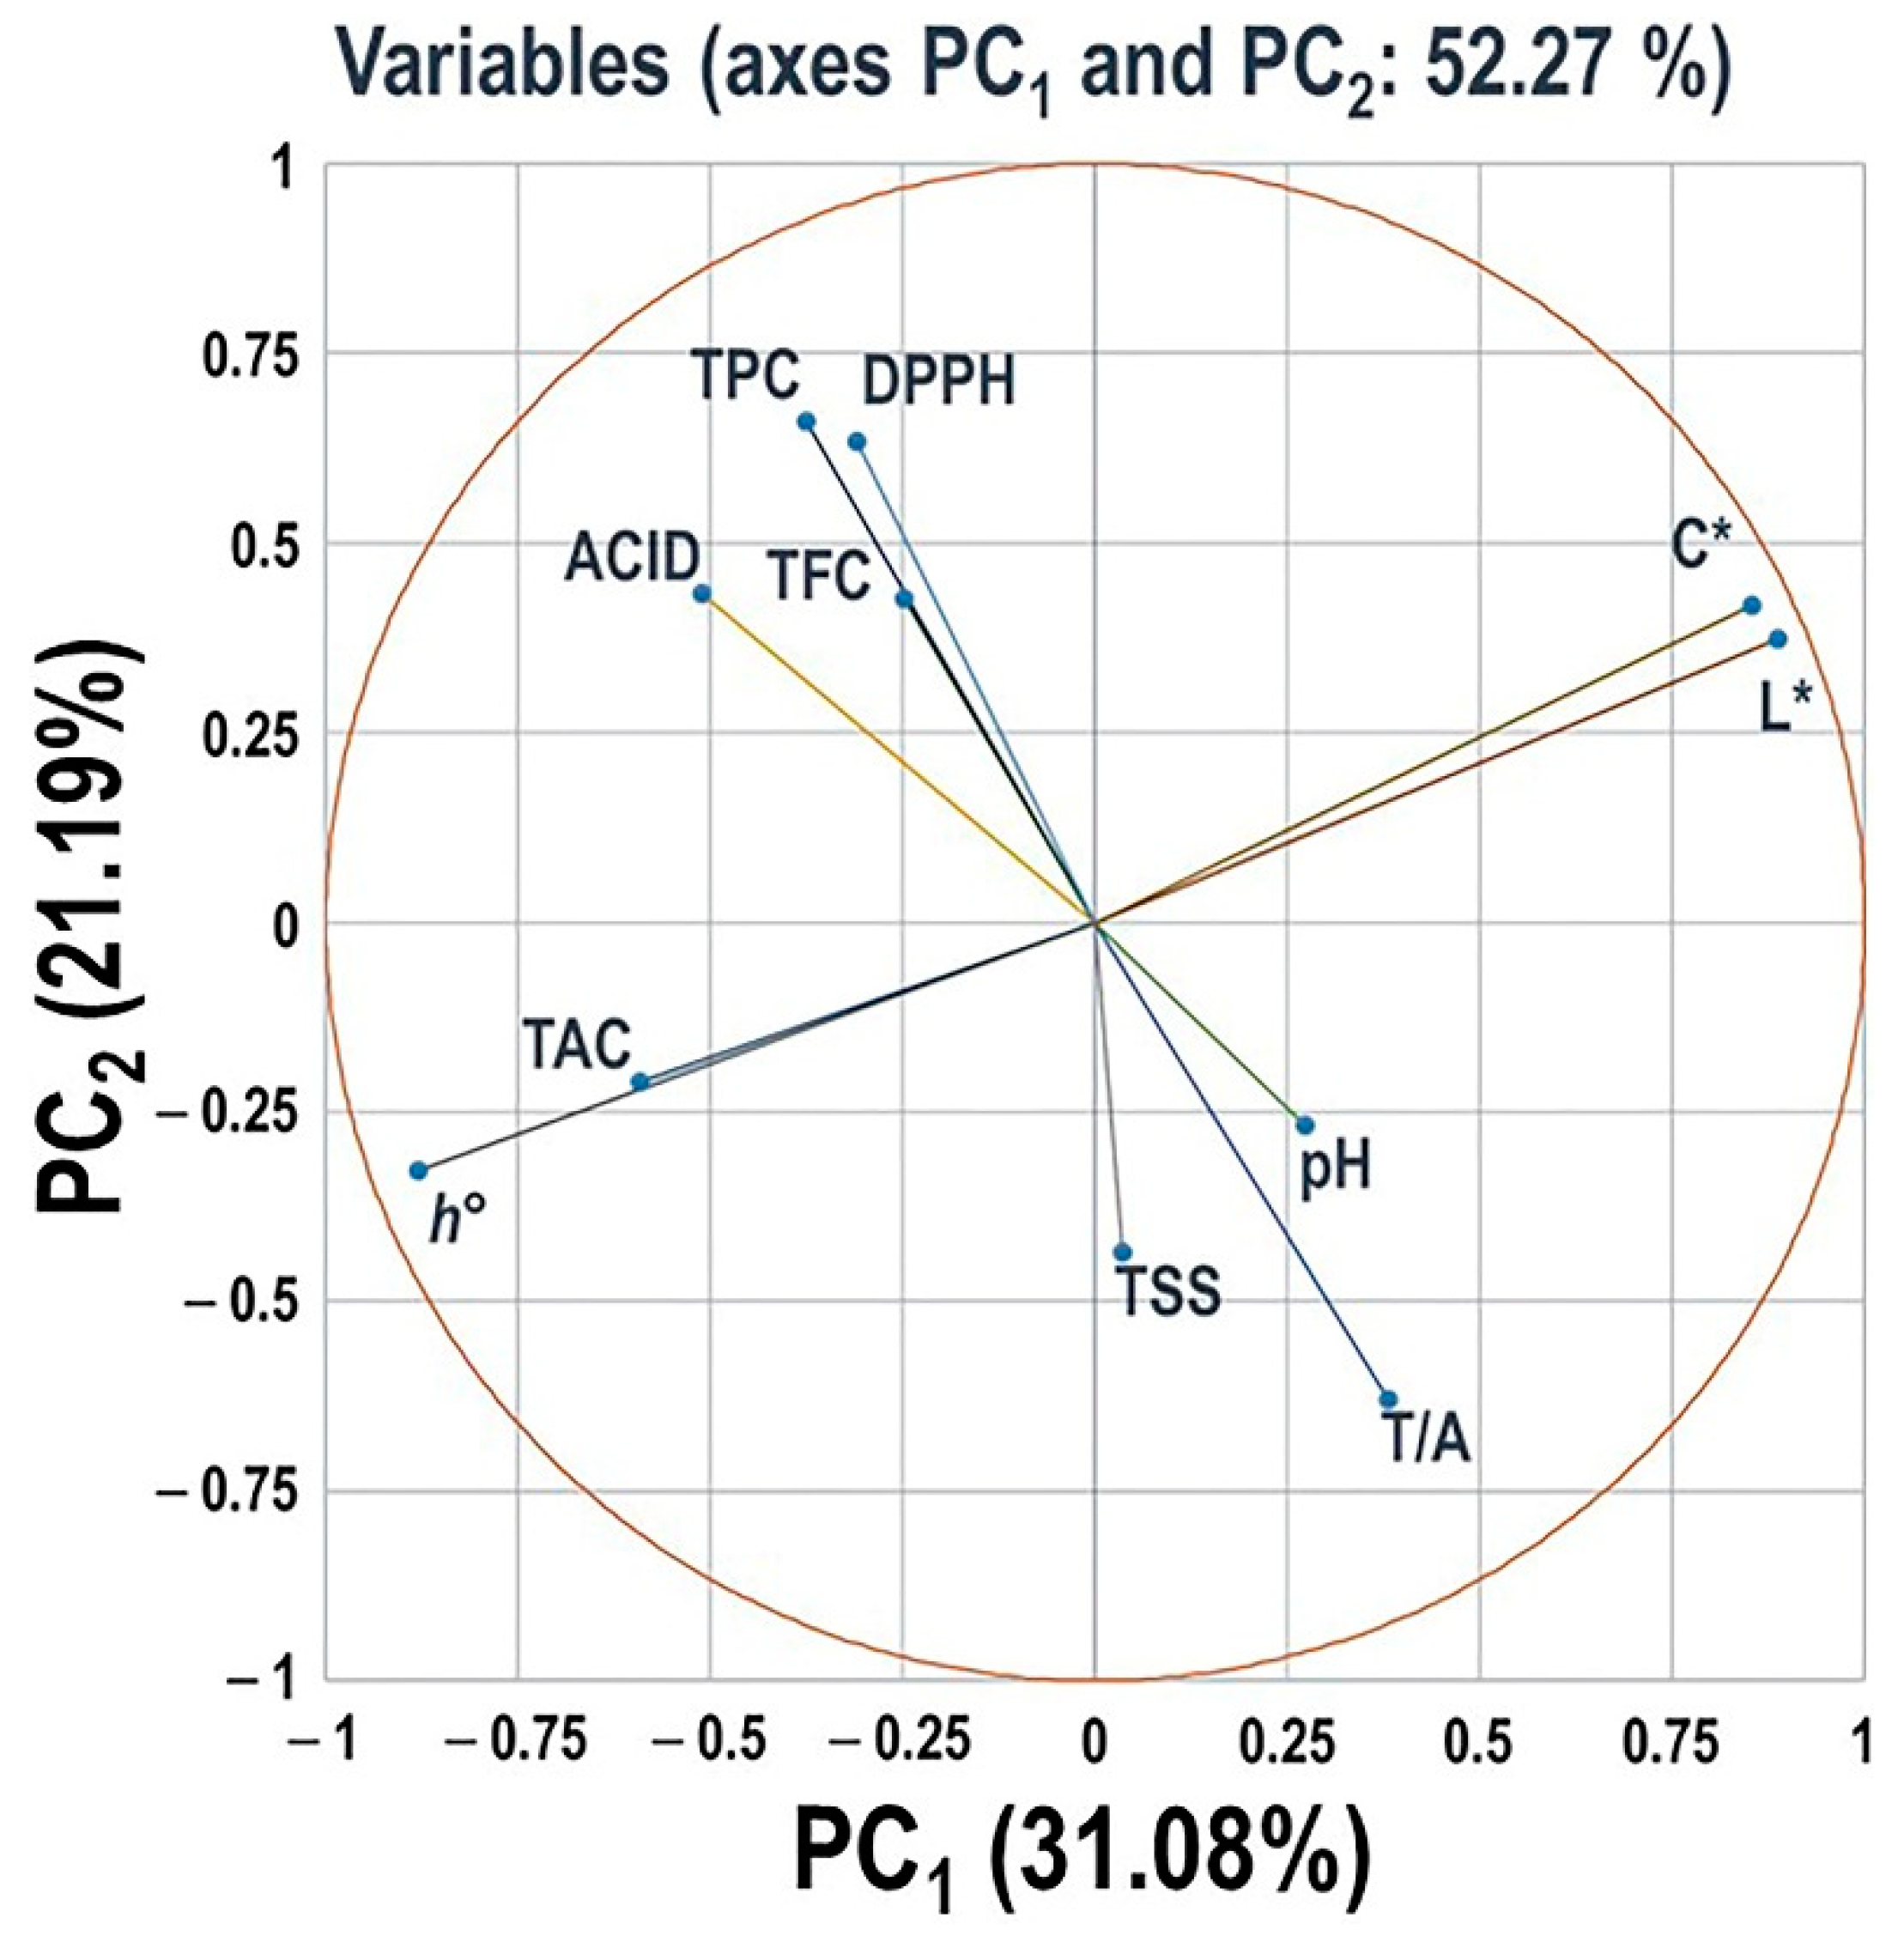
3.2.8. Principal Component Analysis of Different Evaluated Traits
4. Discussion
5. Conclusions
Supplementary Materials
Author Contributions
Funding
Data Availability Statement
Acknowledgments
Conflicts of Interest
References
- Olien, W.C.; Hegwood, C.P. Muscadine-a classic southeastern fruit. HortScience 1990, 25, 726. [Google Scholar] [CrossRef] [Green Version]
- Lane, R. Breeding muscadine and southern bunch grapes. Fruit Var. J. 1997, 51, 144–148. [Google Scholar]
- Xu, C.; Yagiz, Y.; Zhao, L.; Simonne, A.; Lu, J.; Marshall, M.R. Fruit quality, nutraceutical and antimicrobial properties of 58 muscadine grape varieties (Vitis rotundifolia Michx.) grown in United States. Food Chem. 2017, 215, 149–156. [Google Scholar] [CrossRef]
- Lee, J.-H.; Johnson, J.V.; Talcott, S.T. Identification of ellagic acid conjugates and other polyphenolics in muscadine grapes by HPLC-ESI-MS. J. Agric. Food Chem. 2005, 53, 6003–6010. [Google Scholar] [CrossRef] [PubMed]
- Pastrana-Bonilla, E.; Akoh, C.C.; Sellappan, S.; Krewer, G. Phenolic content and antioxidant capacity of muscadine grapes. J. Agric. Food Chem. 2003, 51, 5497–5503. [Google Scholar] [CrossRef]
- Sandhu, A.K.; Gu, L. Antioxidant capacity, phenolic content, and profiling of phenolic compounds in the seeds, skin, and pulp of Vitis rotundifolia (muscadine grapes) as determined by HPLC-DAD-ESI-MS n. J. Agric. Food Chem. 2010, 58, 4681–4692. [Google Scholar] [CrossRef]
- Bralley, E.E.; Hargrove, J.L.; Greenspan, P.; Hartle, D.K. Topical anti-inflammatory activities of Vitis rotundifolia (muscadine grape) extracts in the tetradecanoylphorbol acetate model of ear inflammation. J. Med. Food. 2007, 10, 636–642. [Google Scholar] [CrossRef]
- God, J.M.; Tate, P.; Larcom, L.L. Anticancer effects of four varieties of muscadine grape. J. Med. Food. 2007, 10, 54–59. [Google Scholar] [CrossRef]
- Luo, J.; Wei, Z.; Zhang, S.; Peng, X.; Huang, Y.; Zhang, Y.; Lu, J. Phenolic fractions from muscadine grape “Noble” pomace can inhibit breast cancer cell MDA-MB-231 better than those from European grape “Cabernet Sauvignon” and induce s-phase arrest and apoptosis. J. Food Sci. 2017, 82, 1254–1263. [Google Scholar] [CrossRef]
- Shiraishi, M.; Fujishima, H.; Chijiwa, H. Evaluation of table grape genetic resources for sugar, organic acid, and amino acid composition of berries. Euphytica 2010, 174, 1–13. [Google Scholar] [CrossRef]
- Rolle, L.; Giacosa, S.; Gerbi, V.; Bertolino, M.; Novello, V. Varietal comparison of the chemical, physical, and mechanical properties of five colored table grapes. Int. J. Food Prop. 2013, 16, 598–612. [Google Scholar] [CrossRef] [Green Version]
- Navarro, M.O.; Retamales, J.A.; Defilippi, B.B. Effect of cluster thinning and synthetic cytokinin (CPPU) application on fruit quality of’ Sultanina’grapes treated with two gibberellin sources. Agricultura Técnica 2001, 61, 15–25. [Google Scholar]
- Liu, H.F.; Wu, B.H.; Fan, P.G.; Li, S.H.; Li, L.S. Sugar and acid concentrations in 98 grape cultivars analyzed by principal component analysis. J. Sci. Food Agric. 2006, 86, 1526–1536. [Google Scholar] [CrossRef]
- Nelson, K.E. Harvesting and Handling California Table Grapes for Market; UCANR Publications: Davis, CA, USA, 1979; Volume 1913. [Google Scholar]
- Muñoz-Robredo, P.; Robledo, P.; Manríquez, D.; Molina, R.; Defilippi, B.G. Characterization of sugars and organic acids in commercial varieties of table grapes. Chil. J. Agric. Res. 2011, 71, 452. [Google Scholar] [CrossRef] [Green Version]
- Xie, Z.; Li, B.; Forney, C.F.; Xu, W.; Wang, S. Changes in sugar content and relative enzyme activity in grape berry in response to root restriction. Sci. Hortic. 2009, 123, 39–45. [Google Scholar] [CrossRef]
- Swanson, C.; El-Shishiny, E. Translocation of sugars in the concord grape. Plant Physiol. 1958, 33, 33. [Google Scholar] [CrossRef] [PubMed] [Green Version]
- De Andrés-de Prado, R.; Yuste-Rojas, M.; Sort, X.; Andrés-Lacueva, C.; Torres, M.; Lamuela-Raventós, R.M. Effect of soil type on wines produced from Vitis vinifera L. cv. Grenache in commercial vineyards. J. Agric. Food Chem. 2007, 55, 779–786. [Google Scholar] [CrossRef] [PubMed]
- Conner, P.J. A century of muscadine grape (Vitis rotundifolia Michx) breeding at the University of Georgia. Acta Hortic. 2009, 827, 481–484. [Google Scholar] [CrossRef]
- Kok, D.; Bal, E.; Bahar, E. Physical and biochemical properties of selected grape varieties cultivated in Tekirdag. In Proceedings of the 2nd International Balkan Agriculture Congressat, Tekirdag, Turkey, 16–18 May 2017; Volume 3, pp. 215–223. [Google Scholar]
- Khoo, H.E.; Azlan, A.; Tang, S.T.; Lim, S.M. Anthocyanidins and anthocyanins: Colored pigments as food, pharmaceutical ingredients, and the potential health benefits. Food Nutr. Res. 2017, 61, 1361779. [Google Scholar] [CrossRef] [Green Version]
- Flora, L. Processing and quality characteristics of muscadine grapes. J. Food Sci. 1977, 42, 935–938. [Google Scholar] [CrossRef]
- Flora, L. Influence of heat, cultivar and maturity on the anthocyanidin—3, 5—diglucosides of muscadine grapes. J. Food Sci. 1978, 43, 1819–1821. [Google Scholar] [CrossRef]
- Sims, C.; Bates, R. Effects of skin fermentation time on the phenols, anthocyanins, ellagic acid sediment, and sensory characteristics of a red Vitis rotundifolia wine. Am. J. Enol. Vitic. 1994, 45, 56–62. [Google Scholar]
- Talcott, S.T.; Brenes, C.H.; Pires, D.M.; Del Pozo-Insfran, D. Phytochemical stability and color retention of copigmented and processed muscadine grape juice. J. Agric. Food Chem. 2003, 51, 957–963. [Google Scholar] [CrossRef]
- Talcott, S.T.; Lee, J.-H. Ellagic acid and flavonoid antioxidant content of muscadine wine and juice. J. Agric. Food Chem. 2002, 50, 3186–3192. [Google Scholar] [CrossRef]
- Ballinger, W.; WB, N.; DJ, M. A comparison of anthocyanins and wine color quality in black grapes of 39 clones of Vitis rotundifolia Michx. J. Amer. Soc. Hort. Sci. 1974, 99, 338–341. [Google Scholar]
- Hoffman, M.; Conner, P.; Brannen, P.; Burrack, H.; Mitchem, W.; Cline, B.; Perkins-Veazie, P.; Poling, B. Muscadine Grape Production Guide for the Southeast; NC State Extension, NC State University: Raleigh, NC, USA, 2020. [Google Scholar]
- Chito, D.; Galceran, J.; Companys, E.; Puy, J. Determination of the complexing capacity of wine for Zn using the absence of gradients and Nernstian equilibrium stripping technique. J. Agric. Food Chem. 2013, 61, 1051–1059. [Google Scholar] [CrossRef] [PubMed]
- Fundo, J.F.; Miller, F.A.; Mandro, G.F.; Tremarin, A.; Brandão, T.R.; Silva, C.L. UV-C light processing of Cantaloupe melon juice: Evaluation of the impact on microbiological, and some quality characteristics, during refrigerated storage. LWT 2019, 103, 247–252. [Google Scholar] [CrossRef]
- Giusti, M.M.; Wrolstad, R.E. Characterization and measurement of anthocyanins by UV-visible spectroscopy. Curr. Protoc. Food Anal. Chem. 2001, F1.2.1–F1.2.13. [Google Scholar] [CrossRef]
- Mendonca, P.; Darwish, A.G.; Tsolova, V.; El-Sharkawy, I.; Soliman, K.F. The anticancer and antioxidant effects of muscadine grape extracts on racially different triple-negative breast cancer cells. Anticancer Res. 2019, 39, 4043–4053. [Google Scholar] [CrossRef] [PubMed] [Green Version]
- Jain, A.K.; Basha, S.; Mbuya, O.; Viticulture, C.; Fruits, S. Developmental changes in the amino acid content of muscadine grape genotypes. In Proceedings of the Annual meeting of the Florida State Horticultural Society, Marco Island, FL, USA, 2–4 June 2002; pp. 337–342. [Google Scholar]
- Baldwin, E.A. Fruit flavor, volatile metabolism and consumer perceptions. In Fruit Quality and Its Biological Basis; Sheffield Academic Press: Sheffield, UK, 2002; pp. 89–106. [Google Scholar]
- Ferguson, I.B.; Boyd, L.M. Inorganic nutrients and fruit quality. In Fruit Quality and Its Biological Basis; Sheffield Academic Press: Sheffield, UK, 2002; pp. 17–45. [Google Scholar]
- Gurak, P.D.; Cabral, L.M.; Rocha-Leão, M.H.M.; Matta, V.M.; Freitas, S.P. Quality evaluation of grape juice concentrated by reverse osmosis. J. Food Eng. 2010, 96, 421–426. [Google Scholar] [CrossRef]
- Zoecklein, B. Grape sampling and maturity evaluation for growers. Vintner Corner 2001, 16, 1–6. [Google Scholar]
- Possner, D.R.E.; Kliewer, W.M. The localisation of acids, sugars, potassium, and calcium into developing grape berries. Vitis 1985, 24, 229–240. [Google Scholar]
- Coombe, B.G. Distribution of solutes within the developing grape berry in relation to its morphology. Am. J. Enol. Vitic. 1987, 38, 120–127. [Google Scholar]
- Rolle, L.; Torchio, F.; Giacosa, S.; Segade, S.R. Berry density and size as factors related to the physicochemical characteristics of Muscat Hamburg table grapes (Vitis vinifera L.). Food Chem. 2015, 173, 105–113. [Google Scholar] [CrossRef] [PubMed]
- Scienza, A.; Miravalle, R.; Visai, C.; Fregoni, M. Relationships between seed number, gibberellin and abscisic acid levels and ripening in Cabernet Sauvignon grape berries. Vitis 1978, 17, 361–368. [Google Scholar]
- Cawthon, D.L.; Morris, J.R. Relationship of seed number and maturity to berry development, fruit maturation, hormonal changes, and uneven ripening. J. Am. Soc. Hort. Sci. 1982, 107, 1097–1104. [Google Scholar]
- Roby, G.; Harbertson, J.F.; Adams, D.O.; Matthews, M.A. Berry size and vine water deficits as factors in winegrape composition: Anthocyanins and tannins. Aust. J. Grape Wine Res. 2004, 10, 100–107. [Google Scholar] [CrossRef]
- Carroll, D.; Marcy, J. Chemical and physical changes during maturation of Muscadine grapes (Vitis rotundifolia). Am. J. Enol. Vitic. 1982, 33, 168–172. [Google Scholar]
- Hawker, J. Changes in the activities of enzymes concerned with sugar metabolism during the development of grape berries. Phytochemistry 1969, 8, 9–17. [Google Scholar] [CrossRef]
- Du Plessis, C. Grape components in relation to white wine quality. In Proceedings of the International Symposium in the Quality of the Vintage, Cape Town, South Africa, 14–21 February 1977; pp. 14–21. [Google Scholar]
- Soyer, Y.E.Ş.İ.M.; Koca, N.; Karadeniz, F. Organic acid profile of Turkish white grapes and grape juices. J. Food Compos. Anal. 2003, 16, 629–636. [Google Scholar] [CrossRef]
- Girard, B.; Mazza, G. Functional Grape and Citrus Products; Technomic Publishing: Lancaster, PA, USA, 1998; pp. 139–191. [Google Scholar]
- Amerine, M. The acids of california grapes and wines. 1. Lactic acid. Food Technol. 1950, 4, 177–181. [Google Scholar]
- Diakou, P.; Moing, A.; Svanella, L.; Ollat, N.; Rolin, D.; Gaudillère, M.; Gaudillère, J.-P. Biochemical comparison of two grape varieties differing in juice acidity. Aust. J. Grape Wine R. 1997, 3, 1–10. [Google Scholar] [CrossRef]
- Fahmi, A.I.; Nagaty, M.A.; El-Shehawi, A.M. Fruit quality of Taif grape (Vitis vinifera L.) cultivars. Am. J. Sci. 2012, 8, 590–599. [Google Scholar]
- Amerine, M.A. Acids, grapes, wines and people. Am. J. Enol. Vitic. 1964, 15, 106–115. [Google Scholar]
- Cui, Z.-W.; Xu, S.-Y.; Sun, D.-W. Effect of microwave-vacuum drying on the carotenoids retention of carrot slices and chlorophyll retention of Chinese chive leaves. Dry. Technol. 2004, 22, 563–575. [Google Scholar] [CrossRef]
- Conner, P. Characteristics of promising muscadine grape (Vitis rotundifolia Michx.) selections from the University of Georgia (USA) breeding program. Acta Hortic. 2014, 1046, 303–307. [Google Scholar] [CrossRef]
- Underhill, A.; Hirsch, C.; Clark, M. Evaluating and mapping grape color using image-based phenotyping. Plant. Phenom. 2020, 2020, 8086309. [Google Scholar] [CrossRef] [Green Version]
- Weisong, M.; Chengcheng, L.; Dong, T.; Jianying, F. Chinese consumers’ behavior and preference to table grapes. Br. Food J. 2016, 118, 231–246. [Google Scholar] [CrossRef]
- Conway, B.R.; Moeller, S.; Tsao, D.Y. Specialized color modules in macaque extra striate cortex. Neuron 2007, 56, 560–573. [Google Scholar] [CrossRef] [PubMed] [Green Version]
- Conway, B.R.; Tsao, D.Y. Color-tuned neurons are spatially clustered according to color preference within alert macaque posterior inferior temporal cortex. Proc. Natl. Acad. Sci. USA 2009, 106, 18034–18039. [Google Scholar] [CrossRef] [Green Version]
- Owens, C.L. Pigments in grape. In Pigments in Fruits and Vegetables; Springer: New York, NY, USA, 2015; pp. 189–204. [Google Scholar]
- Carreno, J.; Martinez, A. Proposal of an index for the objective evaluation of the colour of red table grapes. Food Res. Int. 1996, 28, 373–377. [Google Scholar] [CrossRef]
- Striegler, R.K.; Morris, J.R.; Carter, P.M.; Clark, J.R.; Threlfall, R.T.; Howard, L.R. Yield, quality, and nutraceutical potential of selected muscadine cultivars grown in southwestern Arkansas. Horttechnology 2005, 15, 276–284. [Google Scholar] [CrossRef] [Green Version]
- Huang, Z.; Wang, B.; Williams, P.; Pace, R.D. Identification of anthocyanins in muscadine grapes with HPLC-ESI-MS. LWT 2009, 42, 819–824. [Google Scholar] [CrossRef]
- Liang, Z.; Sang, M.; Fan, P.; Wu, B.; Wang, L.; Yang, S.; Li, S. CIELAB coordinates in response to berry skin anthocyanins and their composition in Vitis. J. Food Sci. 2011, 76, C490–C497. [Google Scholar] [CrossRef]
- Janvary, L.; Hoffmann, T.; Pfeiffer, J.; Hausmann, L.; Töpfer, R.; Fischer, T.C.; Schwab, W. A double mutation in the anthocyanin 5-O-glucosyltransferase gene disrupts enzymatic activity in Vitis vinifera L. J. Agric. Food Chem. 2009, 57, 3512–3518. [Google Scholar] [CrossRef]
- Lee, J.-H.; Talcott, S.T. Fruit maturity and juice extraction influences ellagic acid derivatives and other antioxidant polyphenolics in muscadine grapes. J. Agric. Food Chem. 2004, 52, 361–366. [Google Scholar] [CrossRef]
- Sims, C.; Morris, J. Effects of acetaldehyde and tannins on the color and chemical age of red muscadine (Vitis rotundifolia) wine. Am. J. Enol. Vitic. 1986, 37, 163–165. [Google Scholar]
- Ma, S.; Kim, C.; Neilson, A.P.; Griffin, L.E.; Peck, G.M.; O’Keefe, S.F.; Stewart, A.C. Comparison of common analytical methods for the quantification of total polyphenols and flavanols in fruit juices and ciders. J. Food Sci. 2019, 84, 2147–2158. [Google Scholar] [CrossRef] [PubMed] [Green Version]
- Liu, Q.; Tang, G.-Y.; Zhao, C.-N.; Gan, R.-Y.; Li, H.-B. Antioxidant activities, phenolic profiles, and organic acid contents of fruit vinegars. Antioxidants 2019, 8, 78. [Google Scholar] [CrossRef] [PubMed] [Green Version]
- Xia, E.-Q.; Deng, G.-F.; Guo, Y.-J.; Li, H.-B. Biological activities of polyphenols from grapes. Int. J. Mol. Sci. 2010, 11, 622–646. [Google Scholar] [CrossRef] [PubMed]


Publisher’s Note: MDPI stays neutral with regard to jurisdictional claims in published maps and institutional affiliations. |
© 2021 by the authors. Licensee MDPI, Basel, Switzerland. This article is an open access article distributed under the terms and conditions of the Creative Commons Attribution (CC BY) license (https://creativecommons.org/licenses/by/4.0/).
Share and Cite
Campbell, J.; Sarkhosh, A.; Habibi, F.; Gajjar, P.; Ismail, A.; Tsolova, V.; El-Sharkawy, I. Evaluation of Biochemical Juice Attributes and Color-Related Traits in Muscadine Grape Population. Foods 2021, 10, 1101. https://doi.org/10.3390/foods10051101
Campbell J, Sarkhosh A, Habibi F, Gajjar P, Ismail A, Tsolova V, El-Sharkawy I. Evaluation of Biochemical Juice Attributes and Color-Related Traits in Muscadine Grape Population. Foods. 2021; 10(5):1101. https://doi.org/10.3390/foods10051101
Chicago/Turabian StyleCampbell, Jiovan, Ali Sarkhosh, Fariborz Habibi, Pranavkumar Gajjar, Ahmed Ismail, Violeta Tsolova, and Islam El-Sharkawy. 2021. "Evaluation of Biochemical Juice Attributes and Color-Related Traits in Muscadine Grape Population" Foods 10, no. 5: 1101. https://doi.org/10.3390/foods10051101