Mapping Soil Properties to Advance the State of Spatial Soil Information for Greater Food Security on US Tribal Lands
 Bryan Fuentes1
  Amanda J. Ashworth
 Phillip Owens
- 1Department of Crop, Soil, and Environmental Sciences, University of Arkansas, University of Arkansas, Fayetteville, AR, United States
- 2United States Department of Agriculture, Agricultural Research Service, Poultry Production and Product Safety Research Unit, Fayetteville, AR, United States
- 3International Fertilizer Development Center (IFDC), International Fertilizer Development Center Duduville, Nairobi, Kenya
- 4USDA-ARS, Dale Bumpers Small Farms Research Center, Booneville, AR, United States
Knowledge, data, and understanding of soils is key for advancing agriculture and society. There is currently a critical need for sustainable soil management tools for enhanced food security on Native American Tribal Lands. Tribal Reservations have basic soil information and limited access to conservation programs provided to other U.S producers. The objective of this study was to create first ever high-resolution digital soil property maps of Quapaw Tribal Lands with limited data for sustainable soil resource management. We used a digital soil mapping (DSM) approach based on fuzzy logic to model the spatial distribution of 24 soil properties at 0–15 and 15–30 cm depths. A digital elevation model with 3 m resolution was used to derive terrain variables and a total of 28 samples were collected at 0–30 cm over the 22,880-ha reservation. Additionally, soil property maps were derived from Gridded Soil Survey Geographic Database (gSSURGO) for comparison. When comparing properties modeled by DSM to those derived from gSSURGO, DSM resulted in lower root mean squared error (RMSE) for percent clay and sand at 0–15 cm, and cation exchange capacity, percent clay, and pH at 15–30 cm. Conversely, gSSURGO-derived maps resulted in lower RMSE for cation exchange capacity, pH, and percent silt at the 0–15 cm depth, and percent sand and silt at the 15–30 cm depth. Although, some of the soil properties derived from gSSURGO had lower RMSE, spatial soil property patterns modeled by DSM were in better agreement with the topographic complexity and expected soil-landscape relationships. The proposed DSM approach developed property maps at high-resolution, which sets the baseline for production of new spatial soil information for Quapaw Tribal soils. It is expected that these maps and future versions will be useful for soil, crop, and land-use decisions at the farm and Tribal-level for increased agricultural productivity and economic development. Overall, this study provides a framework for developing DSM on Tribal Lands for improving the accuracy and detail of soil property maps (relative to off the shelf products such as SSURGO) that better represents soil-forming environments and the spatial variability of soil properties on Tribal Lands.
Introduction
Soils provide essential ecosystem services, including water filtration, flood control, medium for plant growth, and habitat for soil biota. About 38% of the Earth's ice-free surface is used for agriculture—approximately 12% for croplands and 26% for pastures (1). Information about soils is integral to sustainable soil management. Overall, there is a high level of spatially explicit soil information in the U.S. compared to emerging countries (2). Nonetheless, not all of the U.S. has detailed, spatially resolved soil information, such is the case with Native American Tribal Lands (3, 4). Therefore, fine resolution soil maps are needed for land-use decisions at farm and Tribal-levels for increased agricultural productivity and economic growth to combat food insecurity on U.S Reservations.
In most Tribal Lands, little-to-no actual soil data are represented in national soil products as Tribal Lands are autonomous Nations and with land ownership and data acquisition requirements prior to sampling being challenging and complex. This means that even the best soil information available for these regions is inadequate for addressing soil management needs at adequate scales. Oftentimes, Tribal Lands are faced with greater food insecurity, as well as the desire to cultivate culturally important crops (5). There is a need to deliver more detailed and current soil information to these communities for sustainable management of existing soil resources. A science-based approach to soil and crop management that utilizes the best available soil information is necessary to enable producers to make farm-level decisions. Many producers and communities will adopt land management practices when provided spatially explicit soil information (6).
The Quapaw Tribal Lands are located in northeastern Oklahoma, a region for which spatial soil information is only available through the Soil Survey Geographic Database (SSURGO), or through SSURGO's gridded version (gSSURGO) (7). In SSURGO, soil bodies are represented as discrete entities (i.e., map units) that enclose soil types (components). SSURGO's map units are delineated following a pedologist's mental model of the soil-landscape patterns that describe the spatial distribution of soil forming factors (8). Although SSURGO's map units are produced by expert pedologists through extensive field work, the spatial scale of these units may restrict their usefulness in supporting site-specific management. Moreover, the discrete nature of SSURGO's map units limits their use as inputs for data-driven decision support tools that rely on spatially continuous soil information. Technologic advances in geographic information systems (GIS), global positioning systems (GPS), remote and proximal soil sensing, and digital elevation models (DEM) provide more efficient ways of assessing the continuous spatial variability of soils and overcome some of the challenges implicit in SSURGO and other conventional soil survey methods (9).
Digital soil mapping (DSM) is a procedure for generating model informed maps of soil variability and function and may be used for optimizing soil management and use. Spatially explicit soil information and high-resolution digital layers related to soil-forming processes are used within DSM approaches to assess the spatial variability of soil types and properties (10). DSM allows for the presentation of the continuous nature of soils, as inherent soil variability is captured through quantitative models that relate soil attributes to the spatial distribution of soil-forming factors (11, 12). Moreover, the use of explicit quantitative models, built through DSM, allows soil scientists to evaluate the numerical precision and associated uncertainty of mapping outcomes. A quantitative-oriented evaluation of DSM outcomes is important for the adequate use of digital soil spatial information. Among DSM approaches [for a comprehensive review see (13)], inference systems based on expert-driven fuzzy logic allows for DSM in areas with limited access to soil information (11). When soil point data are scarce, the inference systems formalize the pedologist's mental model of soil-landscape relationships for subsequent spatial modeling of soil classes and properties. Data acquisition engines allow inference systems to “mine” expert knowledge and transfer it to quantitative frameworks for numerical modeling. According to Malone et al. (13), the SoLIM (Soil Land Inference Model) engine proposed by Zhu et al. (14) remains as one of the most well-known inference systems for expert-driven DSM.
In the current study, a DSM approach based on SoLIM is implemented for the spatially continuous modeling of Quapaw Tribal Lands soil properties. This approach allows for combining fuzzy logic-based SoLIM with data-mining techniques, a combination that has proven useful for DSM when expert knowledge is not available and soil point data are limited (2, 11, 15, 16). The objective of this study is therefore to produce first ever high-resolution soil property maps of the Quapaw Tribal Lands following a data-driven, fuzzy logic framework that accommodates limited data scenarios and compare this approach with gSSURGO. Although limited by available soil point data, it is expected that these soil property maps will set the baseline for upcoming versioning and development of site-specific spatial soil information for the Quapaw Tribal lands. High resolution soil information is necessary for management on small to medium size farms where efficiency gains can improve farm income. USDA Soil Survey has been the baseline for soil information for management; however, with increasing data spatial data availability and increased computer processing, there is an opportunity to resolve and improve soil information.
Materials and Methods
Study Site and Current State of Spatial Soil Information
The Quapaw Tribal Lands are located in the northeast corner of Ottawa County in Oklahoma. The spatial extent of the study site is about 22,880 ha, of which ~24% is cropland and the remaining 76% is forest, grassland, wetland, and urban land (17). The average elevation of this area is 279 m, and it ranges from 229 m in the west to 329 m in the east. This reservation receives an average annual rainfall of about 1,089 mm, with a difference of ~88 mm between the driest and wettest months. The average temperature is 14.3°C and the coldest and warmest month, on average, is January (1.1°C) and July (26.4°C), respectively. The parent material (PM) of the site is mainly characterized by residuum from sandstone and shale in the west and residuum from limestone, cherty limestone, and dolomite in the east with alluvium from residuum sources and floodplains occurring on river channels, valleys, and terraces. The landcover in the eastern region is predominantly forested, while the western region is used as grazing lands and crop production. In the late 1800s, the Tri-State Mining District began mining and milling ore (primarily lead and zinc) and produced more than 500 million tons of waste material in this tribal area (primarily chat and fine tailings; Figure 1). Consequently, the U.S. Environmental Protection Agency established a Superfund site in Ottawa County (18). The Quapaw Nation is the only U.S. tribe responsible for cleanup of a Superfund Site, with 4 M tons out of the 75 M (~6%) source materials removed (324 ha for agricultural use).
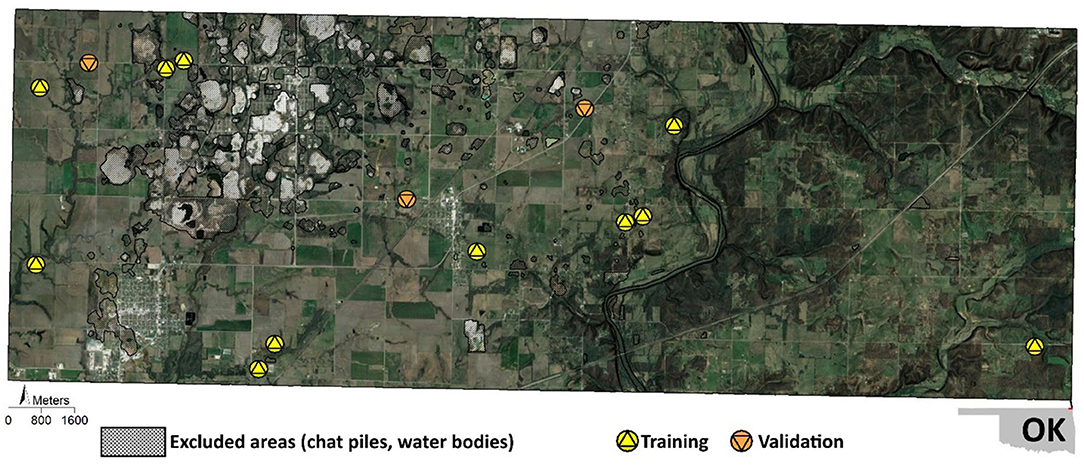
Figure 1. Map of the study site showing aerial imagery, excluded areas prior DSM activities, and location of collected soil samples.
Spatial soil information for the Quapaw Tribal Lands is currently available only through SSURGO. The current soil survey (1:24,000 scale) suggests that 25 dominant soil series occur across the study site (Soil Survey Staff, 2014). The occurrence of these series, their phases (i.e., surface texture, percent slope), and relationship with other series (through consociations, complexes, and associations) are spatially represented by 40 map units. Only 3 of the 25 mapped soil series cover 56% of the study area. Soils represented by these 3 series have a silt-loam texture and coarse fragments that increase in size as the slope increases. An important characteristic of the soils in the study site is that 9 of the 25 series exist as multiple phases within the site boundary. The occurrence of these phases responds to the heterogeneous topography, as denoted by hills of varying slope commonly occurring across the site. This suggests the importance of topography as a control for the spatial variability of soils in the study site. Figure 2 shows four map units for two soil series (each series with two phases according to the slope gradient). There are two major limitations of SSURGO data for this reservation: (i) the scale of the soil survey does not “capture” local patterns of topographic variability (Figure 2), and (ii) actual data for the study site are lacking. The latter is particularly important since the study site covers roughly 22,000 ha and no pedons have been sampled by the soil survey within the site's boundaries. Figure 3 shows the closest sampled pedons that better relate to map units of the study site.
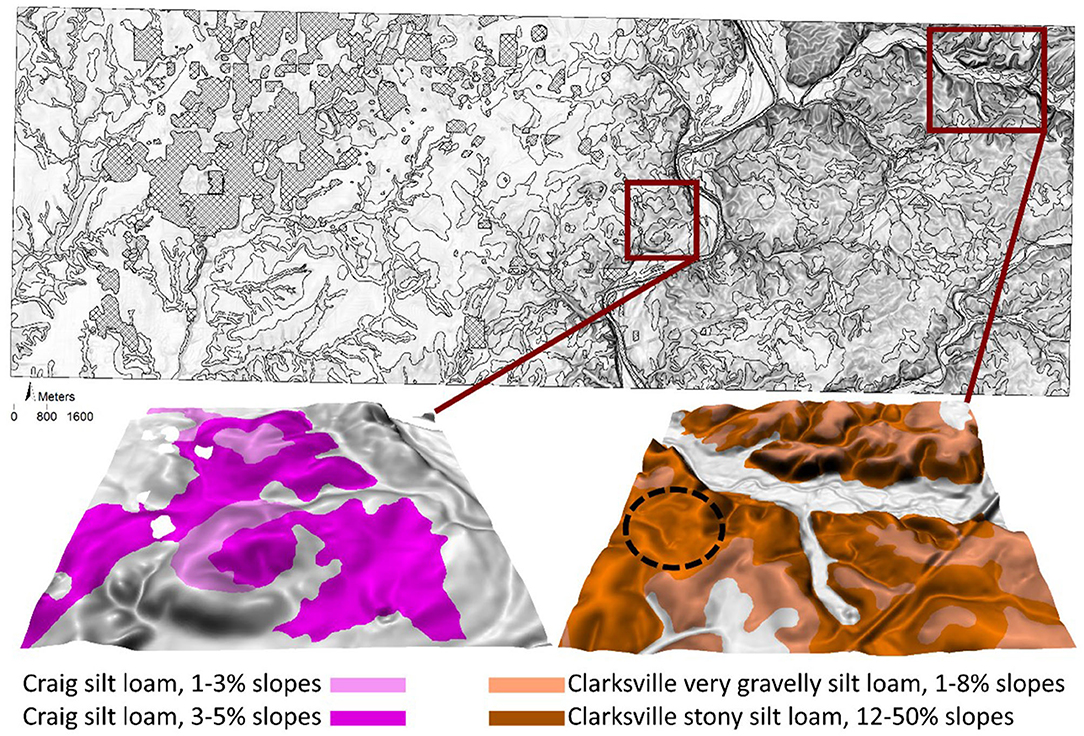
Figure 2. Map showing spatial subsets of two SSURGO soil series present in the study site and their slope-driven phases. SSURGO's map units are outlined over the study site's shaded terrain (top). The outlined circle on the bottom right spatial subset shows an example of the underrepresentation of local topography by SSURGO's map units due to mapping scale.
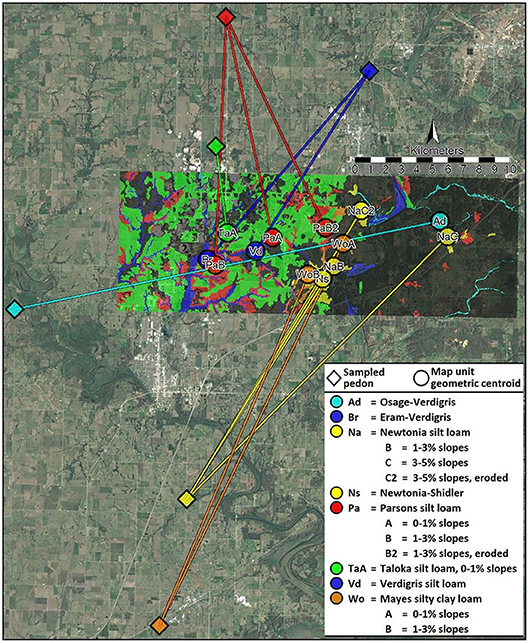
Figure 3. Map of closest sampled pedons related to SSURGO's map units in the study site. Those map units whose related sampled pedon is more than 30 km away from the unit's geometric centroid are excluded from the map.
Data Processing and Collection
Environmental Covariates
A bare-earth DEM of three-meter resolution was generated for the study site using lidar (light detection and ranging) data. The lidar data were obtained as a set of 133 point-cloud scenes downloaded from the National Map of the United States Geological Survey (https://apps.nationalmap.gov/downloader/#/). The ground returns of the point clouds were interpolated using the triangulated irregular network algorithm. A kernel-based smoothing filter and hydrologic enforcement was applied to the resulting DEM. A set of six terrain attributes were derived from the DEM using the SAGA (System for Automated Geoscientific Analyses) software (19), namely SAGA wetness index, normalized height, mid-slope position, valley depth, standardized height, and Strahler-based valley depth (20). The selection of these attributes was based on hydro-geomorphologic processes on the landscape, and the relationship of these processes with soil formation and development.
The SAGA wetness index quantifies the steady-state soil moisture potential as a function of the natural log ratio of modified specific catchment area to local slope. The SAGA wetness index has often been reported as an attribute of high (relative) importance for the prediction of soil properties and types (21–23). Normalized height, mid-slope position, and valley depth were selected given their relationship with translocation processes occurring at the catchment scale (20). Topography-driven surface translocation processes are important owing to their influence on the downslope movement of soil particles, especially smaller particles (24, 25). Standardized height and Strahler-based valley depth were selected to account for processes occurring at a broader scale and related to altitudinal and depressional gradients, as compared to the previously described terrain attributes.
In addition to terrain attributes, a raster map of soil PM was generated in four steps: (i) gSSURGO's map units were downloaded and tabular information derived for the study site by utilizing the dominant PM identified for mapping units, (ii) addition of PM as a new attribute for map units, (iii) aggregation of PMs into four dominant classes based on official soil series descriptions for the map units, and (iv) rasterization of the final PM classes to match the spatial resolution and extent of terrain attributes. The aggregation of PMs was performed to reduce the number of PM classes (Figure 4). Presumably, the aggregation of PM classes would reduce the number of soil samples required to capture a more complete feature space (2).
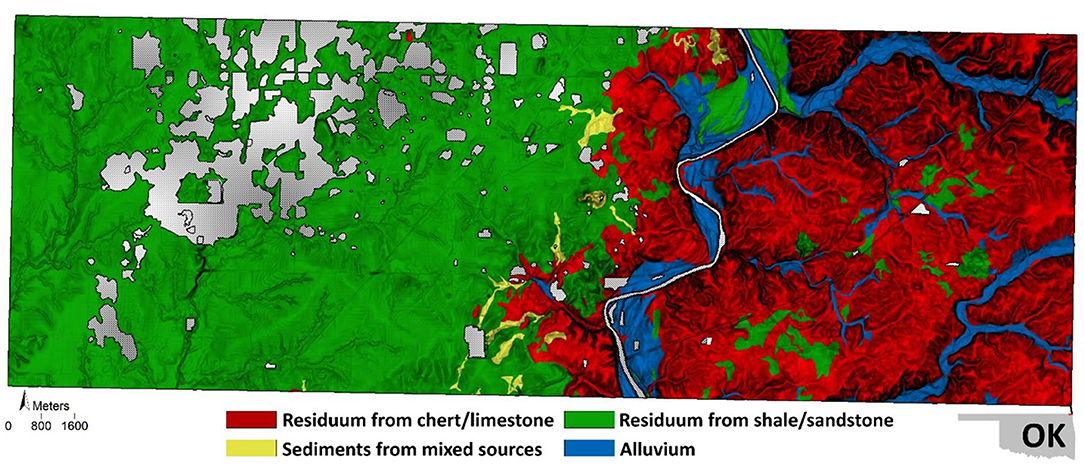
Figure 4. Map of parent material prepared for the study site.
Field Work and Lab Analysis
A set of 14 soil sampling locations was generated through the conditioned Latin hypercube sampling (cLHS) technique (26) and implemented in R language by Roudier (27). Sampling locations captured unique and distinct landscape conditions that influence soil development, without providing redundant information. Previously described environmental covariates were used as ancillary data for the cLHS. Once the sampling locations were defined, a sampling campaign was conducted October 2019 following Quapaw Tribal government, landowner, and cultural preservation approvals. A total of 28 Soil samples were collected from 14 locations [e.g., two samples per location according to depth intervals of: (i) 0–15 cm, and (ii) 15–30 cm] using auger boreholes (Figure 1).
Collected soil samples were air-dried and ground to pass through a 2-mm sieve for analysis. Particle size analysis was performed using a modified 12-h hydrometer method (28). Soil pH was determined using a 1:10 soil mass to water volume mixture. Mehlich-3 extractable nutrient concentrations (i.e., B, Ca, Cu, Fe, K, Mg, Mn, Na, P, S, Zn) were determined using a 1:10 soil mass to extractant solution volume ratio (29) and analyzed by inductively coupled argon-plasma spectrometry (ICP, Agilent Technologies, Santa Clara, CA). Total N and TOC were determined by combustion using a Vario Max CN analyzer (Elementar Americas). Table 1 shows descriptive statistics for soil properties and their corresponding units.
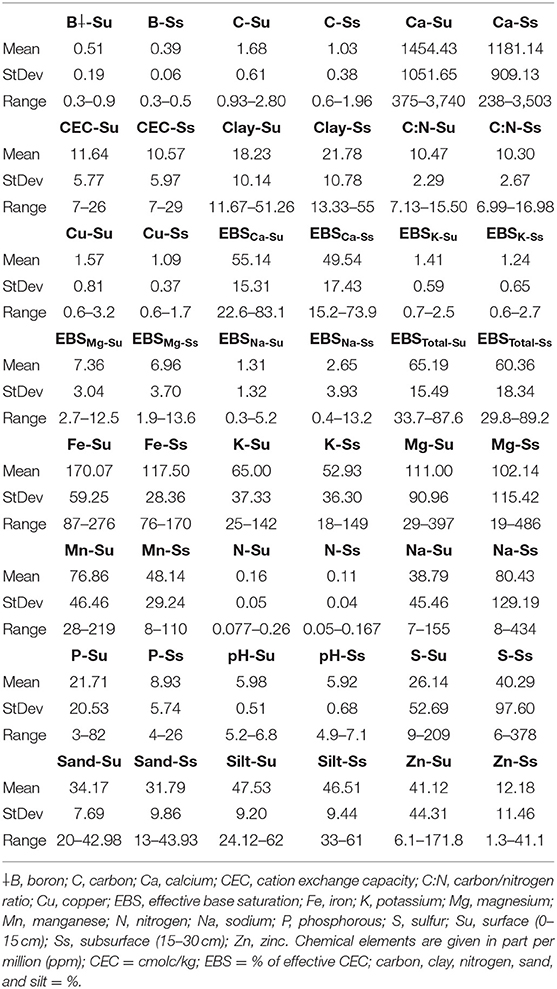
Table 1. Mehlich-3 extractable nutrients from soil samples collected in the Quapaw Tribal Lands in 2019 at two depths (0–15 and 15–30).
Digital Soil Mapping Approach
The DSM approach was based on the environmental similarity model proposed by Zhu and Band (30), Zhu (31), and Zhu et al. (14). These authors used expert pedologic knowledge to formalize relationships between distinct soil-forming environments and observed soil types. Parting from these relationships, a fuzzy inference engine was used to quantify the degree of association (i.e., membership) between soil-forming environments and soil types. According to the similarity model, the higher the membership value, the more favorable a distinct environment is for the occurrence of a given soil type. These authors referred to the complete set of memberships as the soil similarity vector (SSV), which is the basis of the environmental similarity model. Soil attributes like taxonomic classes and soil properties can be derived through hardening or weighted averaging the SSV, respectively. The environmental similarity model has been integrated in the SoLIM (Soil-Landscape Inference Model), which also supports knowledge acquisition routines and fuzzy inference (14).
For the present study, the application of the environmental similarity model for the continuous mapping of soil properties followed a data mining approach, similar to that proposed by Owens et al. (2). The data mining approach included the following steps: (i) cluster analysis of terrain attributes, (ii) construction of soil generic classes, (iii) construction of a ruleset and fuzzy inference of the SSV, and (iv) modeling of a soil property. Details of each step are presented next.
Cluster Analysis of Terrain Attributes
K-means cluster analysis based on the hill-climbing method (32) was performed on the raster layers of terrain attributes. A chain of clustering runs, each with a different number of clusters (k), was performed to select the “optimal” k. A clustering run with k clusters was considered optimal if the resulting clusters delineated areas related to hillslope positions (33), channels, and channel banks (local scale); further differentiated by altitudinal/depressional gradient (broad scale). Terrain clusters related to hillslope positions were desirable since erosional-depositional models have suggested that hillslope position is a factor influencing soil weathering, surface runoff, and lateral movement of soil particles, among other processes (33, 34). The further differentiation of hillslope positions based on altitudinal/depressional gradient was necessary to account for the broad scale at which topography might still exert control over soil development.
Construction of Soil Generic Classes
A soil generic class (SGC) is conceptualized as the spatial representation of a particular soil-forming environment where presumably landscape processes influence soil properties in a distinct manner (8). As a result, a given soil property will retain more homogeneity within a SGC compared to the heterogeneity present across SGCs. The SGCs were constructed by spatially intersecting the raster layers corresponding to terrain clusters and PM classes. The raster-based spatial intersection was performed through raster algebra (sum operator). Each resulting unit (i.e., pixels with the same integer value) indicated a specific combination of a hillslope position-related terrain feature and a parent material class.
Construction of a Ruleset and Fuzzy Inference of the SSV
Within SoLIM, rules determine the basis on which to quantify the membership of each location (i.e., raster pixel) in the study site to an SGC. The rule associated with an SGC was represented by a composition of values from terrain attributes and a single PM class value. For instance, SGC X was represented by moderate steady-state saturation potential, relatively low topographic position, and colluvial material, which in rule notation could be expressed as: SAGA wetness index = 15, normalized height = 0.25, and PM class = 1. Raster pixels that satisfied this rule were assigned a membership of 100% to SGC X. Conversely, raster pixels that did not satisfy this rule, received a partial membership that increased as pixel values (in multivariate space) approached values set in the rule (i.e., representative values). Fuzzy membership functions were applied within SoLIM to quantify the (partial) membership of every raster pixel to each SGC. The membership and its increase/decrease were adjusted by defining representative and threshold values, as explained next.
Representative and threshold values for SGCs from each terrain attribute were calculated through zonal statistics. The mean and the mean ± two standard deviations of each terrain attribute within the SGC served as the representative and threshold values, respectively. A membership of 100% was given to the representative value, whereas 50% was given to threshold values. All values smaller or greater than threshold values were automatically assigned a partial membership using the bell-shaped function. Given its discrete nature, PM was treated as a binary variable. Membership maps were constructed to associate the presence (100% membership) or absence (0% membership) of a PM class to each SGC. Once the ruleset was constructed, the pixel-wise fuzzy inference of membership to SGCs was performed. For a raster pixel, its overall membership to a SGC was calculated as the mean value of the memberships to the SGC calculated from each terrain attribute and PM class. The resulting membership layers composed the SSV for the study site.
Modeling of a Soil Property
The inference of a soil property consisted of a two-step process. In the first step, a representative soil property value (RSPV) was assigned to each SGC. The RSPV of a SGC was obtained from soil observation within the area enclosed by the SGC (if any). Of the 14 soil observations for this study, 11 (78%) were used for the assignment of RSPV. In the second step, the following equation (Equation 1) was applied pixel-wise:
where Pxy is the estimated soil property value P at pixel xy, is the membership value m at pixel xy for the SGC, and pk is the representative soil property value p for the SGC. This equation is equivalent to a weighted arithmetic mean, with RSPV as the data points to average and membership values as their corresponding weights. The continuous modeling of soil properties from RSPV and membership maps has been proposed by Zhu and Band (30). These authors suggested that given a specific location xy, a soil property will be influenced by all soil-forming conditions (e.g., SGCs in the present study). However, this influence will be proportional to the similarity between soil-forming conditions at xy and all conditions accounted for when formalizing soil-landscape relationships into (expert) rules.
Evaluation of Statistical Performance
The statistical performance of the soil property modeling was evaluated based on the root mean squared error (RMSE) and the mean absolute error (MAE). Of the total soil observations for this study, 21% were used for statistical evaluations of modeled soil properties. The RMSE is calculated as shown in the equation below (Equation 2):
where ŷ−y is the difference between the modeled value ŷ and the observed value y for the soil property; that is, the error. The MAE is calculated as shown in the equation below (Equation 3):
where |ŷ−y| is the absolute value of the error. Additionally, both RMSE and MAE were calculated for soil property maps derived from gSSURGO in order to evaluate the statistical performance of the DSM approach in relation to existing spatial soil information. These property maps were derived from the gSSURGO database using the weighted average of the representative property values for the components of the map units in the study site. Five common properties (from SSURGO and DSM) are compared in the next section.
Results
Cluster Analysis and Soil Generic Classes
Clustering analysis led to the identification of several generic soil classes, which possess similar parent material and topographic positions. Close examination of clusters with different k and overlaying a raster layer of shaded terrain suggested k = 17 as a reasonable number of clusters to represent the topographic complexity of the study area. The resulting terrain clusters successfully discriminated between features resembling hillslope positions across the altitudinal gradient of the study site (Figure 5).
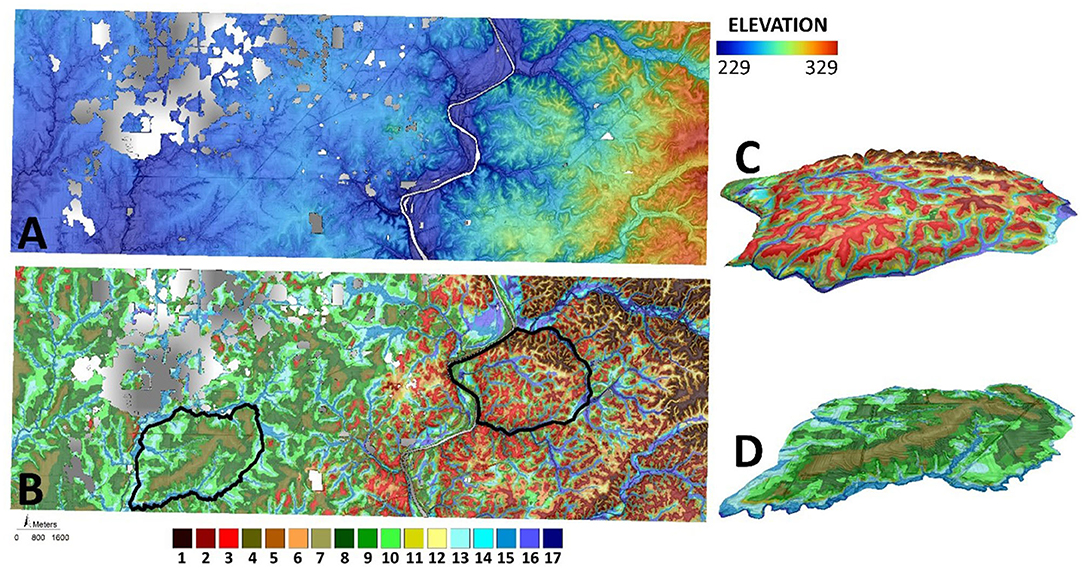
Figure 5. Elevation of the study site (A), terrain cluster (B) and 3D spatial subsets of regions within the Ozark Uplift (C), and the Cherokee Platform (D). Color blocks on the bottom of the figure indicate each one of the terrain clusters.
The spatial intersection between the 17 terrain clusters and the 4 PM classes resulted in a total of 66 SGCs. When compared to gSSURGO map units for the study site, SGCs indicated gain in spatial detail of the resulting units (Figure 6). This increase was expected as terrain clusters and inputs for the construction of SGCs were created from terrain attributes derived from a 3-meter DEM. Moreover, SGCs better discriminated among topographic patterns, as compared to gSSURGO map units. However, SGCs are not proposed as a replacement for gSSURGO map units, as SGCs in the present study are focused on high resolution interactions with topography and parent material where water redistribution at the local scale is the primary driver of soil property differences.
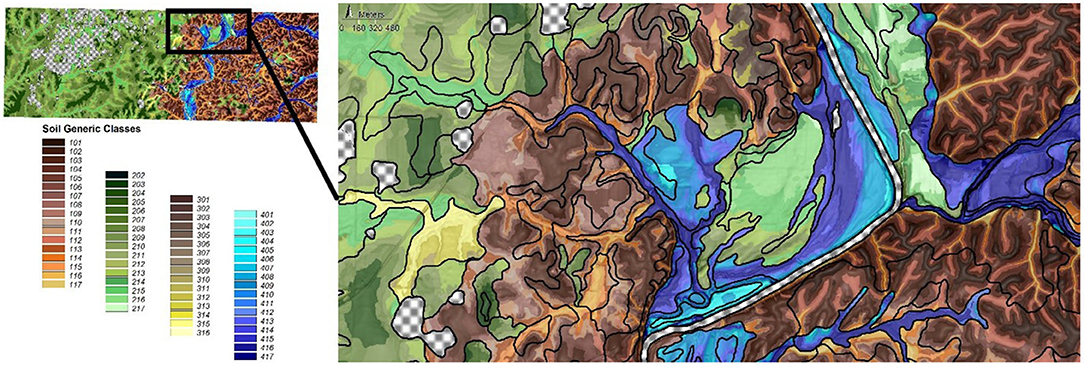
Figure 6. Spatial subset of the soil generic classes (SGCs) with gSSURGO map units overlaying the Soil Generic Classes as black-outlined polygons.
Soil Property Maps
Thirteen out of the 24 modeled properties resulted in lower MAE and RMSE at the 15–30 cm depth, reflected by the lower standard deviation of their values at the subsurface vs. the surface (Table 1). For physical properties, only percent sand resulted in lower MAE and RMSE at the 0–15 cm depth. Conversely, percent clay and silt were better modeled at the 15–30 cm depth (Table 2). Of the seven macronutrients (C, Ca, K, Mg, N, P, and S), all but two (Mg and S) resulted in lower MAE and RMSE at the 15–30 cm depth (Table 2). Similar results were obtained for the micronutrients (B, Cu, Fe, Mn, Na, and Zn), where all but two (Mn and Na) resulted in lower MAE and RMSE at the 15–30 cm depth (Table 2). Conversely, the majority of the effective base saturations were better modeled at the 0–15 cm depth, which was also the case for C:N and pH (Table 2). When compared to gSSURGO-derived maps, some of the properties modeled by the DSM approach resulted in lower MAE and RMSE. For the 0–15 cm depth, DSM resulted in lower MAE and RMSE for percent clay and sand. Contrary, gSSURGO-derived maps for percent silt, pH, and CEC resulted in lower MAE and RMSE at this depth. For the 15–30 cm depth, the DSM approach resulted in lower MAE and RMSE for percent clay, pH, and CEC, while gSSURGO-derived maps for percent sand and silt resulted in lower MAE and RMSE at this depth (Table 2).
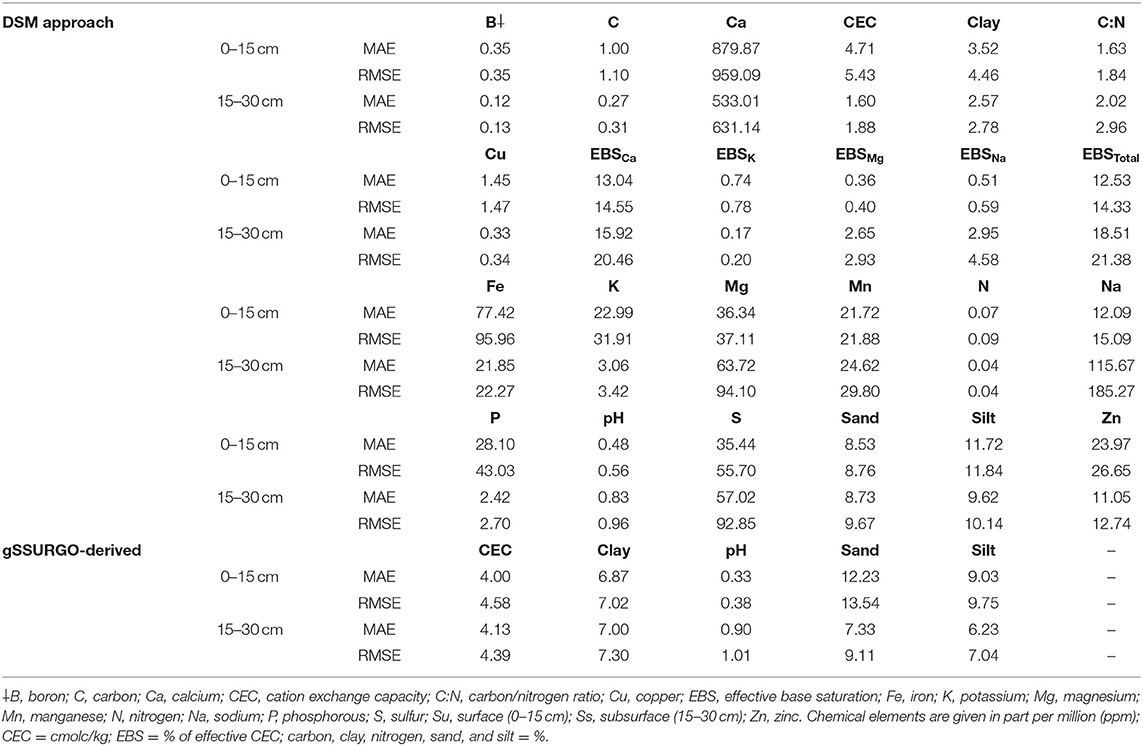
Table 2. Root mean squared error (RMSE) and mean absolute error (MAE) for the soil properties modeled by the proposed DSM approach and those derived from gSSURGO.
Discussion
Overall, hillslope-related terrain features were more developed at medium-to-high altitudes, compared to lower altitudes. This result was expected given the difference in age and composition of the surface geologic material between regions in high and low altitudes (Figure 5). The region at higher altitudes is part of the Ozark Uplift, which is mainly composed of cherty marine limestone from the Early Mississippian (35). Given this region's age and the relatively higher rate of weathering in limestone, dissected hills with well-developed slopes are dominant. Conversely, the lower altitude region is part of the Cherokee Platform, which is mainly composed of marine shale interbedded with sandstone from the Middle Pennsylvanian (35). Material in this region is younger and more resistant to weathering; therefore, hills are less dissected, and slopes are less developed. Overall, the selected terrain attributes and the cluster analysis were useful in modeling terrain patterns at both local (hillslope) and broad (altitude) scales. The selected terrain attributes and resulting clusters were also in agreement with the surficial geologic settings. Although not the focus of this study, the concordance between terrain patterns and the geology of the study site exposes the potential of high-resolution digital terrain modeling for the spatial assessment of surficial geology.
Overall, modeling of soil properties by DSM did not show a consistent trend related to the statistical performance as a function of soil depth. Some studies have suggested that DSM approaches tend to perform better when modeling properties near the soil surface (21). From a qualitative standpoint, the DSM approach produced property maps with variability in values more similar to that of the measured data, as compared to gSSURGO-derived maps (Figure 7). The variability of property values resulting from the DSM approach was in accordance with the topographic complexity of the study area. As a result, soil surface property maps produced using the DSM approach were in better agreement with expected soil-landscape relationships. For instance, percent sand, as modeled by the DSM approach, was higher for soils developing over material with interbedded shale and sandstone, as compared to those soils developing on cherty limestone. Conversely, the gSSURGO-derived percent sand map resulted in lower values for soils developing on shale/sandstone interbedding, as compared to soils from cherty limestone. Sandier soils tend to form from sandstones as compared to limestone, thus, the percent sand modeled by the DSM approach agreed with expected sand content, given distinct PMs. Furthermore, the hillslope-scale patterns of percent sand, as modeled by the DSM approach, showed higher sand content for soils developing on shoulder-to-backslope positions (Figure 8). This trend was expected as finer soil particles developed at these positions and are more prone to lateral downslope transportation by surface runoff than coarser particles like sand, thus resulting in greater sand concentrations in these positions. For gSSURGO-derived sand percent, this expected hillslope-scale variability was not found. Presumably, the spatial detail of gSSURGO map unit delineations was not high enough to capture the spatial variability of soil properties at the hillslope scale. Moreover, the assignment of a single soil property value for the whole area enclosed by a map unit does not represent the within-unit soil-continuum in gSSURGO-derived property maps.
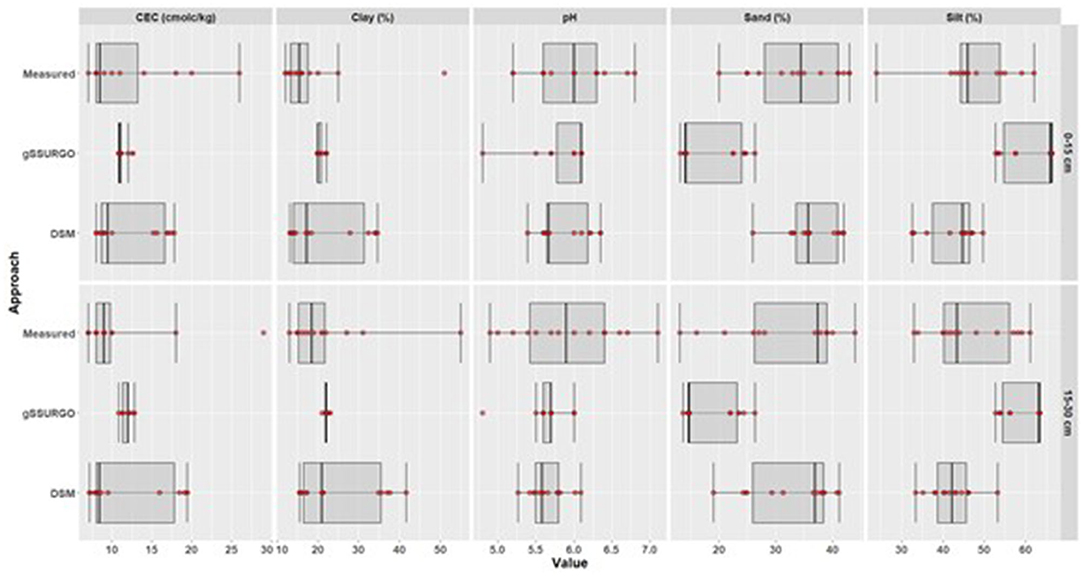
Figure 7. Boxplots showing the variability in soil property values across the two depths for measured data, gSSURGO-derived maps, and maps developed through the DSM approach.
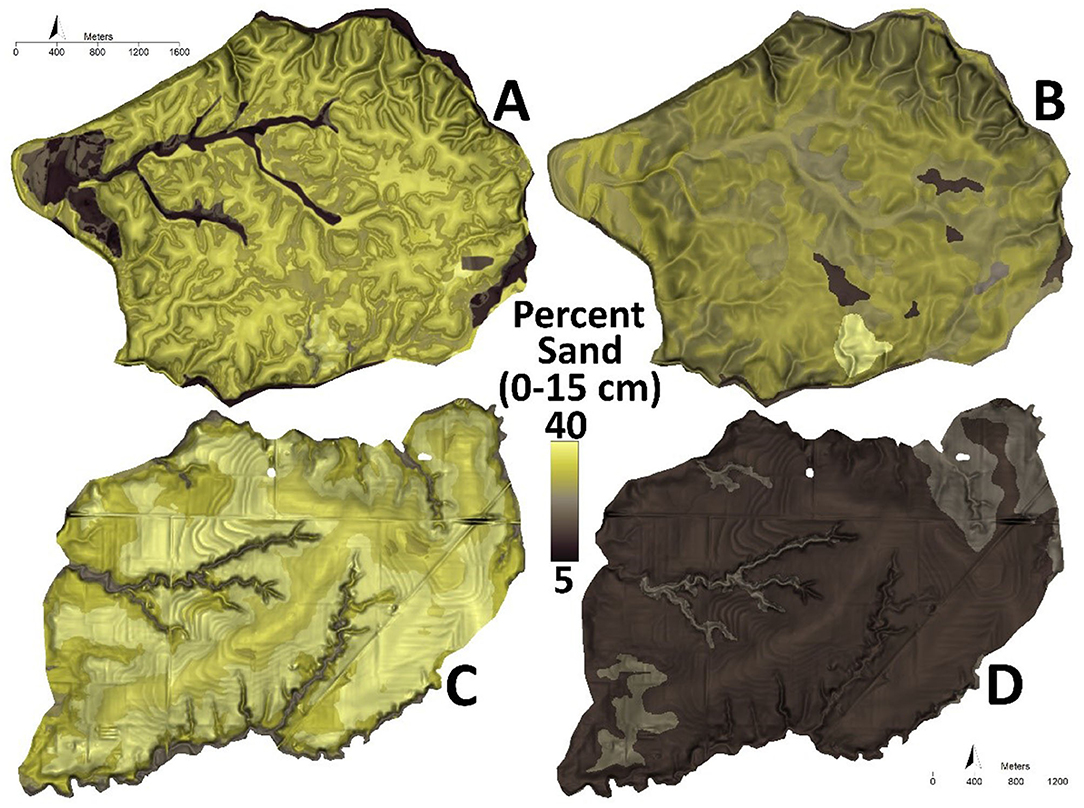
Figure 8. Spatial subsets of percent sand (0–15 cm). Subsets show the spatial variability of percent sand within the Ozark Uplift, as modeled by the DSM approach (A) and gSSURGO-derived (B), and within the Cherokee Platform, as modeled by the DSM approach (C) and gSSURGO-derived (D).
In addition to percent sand, patterns in soil pH from the DSM approach also agreed with the expected variability at hillslope-scales. Specifically, soil pH values from the DSM approach were lower in areas where the slope and relatively higher sand content allows for better soil drainage (i.e., shoulder and backslopes), compared to flat areas with relatively higher clay content (i.e., summit and toeslopes) which might lead to poor drainage or ponding (Figure 9). The compound effect of a steeper slope and sandier texture may result in lower amounts of organic matter and better drainage. These conditions may promote a lower buffering capacity and higher rates of infiltration. Ultimately, these conditions promote leaching of basic cations from soil, which results in a lower pH (36). As with percent sand, gSSURGO-derived pH did not show this hillslope-related spatial variability (Figure 9). Nonetheless, gSSURGO-derived pH did show a coarser spatial pattern in soil pH consistent with that expected for study site conditions. As previously noted, the coarser patterns in soil pH of gSSURGO-derived maps are likely due to the lower detail in delineations and that a single soil property value is allocated across the area enclosed by each map unit (Figure 9). It is important to note, however, that pH can be heavily influenced by anthropogenic inputs such as lime or fertilizers; thus, this should be taken into consideration when interpreting results obtained by both approaches.
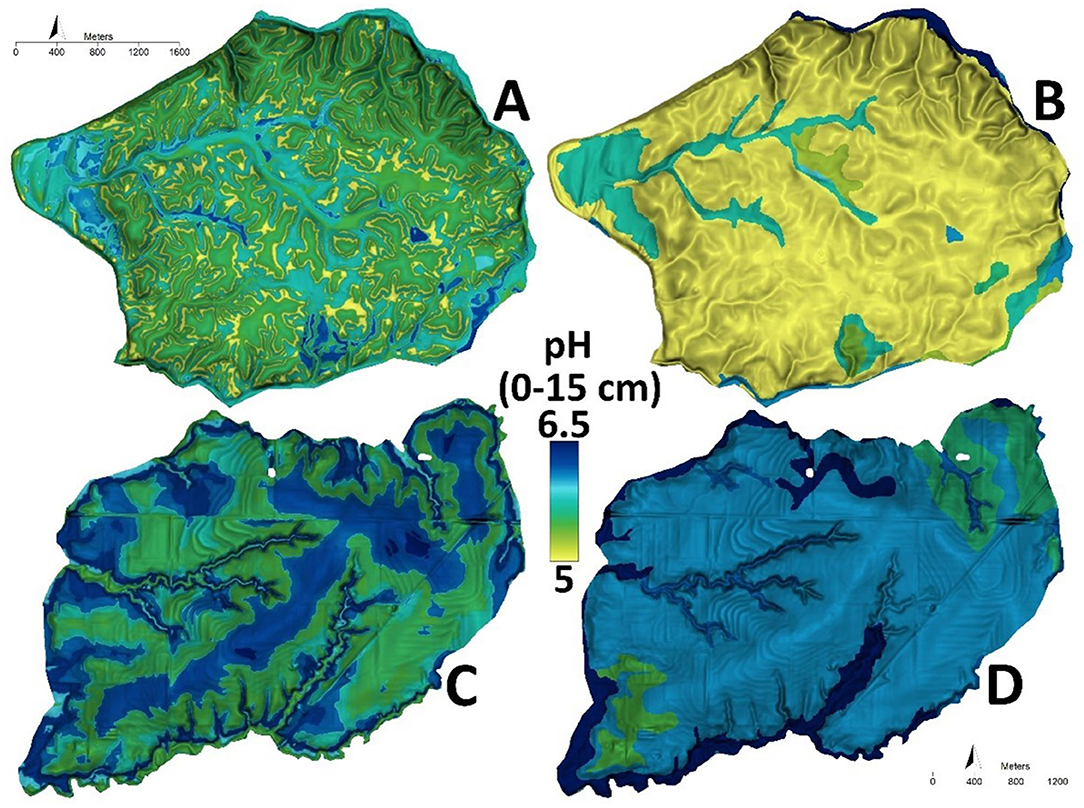
Figure 9. Spatial subsets of pH (0–15 cm). Subsets show the spatial variability of pH within the Ozark Uplift, as modeled by the DSM approach (A) and gSSURGO-derived (B), and within the Cherokee Platform, as modeled by the DSM approach (C) and gSSURGO-derived (D).
The CEC map produced via DSM showed a spatial distribution consistent with that of percent clay and clay activity, the latter as indicated by taxonomic descriptions of dominant soil series in the study site (Soil Survey Staff, 2020; Figure 10). Soil CEC is largely determined by the amount and type of clay minerals (37, 38). A higher content of active clay promotes a higher soil CEC. For the study site, soils developing on the Ozark Uplift are mainly described as Ultisols containing inactive clays (Soil Survey Staff, 2020). Contrary, those developing on the Cherokee Platform are mainly described as Alfisols containing active clays (Soil Survey Staff, 2020). The CEC values, as modeled by the DSM approach, were consistent with this difference in clay type; that is, modeled CEC values were generally greater in soils developed on the Cherokee Platform, as compared to those from the Ozark Uplift. Overall, highest CEC values were found in soils of channels and floodplains, especially those formed in recent alluvium. According to the existing soil survey, these soils contain the highest clay content and most active clays in the study site (Soil Survey Staff, 2020). As with pH, the gSSURGO-derived CEC maps displayed similar but coarser patterns in CEC values than those modeled by DSM (Figure 10). This spatially explicit soil property information may be used in Agricultural Resource Management Plans at the Tribal Nation Level for improved agricultural management decision making and ultimately for improved food security.
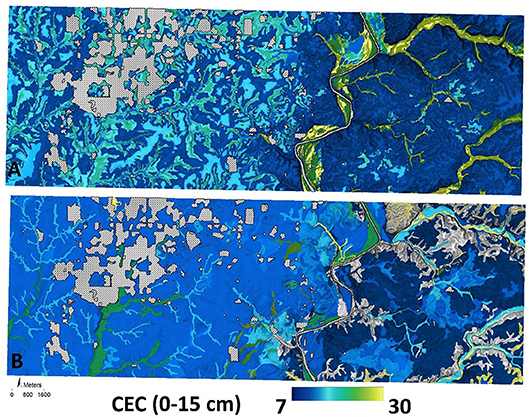
Figure 10. Cation exchange capacity (CEC) as modeled by the DSM approach (A), and gSSURGO-derived (B). Units of CEC are given in cmolc/kg. Areas with spatial gaps resulted for the gSSURGO derived CEC maps due to the lack of representative values for some map units.
Conclusion
To improve management and efficiency of agricultural practices and ultimately food security on Tribal Lands, high-resolution and detailed soil information is needed to understand the functional variability across landscapes. Inevitably, soil point data are limited in most areas where high-resolution information is needed for farm-level decisions. Statistical procedures combined with knowledge and soil point data can be used to generate initial versions of spatial soil predictions. This study was conducted to produce up-to-date and high-resolution soil property maps for the Quapaw Tribal Lands with limited data for more sustainable food systems. These property maps are a considerable advancement in the current state of spatial soil information for Quapaw Tribal Lands, a site for which no SSURGO pedon data have been collected. The collection of soil information specific for Quapaw Tribal Lands, in addition to the use of high-resolution inputs for DSM, allowed for the production of soil property maps that were in better agreement with hillslope-scale soil-landscape relationships observed in the study site, as compared to the over-simplified and discretized representation of soil spatial variability by gSSURGO's map units.
Soil property maps produced by the DSM approach represents advancement in the state of spatial soil information for Quapaw Tribal Lands. Overall, this effort is aimed at producing spatially explicit and site-specific information to support Tribal Lands' soil-land resource management. As future work, map versioning should be adopted to improve the DSM outputs in terms of statistical performance and pedological reasoning. Future work will also evaluate current DSM approaches' ability to predict soil properties on the reclaimed Super Fund site. Lastly, future work will focus on developing crop suitability index and soil health maps based on this DSM base information for optimized soil management plans at the Tribal Nation level.
This study provides a framework for conducting future DSM activities on Tribal Lands for improving the accuracy and detail of soil property maps (relative to off the shelf products such as SSURGO) that better represents soil-forming environments and the spatial variability of soil properties on Tribal Lands. Considering, current users of soil data are relying on a published a soil survey which has zero data points represented in this area, maps and methods provided herein provides a framework for versioning where future data collection can be added to improve the later versions. This soil property modeling ultimately provides soil information for precision management and more sustainable food production systems.
Data Availability Statement
The raw data supporting the conclusions of this article will be made available by the authors, without undue reservation.
Author Contributions
AA procured external funding, conceived work, oversaw data collection, and reviewed the final version on the manuscript. BF oversaw digital soil mapping analysis and drafting of the manuscript. MN oversaw data collection, sample procurement, and reviewed the final version of the manuscript. PO directed digital soil mapping procedures and reviewed the final version of the manuscript. All authors contributed to the article and approved the submitted version.
Conflict of Interest
The authors declare that the research was conducted in the absence of any commercial or financial relationships that could be construed as a potential conflict of interest.
Acknowledgments
Authors are grateful to Taylor Adams with the USDA-ARS; Rick DeBois and Alexis Dixon with the University of Arkansas; and, Tim Kent, Craig Kreman, and Summer King with the Quapaw Nation Environmental Office for their assistance during soil sampling and identifying sampling locations, as well as Janie Hipp, Colby Duren, and Erin Parker with the Indigenous Food and Agriculture Initiative for their programmatic and project oversight. This project was made possible by the Foundation for Food and Agriculture, New Innovator Award (993-6022-006; Award number: 0000000025). Mention of trade names or commercial products in this publication is solely for the purpose of providing specific information and does not imply recommendation or endorsement by the U.S. Department of Agriculture. This project was ultimately made possible due to Quapaw landowners providing land access and data acquisition, without which, this project would not have been possible.
Abbreviations
cLHS, conditioned Latin hypercube sampling; DSM, digital soil mapping; DEM, digital elevation model; GIS, geographic information systems; gSSURGO, Gridded Soil Survey Geographic Database; GPS, global positioning systems; MAE, mean absolute error; PM, parent material; RMSE, root mean squared error; SAGA, System for Automated Geoscientific Analyses; SGC, soil generic class; SoLIM, Soil Landscape Inference Model; SSV, soil similarity vector; RSPV, representative soil property value.
References
1. Foley JA, Ramankutty N, Brauman KA, Cassidy ES, Gerber JS, Johnston M, et al. Solutions for a cultivated planet. Nature. (2011) 478:337–42. doi: 10.1038/nature10452
2. Owens PR, Dorantes MJ, Fuentes BA, Libohova Z, and Schmidt A. Taking digital soil mapping to the field: lessons learned from the water smart agriculture soil mapping project in Central America. Geoderma Regional. (2020) 22:118–37. doi: 10.1016/j.geodrs.2020.e00285
3. deLemos JL, Brugge D, Cajero M, Downs M, Durant JL, George CM, et al. Development of risk maps to minimize uranium exposures in the Navajo Churchrock mining district. Environ Health. (2009) 8:29. doi: 10.1186/1476-069X-8-29
4. Hipp J, and Givens M. Reimagining Native Food Economies. Native American Agriculture Fund (2020). Available online at: https://nativeamericanagriculturefund.org/wp-content/uploads/2020/10/NAAF_NativeFoodEcon_Spread.pdf (accessed December 4, 2020).
5. Bassols NB, Zinck JA, and Ranst EV. Symbolism, knowledge and management of soil and land resources in indigenous communities: ethnopedology at global, regional and local scales. Catena. (2006) 65:118–37. doi: 10.1016/j.catena.2005.11.001
6. Winklerprins AM. Insights and applications local soil knowledge: a tool for sustainable land management. Soc Nat Resour. (1999) 12:151–61. doi: 10.1080/089419299279812
7. USDA, Natural Resources Conservation Service. Gridded Soil Survey Geographic (gSSURGO) Database: User Guide. Washington, DC: National Soil Survey Center (2016).
8. Jenny H. Factors of Soil Formation: A System of Quantitative Pedology. New York, NY: McGraw Hill Book Company. (1941). p. 281.
9. McBratney AB, Mendonca Santos ML, and Minasny B. On digital soil mapping. Geoderma. (2003) 117:3–52. doi: 10.1016/S0016-7061(03)00223-4
10. Lagacherie P, and McBratney AB. Spatial soil information systems and spatial soil inference systems: perspectives for Digital Soil Mapping. In: Lagacherie P, McBratney AB, Voltz M, editors. Digital Soil Mapping: An Introductory Perspective. Amsterdam: Elsevier (2007). p. 3–24.
11. Zhu AX, Yang L, Li B, Qin C, English E, Burt JE, et al. Purposive sampling for digital soil mapping for areas with limited data. In: Hartemink AE, McBratney A, de Mendonça-Santos ML, editors. Digital Soil Mapping With Limited Data. Dordrecht: Springer Netherlands (2008). p. 233–45.
12. McBratney AB, and Odeh IOA. Applications of fuzzy sets in soil science: Fuzzy logic, fuzzy measurements and fuzzy decisions. Geoderma. (1997) 77:85–113. doi: 10.1016/S0016-7061(97)00017-7
13. Malone BP, Odgers NP, Stockmann U, Minasny B, and McBratney AB. Digital mapping of soil classes and continuous soil properties. In: McBratney AB. Minasny B, Stockmann U, editors. Pedometrics, Progress in Soil Science. Cham: Springer International Publishing (2018). p. 373–413.
14. Zhu AX, Band L, Vertessy R, and Dutton B. Derivation of soil properties using a soil land inference model (SoLIM). Soil Sci Soc Am J. (1997) 61:523. doi: 10.2136/sssaj1997.03615995006100020022x
15. Yang L, Zhu AX, Li BL, Qin CZ, Pei T, Liu BY, et al. Extraction of knowledge about soil-environment relationship for soil mapping using Fuzzy c-means (FCM) clustering (in Chinese with English abstract). Acta Pedol Sin. (2007) 44:784–91.
16. Yang L, Jiao Y, Fahmy S, Zhu A-X, Hann S, Burt JE, et al. Updating conventional soil maps through digital soil mapping. Soil Sci Soc Am J. (2011) 75:1044–53. doi: 10.2136/sssaj2010.0002
17. USDA, National Agricultural Statistics Service Cropland Data Layer. Published Crop-Specific Data Layer. Washington, DC: USDA-NASS (2019). Available online at: https://nassgeodata.gmu.edu/CropScape/ (accessed June 28, 2020).
18. US EPA. Record of Decision Operable Unit 4 Chat Piles, Other Mine and Mill Waste, and Smelter Waste Tar Creek Superfund Site. Ottawa County, OK: U.S. Environmental Protection Agency, Region 6. (2008).
19. Conrad O, Bechtel B, Bock M, Dietrich H, Fischer E, Gerlitz L, et al. System for automated geoscientific analyses (SAGA) v. 2.1. 4. Geosci. Model Dev. Discuss. (2015) 8:2271–312. doi: 10.5194/gmdd-8-2271-2015-supplement
20. Boehner J, and Selige T. Spatial prediction of soil attributes using terrain analysis and climate regionalization. In: Böhner J, McCloy KR, Strobl J, editors. SAGA. Analysis and Modelling Applications. Verlag Erich Goltze GmbH. (2006). p. 13–27.
21. Adhikari K, Kheir RB, Greve MB, Bøcher PK, Malone BP, Minasny B, et al. High-resolution 3-D mapping of soil texture in Denmark. Soil Sci Soc Am J. (2013) 77:860–76. doi: 10.2136/sssaj2012.0275
22. Dorji T, Odeh IO, Field DJ, and Baillie IC. Digital soil mapping of soil organic carbon stocks under different land use and land cover types in montane ecosystems, Eastern Himalayas. Forest Ecol Manage. (2014) 318:91–102. doi: 10.1016/j.foreco.2014.01.003
23. Brungard CW, Boettinger JL, Duniway MC, Wills SA, and Edwards TC Jr. Machine learning for predicting soil classes in three semi-arid landscapes. Geoderma. (2015) 239:68–83. doi: 10.1016/j.geoderma.2014.09.019
24. De Bruin S, and Stein A. Soil-landscape modelling using fuzzy c-means clustering of attribute data derived from a digital elevation model (DEM). Geoderma. (1998) 83:17–33. doi: 10.1016/S0016-7061(97)00143-2
25. Pachepsky YA, Timlin DJ, and Rawls WJ. Soil water retention as related to topographic variables. Soil Sci Soc Am J. (2001) 65:1787–95. doi: 10.2136/sssaj2001.1787
26. Minasny B, and McBratney AB. A conditioned Latin hypercube method for sampling in the presence of ancillary information. Comput Geosci. (2006) 32:1378–88. doi: 10.1016/j.cageo.2005.12.009
27. Roudier P. clhs: A R Package for Conditioned Latin Hypercube Sampling. (2011). Available online at: https://cran.r-project.org/web/packages/clhs/index.html (accessed December 4, 2020).
28. Gee GW, and Or D. “Particle size analysis,” in Methods of Soil Analysis, Part 4. Physical methods. Soil Sci Soc Am Book Ser. (2002) 5:255–93. doi: 10.2136/sssabookser5.4.c12
29. Tucker MR. Determination of phosphorus by Mehlich 3 extraction. Soil and media diagnostic procedures for the southern region of the United States. Virginia agricultural experiment station. Ser Bull. (1992) 374:6–8.
30. Zhu AX, and Band LE. A knowledge-based approach to data integration for soil mapping. Can J Remote Sens. (1994) 20:408–18. doi: 10.1080/07038992.1994.10874583
31. Zhu AX. A similarity model for representing soil spatial information. Geoderma. (1997) 77:217–42. doi: 10.1016/S0016-7061(97)00023-2
32. Rubin J. Optimal classification into groups: an approach for solving the taxonomy problem. J Theor Biol. (1967) 15:103–44. doi: 10.1016/0022-5193(67)90046-X
34. Milne G. A Provisional Soil Map of East Africa. Tanganyika Territory: Amani Memoirs, East African Agricultural Research Station (1936).
35. Hoagland BW. Vegetation of Oklahoma. In: Johnson KS, Luza KV, editors. Earth Sciences and Mineral Resources of Oklahoma. Oklahoma Geological Survey Educational Publication. (2008). Available online at: http://www.biosurvey.ou.edu/download/publications/HoaglandOGS08.pdf (accessed December, 4 2020).
36. Helyar KR, Cregan PD, and Godyn DL. Soil acidity in New-South-Wales-Current pH values and estimates of acidification rates. Soil Res. (1990) 28:523–37. doi: 10.1071/SR9900523
37. Kamprath EJ, and Smyth TJ. Liming. In: Hillel D, editor. Encyclopedia of Soils in the Environment. Oxford: Elsevier (2005). p. 350–8.
Keywords: cluster analysis, digital soil mapping, fuzzy logic, tribal lands, soil-landscape relationships
Citation: Fuentes B, Ashworth AJ, Ngunjiri M and Owens P (2021) Mapping Soil Properties to Advance the State of Spatial Soil Information for Greater Food Security on US Tribal Lands. Front. Soil Sci. 1:695386. doi: 10.3389/fsoil.2021.695386
Received: 14 April 2021; Accepted: 08 June 2021;
Published: 06 July 2021.
Edited by:
Pierre Roudier, Manaaki Whenua Landcare Research, New ZealandReviewed by:
Brendan Malone, Commonwealth Scientific and Industrial Research Organisation (CSIRO), AustraliaZamir Libohova, United States Department of Agriculture (USDA), United States
Copyright © 2021 Fuentes, Ashworth, Ngunjiri and Owens. This is an open-access article distributed under the terms of the Creative Commons Attribution License (CC BY). The use, distribution or reproduction in other forums is permitted, provided the original author(s) and the copyright owner(s) are credited and that the original publication in this journal is cited, in accordance with accepted academic practice. No use, distribution or reproduction is permitted which does not comply with these terms.
*Correspondence: Amanda J. Ashworth, amanda.ashworth@usda.gov