Whole Community Metatranscriptomes and Lipidomes Reveal Diverse Responses Among Antarctic Phytoplankton to Changing Ice Conditions
 Jeff S. Bowman1*
  Benjamin A. S. Van Mooy2
  Daniel P. Lowenstein2
  Helen F. Fredricks2
  Colleen M. Hansel2
  Rebecca Gast2
  James R. Collins2,3
  Nicole Couto1
  Hugh W. Ducklow4
- 1Scripps Institution of Oceanography, University of California, San Diego, San Diego, CA, United States
- 2Woods Hole Oceanographic Institution, Woods Hole, MA, United States
- 3School of Oceanography, University of Washington, Seattle, WA, United States
- 4Lamont-Doherty Earth Observatory, Columbia University, Palisades, NY, United States
The transition from winter to spring represents a major shift in the basal energy source for the Antarctic marine ecosystem from lipids and other sources of stored energy to sunlight. Because sea ice imposes a strong control on the transmission of sunlight into the water column during the polar spring, we hypothesized that the timing of the sea ice retreat influences the timing of the transition from stored energy to photosynthesis. To test the influence of sea ice on water column microbial energy utilization we took advantage of unique sea ice conditions in Arthur Harbor, an embayment near Palmer Station on the western Antarctic Peninsula, during the 2015 spring–summer seasonal transition. Over a 5-week period we sampled water from below land-fast sea ice, in the marginal ice zone at nearby Palmer Station B, and conducted an ice removal experiment with incubations of water collected below the land-fast ice. Whole-community metatranscriptomes were paired with lipidomics to better understand how lipid production and utilization was influenced by light conditions. We identified several different phytoplankton taxa that responded similarly to light by the number of genes up-regulated, and in the transcriptional complexity of this response. We applied a principal components analysis to these data to reduce their dimensionality, revealing that each of these taxa exhibited a strikingly different pattern of gene up-regulation. By correlating the changes in lipid concentration to the first principal component of log fold-change for each taxa we could make predictions about which taxa were associated with different changes in the community lipidome. We found that genes coding for the catabolism of triacylglycerol storage lipids were expressed early on in phytoplankton associated with a Fragilariopsis kerguelensis reference transcriptome. Phytoplankton associated with a Corethron pennatum reference transcriptome occupied an adjacent niche, responding favorably to higher light conditions than F. kerguelensis. Other diatom and dinoflagellate taxa had distinct transcriptional profiles and correlations to lipids, suggesting diverse ecological strategies during the polar winter–spring transition.
Introduction
The western Antarctic Peninsula is a region characterized by a highly dynamic sea ice regime. Seasonal and higher frequency shifts in sea ice cover are superimposed on large, inter-annual variations in ice thickness and extent. In the coastal zone this variability coincides with the zone of highest biological productivity, setting the stage for strong physical control of biological processes that enable the region’s rich marine ecosystem (Bowman et al., 2016). During the winter–spring seasonal transition, sea ice rapidly advects in and out of the shallow coastal zone. This sea ice impacts phytoplankton communities by limiting light penetration into the surface ocean and stabilizing the surface mixed layer. Though sea ice cover leads to a shallow mixed layer, a scenario conducive to a strong spring bloom, it also decreases the light available to drive photosynthesis. In regions of highly variable sea ice cover phytoplankton must respond to rapidly changing light conditions independent of the circadian rhythms available to coordinate metabolic responses in lower latitude oceans.
Phytoplankton utilize a number of strategies to survive periods of prolonged darkness. While some utilize cysts or resting spores, and are thus metabolically inactive, others rely on lipid or carbohydrate energy stores to survive periods of prolonged darkness. Recent analysis of the translational response of Fragilariopsis cylindrus, a model sea ice diatom, to prolonged darkness suggests regulation of multiple systems to sustain cell function and enable a fast response to light (Kennedy et al., 2019). Specifically, those authors identified an increase in proteins diagnostic of catabolic processes including glycolysis, the Entner–Doudoroff pathway, and the tricarboxylic acid cycle. Significantly, however, proteins that are necessary for photosynthesis and related anabolic functions were not necessarily less abundant during prolonged darkness. This suggests an adaptation to the extreme seasonal cycle of light and dark based on a fast response to light. As soon as the photon flux is sufficient to drive the photosynthetic machinery F. cylindrus is able to undergo primary production (PP); there is no need to expend additional resources retooling the cell’s molecular machinery.
Lipids are a key component for the survival of phytoplankton in the dark, but these compounds and their derivatives play important roles beyond energy storage (Collins et al., 2018). While triacylglycerols (TAGs) are primarily involved in energy storage, phospholipids, including phosphatidylcholine (PC), phosphatidylethanolamine (PE), and phosphatidylglycerol (PG), are key components of cell membranes. Free fatty acids (FFA) are rare in healthy cells, and, thus, are indicative of cell degradation. Oxidized FFA (i.e., oxylipins) can be deleterious to bacterial growth (Edwards et al., 2015). The glycolipids sulfoquinovosyldiacylglycerol (SQDG), digalactosyldiacylglycerol (DGDG), along with PG, are the primary structural lipids associated with the chloroplast.
The community lipidome can change on scales much shorter than seasonal. Recent work in the North Pacific subtropical gyre revealed a diel cycle in TAGs, with these compounds being synthesized during the day and catabolized at night (Becker et al., 2018). Given the complexity of light during the polar winter–spring seasonal transition, with day length and sea ice cover interacting in unpredictable ways, we sought to identify major contributors to the lipidome and patterns in lipid synthesis and catabolism through a coupled metatranscriptomic and lipidomic study. We made use of unusual sea ice conditions during the 2015 Austral spring to investigate the response of Antarctic phytoplankton to changing light conditions. Samples were collected from below sea ice, the marginal ice zone, and microcosms to identify different physiological responses to variable conditions associated with the winter–spring transition. Although metatranscriptomes are easily disaggregated into their component transcriptomes by mapping to references, it is much more difficult to assign lipids to specific phytoplankton (except for lipids that are uniquely produced by a given taxonomic group). To overcome this limitation we used principal components analysis (PCA) as a dimension reduction technique, correlating changes in lipid concentration to principal components describing up- or down-regulated genes for each reference phytoplankton transcriptome. This approach allowed us to identify key phytoplankton taxa responding to our experimental conditions, and different lipid utilization strategies employed by these phytoplankton during the Antarctic winter–spring seasonal transition.
Materials and Methods
Ethics Statement
Written informed consent was obtained from the individuals for the publication of any potentially identifiable images or data included in this article.
Experimental Design and Sampling
Persistent land-fast sea ice in Arthur Harbor allowed us to establish an ice station at 64.77253°S and 64.05411°W, on November 4, 2015 (Figure 1A). On November 10, 2015 we initiated a microcosm experiment to simulate the effects of ice removal and concomitant exposure to sunlight. Using a peristaltic pump and acid-washed tubing we filled 12 × 10 L acid-washed carboys with seawater from the ice station (Figure 1B). The carboys were transported to an outdoor recirculating incubator (Figure 1C) and shaded with screening to approximate light conditions at 10 m with no sea ice cover (approximately 30% irradiance as determined with a LI-COR Spear sensor for November 21, 2014 at Station B) (Supplementary Figure 1). As a control, three carboys were covered with additional layers of screening to maintain light levels below an estimated 1% irradiance, which was similar to under the sea ice. Three carboys each were sampled on November 11 (24 h; day 1), November 13 (72 h; day 3), and November 18 (192 h; day 8) (Figure 1E). On November 18 we also sampled the three dark controls.
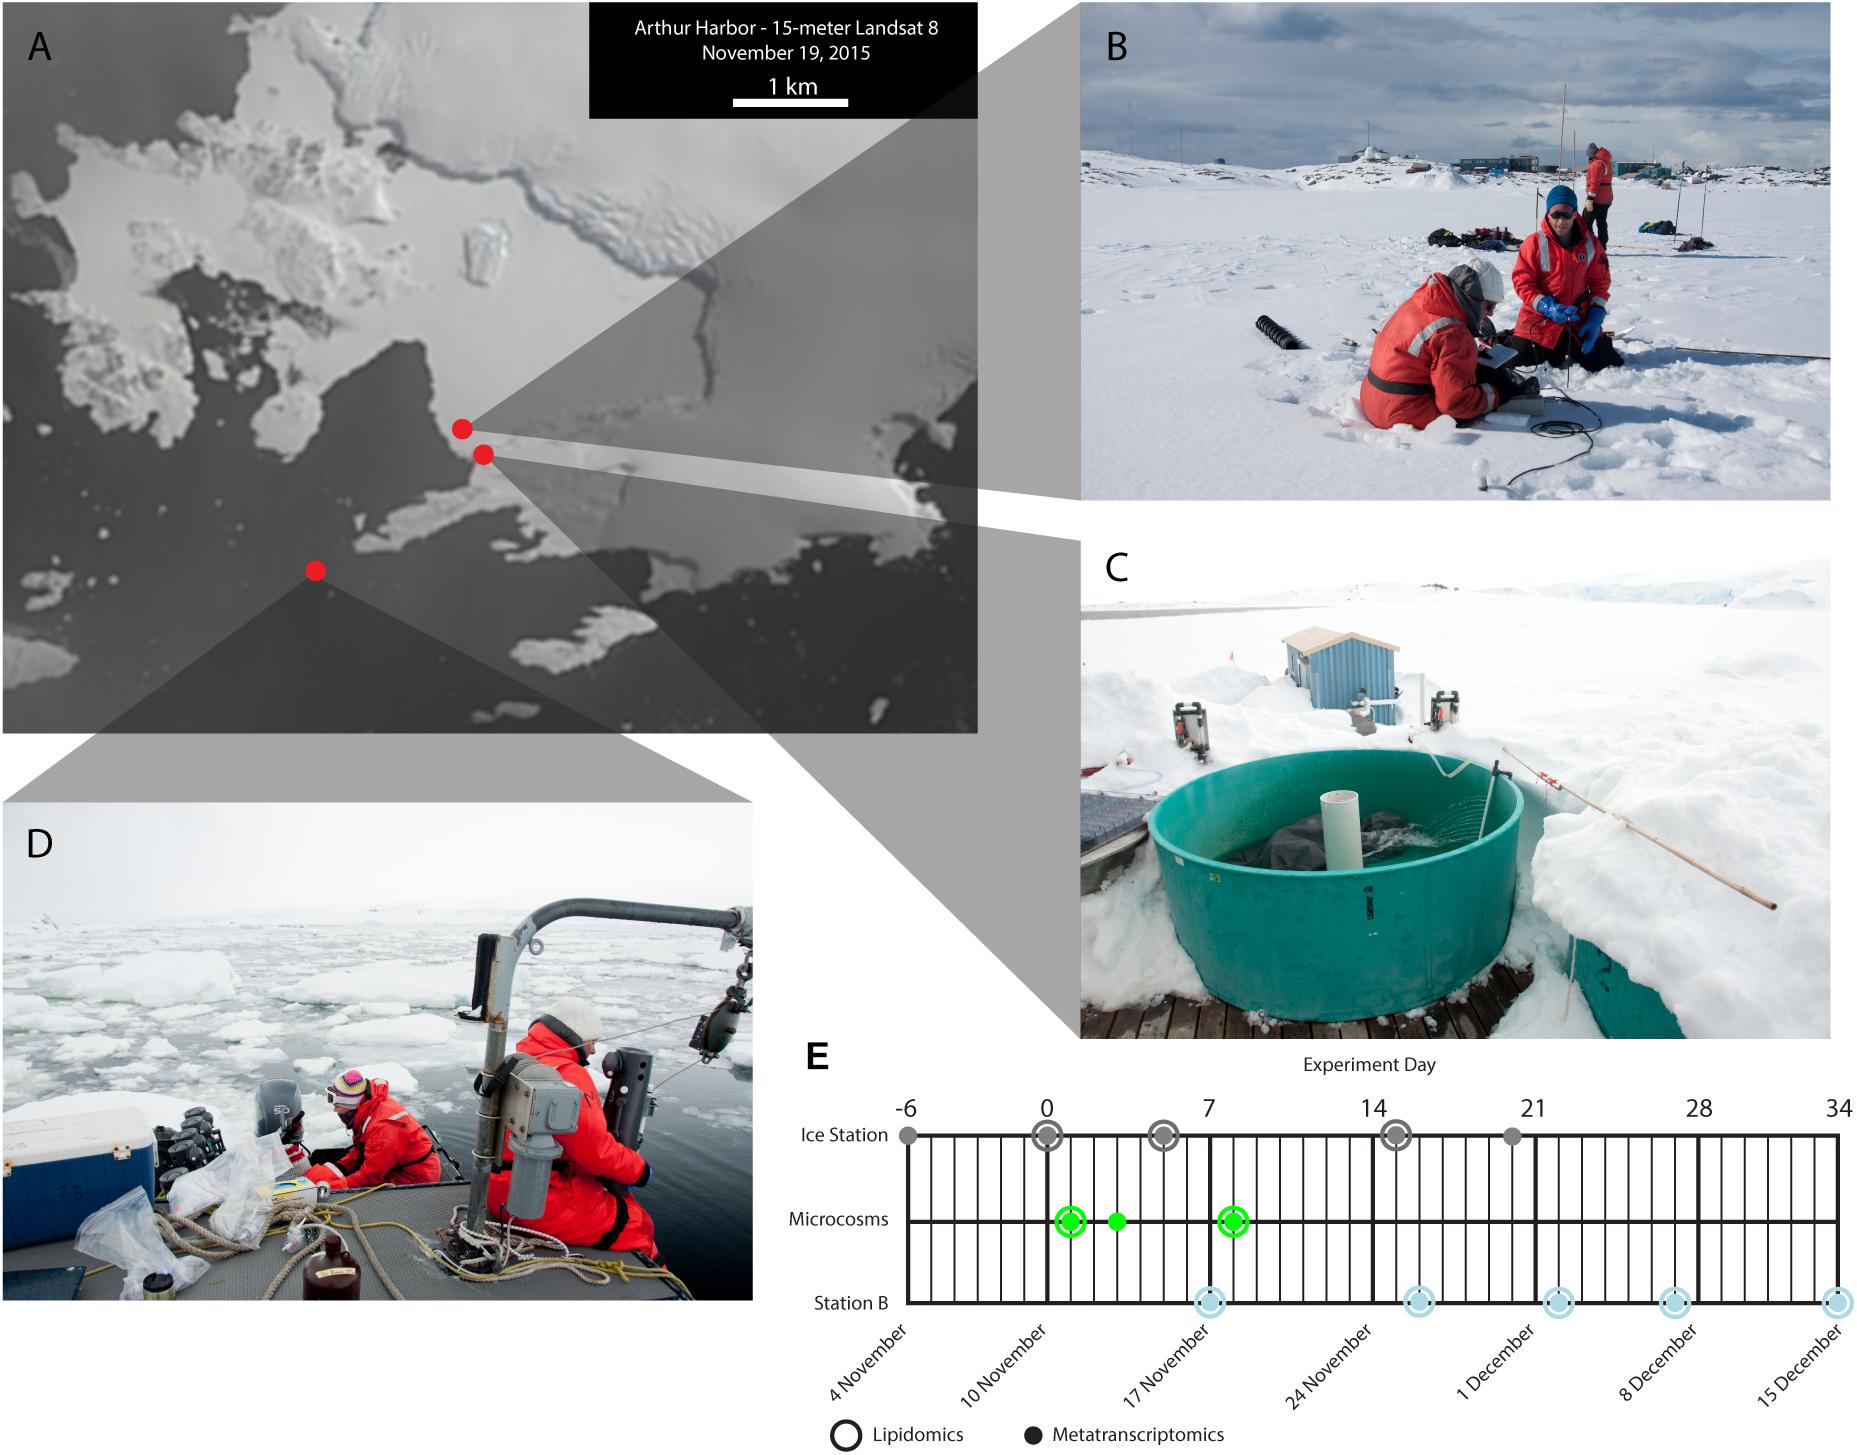
Figure 1. Site descriptions and experimental time-line. (A) Landsat imagery (15 m resolution) of southern Anvers Island on November 19, 2015. The landfast sea ice in Arthur Harbor is readily apparent. Red circles indicate the location of the Ice Station (B), Palmer Station and the outdoor incubators (C), and Palmer LTER Station B (D). (E) Experimental time-line showing when samples were collected for lipidomics and metatranscriptomics for each sampling location. Note that the Ice Station day 0 sample is also the day 0 sample for the microcosms.
PAR profiles were collected from the Ice Station on November 4 (6 days prior to T0) and November 15 (day 5), and from Station B on November 17 (day 7). Profiles were collected with a LI-COR 193 against a LI-COR 193 surface reference. Care was taken to position the casts on the unshadowed side of the Zodiac (for Station B) and ice sampling team (Ice Station).
Concurrent with the ice removal experiment, seawater samples were collected from the Ice Station on November 4, November 15, November 25, and November 30 (Figure 1E), at which time the ice was deemed too unstable for travel. At each sampling opportunity an ice core was removed with a Sipre-type corer. Acid-washed peristaltic pump tubing secured to a bamboo pole was inserted into the ice to a depth of 1 m below the ice surface. For the metatranscriptomes, a field-portable peristaltic pump was used to filter water onto sterile 47 mm 0.2 μm Durapore filters (PALL). Immediately after filtering, the filter was inserted into a bead-beating tube pre-loaded with RNeasy PowerWater kit (Qiagen) buffer #1 and 10 μL 2-betamercaptoethanol (Sigma). The tube was inverted to fully coat the filter surface, and the filters were placed on ice and protected from sunlight until extraction within 4 h of sampling.
For lipidomics, the peristaltic pump was used to fill acid-washed polycarbonate bottles. Care was taken to shade the bottles during collection and transport. Within 4 h the samples were filtered on 47 mm diameter, 0.2 μm pore size, hydrophilic PVDF membranes (Millipore) under gentle vacuum. The membranes were flash frozen in liquid nitrogen and stored in a −80°C freezer.
Samples were collected from the Palmer Long Term Ecological Research project (PAL-LTER) Station B, located at approximately 64.78205°S and 64.07934°W, on November 22, November 26, December 2, December 7, and December 15 (Figures 1A,D). Samples were collected by peristaltic pump from a Zodiac, at 5 m depth, following the same methods employed for sampling at the ice station.
RNA extraction followed the manufacturers recommended protocol, including DNase treatment. RNA was quantified using the Qubit HS RNA kit (Invitrogen). Parallel samples were collected for DNA and extracted using the DNeasy PowerWater kit (Qiagen), quantification was carried out using the Qubit HS DNA kit (Invitrogen). Measurements for chlorophyll a, bacterial production (BP), PP, and fluorescence induction and relaxation (FIRe) were carried out by the Palmer Long Term Ecological Research Program using the standard methods available on the Palmer LTER DataZoo (Palmer LTER Science Team, 2021).
Sequencing and Sequence Processing
Sequencing was carried out via PE sequencing on the Illumina HiSeq platform at either the Joint Genome Institute (12 samples) or the UC San Diego IMG Genomics core facility (64 samples). Demultiplexed reads were merged and quality controlled with the Paired-End reAd mergeR (PEAR) (Stamatakis et al., 2014), using a p-value of 0.01, minimum PHRED score of 33, and eliminating merged reads <100 bp in length.
Merged, quality controlled reads were mapped to reference transcriptomes of the Marine Microbial Eukaryotic Transcriptome Sequencing Project (MMETSP) (Keeling et al., 2014) and reference genomes from GenBank with an extension of the paprica bioinformatics pipeline (i.e., paprica-mt) (Bowman and Ducklow, 2015a, b). In brief, reference bacterial, archaeal, and viral genomes were downloaded from GenBank, and reference eukaryotic transcriptomes were downloaded from MMETSP, on February 1, 2017. All unique genes coding for a product with an Enzyme Commission (EC) number were identified and concatenated in a database, along with the taxonomic information of the originating genome or transcriptome, and the name of the gene product. BWA (Langmead et al., 2009) was used to search all query reads against this database. The BWA output in SAM format was parsed to create a tab-delimited file of query reads, best mapped reference sequence, and taxonomy and gene product of the reference sequence.
Lipid Extraction and Quantification
Biomass captured on the PVDF filters was extracted using a modification of the Bligh and Dyer (1959) method as described in Popendorf et al. (2013). Total lipid extracts were stored under argon at −80°C prior to analysis. We analyzed the lipids using high performance liquid chromatography and high-resolution accurate-mass mass spectrometry (HPLC/HRAM-MS). The HPLC/HRAM-MS method was based on Hummel et al. (2011) with minor modifications, including electrospray source conditions, as described by Collins et al. (2016). We processed the data with R-based CAMERA (Kuhl et al., 2012), LOBSTAHS (Collins et al., 2016), and xcms (Smith et al., 2006; Tautenhahn et al., 2008; Benton et al., 2010) packages as described by Collins et al. (2016, 2018) and Becker et al. (2018). Downstream analysis focused on the following lipid classes: monogalactosyldiacylglycerol (MGDG; a chloroplast lipid), sulfoquinovosyldiacylglycerol (SQDG; a chloroplast lipid), digalactosyldiacylglycerol (DGDG; a chloroplast lipid), PE (a phospholipid), PG (a phospholipid), PC (a phospholipid), Diacylglyceryl hydroxymethyl-trimethylalanine (DGTA; a betaine lipid), Diacylglyceryl carboxyhydroxy-methylcholine (DGCC; a betaine lipid), TAG, and FFA.
Data Analysis
For each sample and reference transcriptome/genome, the unique EC numbers were tallied to produce tables of transcript abundance. This approach allowed an independent comparison of each reference transcriptome/genome between replicate libraries for select samples. To make this comparison we employed DESeq2 (Love et al., 2014); differentially expressed transcripts are described as those with a p-value < 0.05 in a Wald test. p-Values reflect Holm–Bonferroni correction for multiple-comparisons as is the default in DESeq2. This experiment was designed such that ice station samples were the initial condition, followed by samples from Station B, then the microcosm incubations. Where comparisons were made within each of these groups, the initial condition was that which occurred first in the time series.
To identify which reference transcriptomes responded similarly to changing environmental conditions we applied PCA to the differential expression data for all points of comparison. PCA was applied to each reference independently. The step was important for dimension reduction; the PCA effectively collapsed one dimension of the data allowing us to compare all reference transcriptomes for all points of comparison in only two dimensions. Transcriptomes with similar magnitudes in the first principal component (PC1) according to a simprof analysis based on Euclidean distance (in deference to positive and negative values) and hierarchical clustering were considered to have a similar response to changing environmental conditions. To explore specific gene expression patterns within each group we then considered the contribution of each enzyme (cos2) to PC1.
To relate the lipidomes to the transcriptomes we constructed a correlation matrix based on Pearson’s correlation coefficient (r). For each transcriptome, PC1 was correlated with the change in lipid concentration between each sample. The resulting matrix was organized according to hierarchical clustering based on Euclidean distances (in deference to the positive and negative values).
All statistical analyses were carried out in R v3.6 (R Core Team, 2014) using R Studio and R Studio Server. The simprof analysis was carried out using the “simprof” function in package clustsig (Whitaker and Christman, 2014). For the PCA analysis, the cos2 values were extracted using the “get_pca_var” function from the factoextra package (Kassambara and Mundt, 2017).
Results
Ecophysiology
Chlorophyll a values responded quickly to the microcosm treatment (Figure 2A). Initial (T0) samples for the microcosms and ice station samples were 0.23 mg m–3 on November 10, 2015. At the time of the final sampling on November 25, 2015 (day 15), the ice station had risen to 0.63 mg m–3. By contrast, after only 7 days the microcosms had increased to 1.20 mg m–3 (mean of three replicates, SD = 0.50 mg m–3). At Station B the values increased from 0.52 mg m–3 on day 17 to 2.08 mg m–3 on day 34. The PP values largely followed the pattern set by chlorophyll a, increasing from initial values of 1.71 mg C m–3 d–1 at the ice station and mesocosm T0 samples to 41.75 mg C m–3 d–1 in the microcosms on day 8 (mean of three replicates, SD = 26.93 mg C m–3 d–1) (Figure 2B). One exception was the Ice Station day 20 value, which jumped to 24.05 mg C m–3 from 6.03 mg C m–3 d–1 on day 15. Bacterial production values followed PP values with no indication of a lag (Figure 2C). These values ranged from 3.34 pmol leucine l–1 h–1 on day 6 at Station B to 19.95 pmol leucine l–1 h–1 on day 20 at the Ice Station. For all ecophysiology parameters, only single values are available for most time-points from the Ice Station and all time-points from Station B.
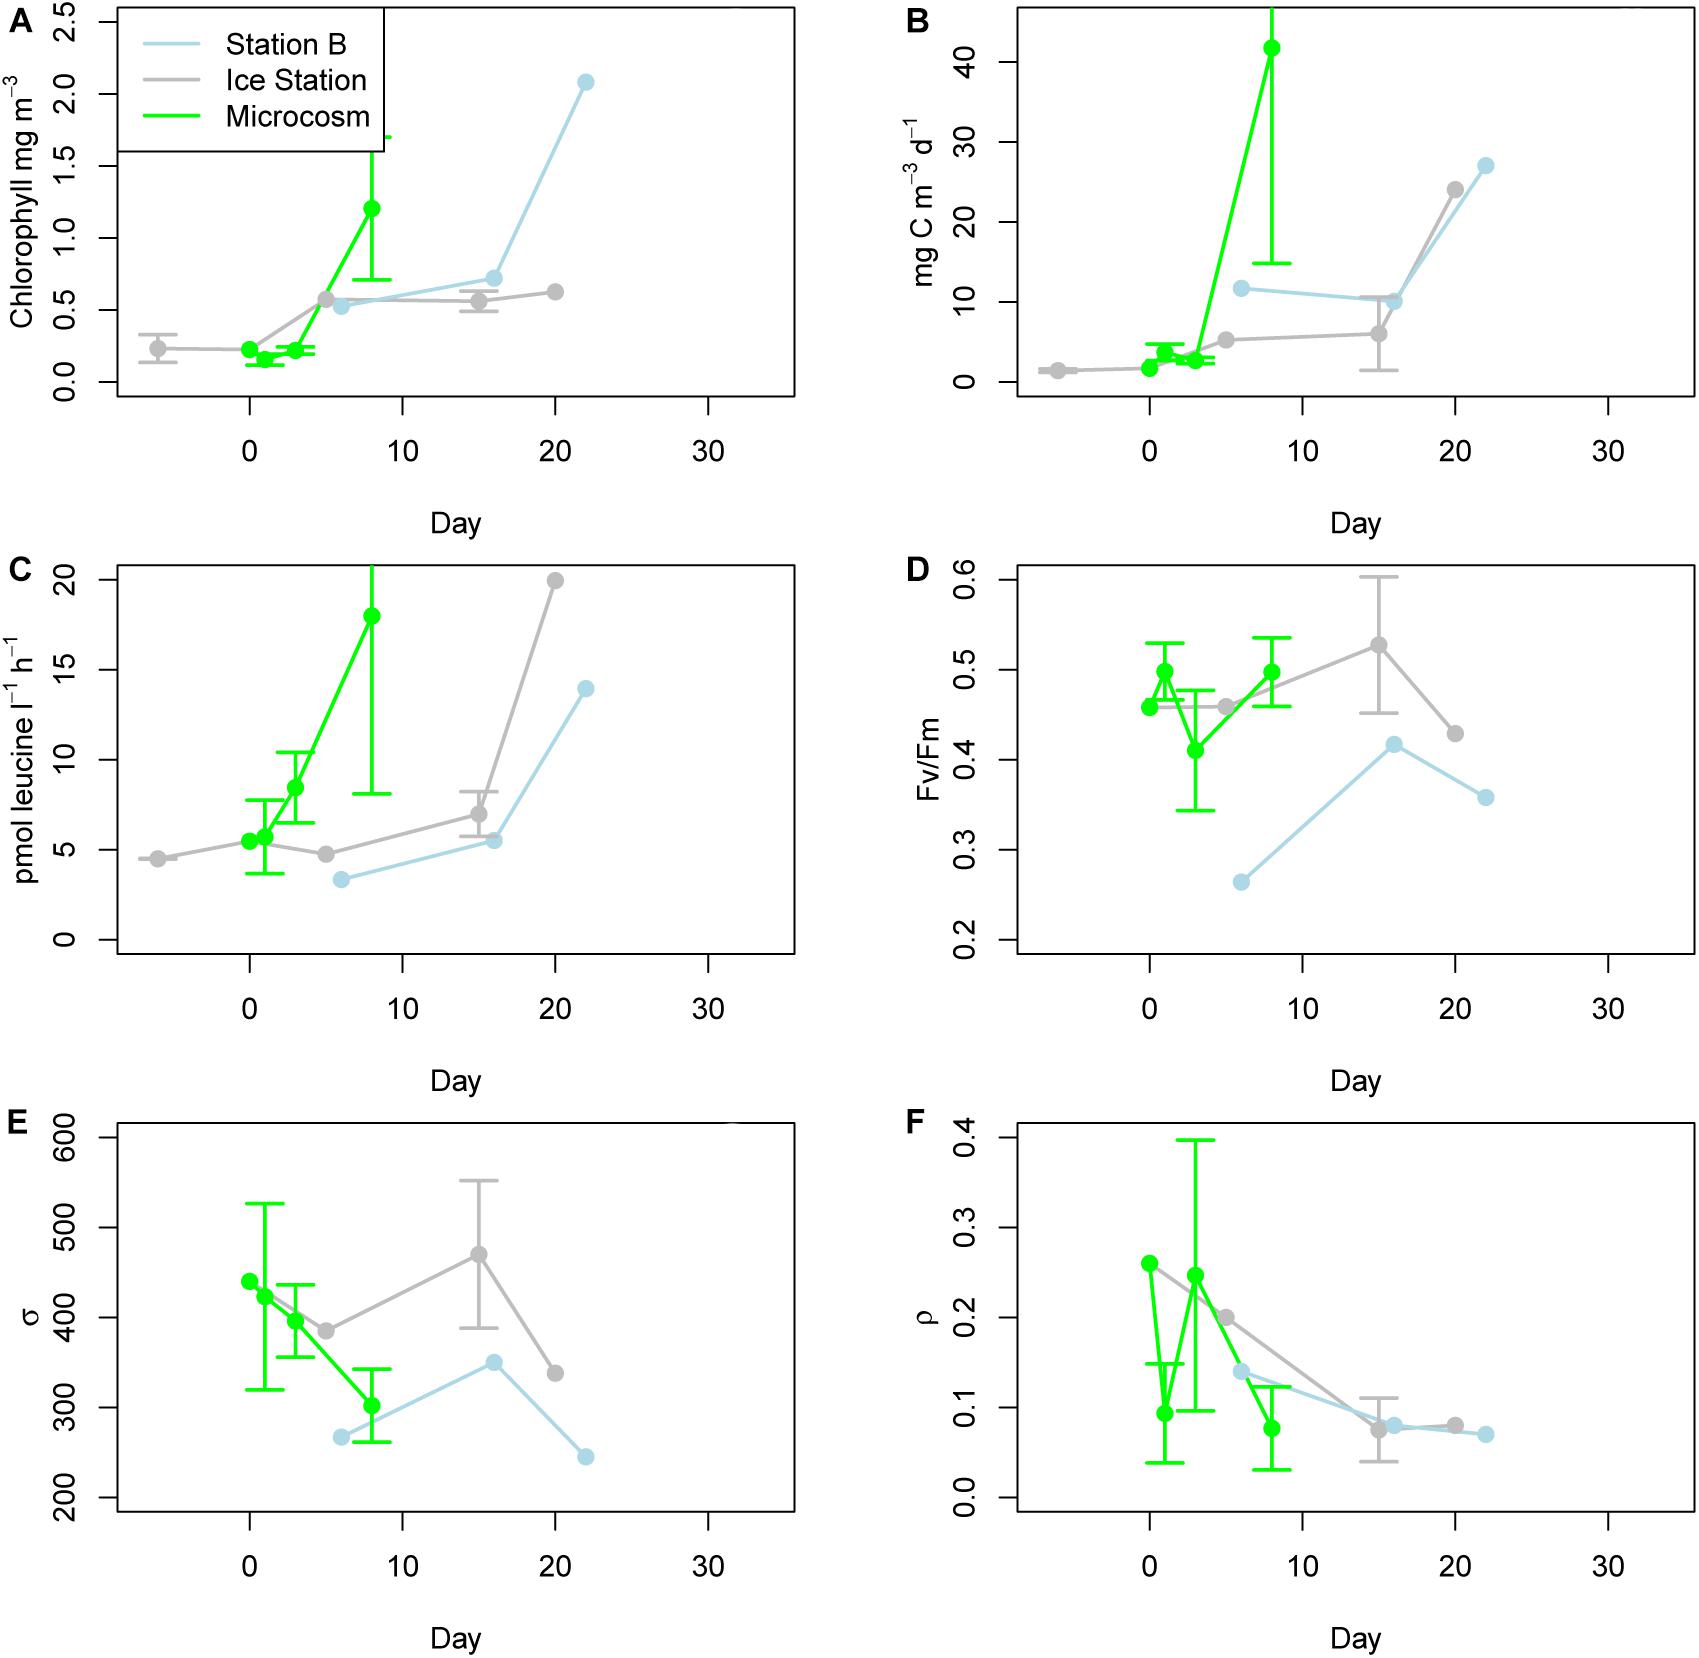
Figure 2. Ecophysiology. (A) Chlorophyll a concentrations for Station B (located in the marginal ice zone), the Ice Station, and microcosms. (B) Primary production according to H-14CO3 uptake. (C) Bacterial production as determined from the uptake of 3H-leucine. (D) Fv/Fm as determined by fluorescence induction and relaxation (FIRe). (E) σPSII, a measure of the absorption cross-sectional area for photosystem II as determined by FIRe. (F) ρ, a measure of reaction center connectivity as determined by FIRe. Ecophysiology parameters for Station B and the Ice Station represent a single measurement, as provided by the Palmer LTER project. Values for the microcosms on days 1, 3, and 8 represent the means of triplicates.
Fluorescence induction and relaxation parameters measured included Fv/Fm (a key indicator of photosynthetic efficiency), ρPSII (the cross-sectional absorption area of photosystem II), and ρ (the reaction center connectivity). Fv/Fm remained relatively stable at the Ice Station over the course of the experiment (Figure 2D). The high light associated with the microcosms induced rapid perturbations in this parameter, with Fv/Fm falling from 0.46 on day 0 to 0.41 on day 3, before recovering to 0.50 on day 8. Overall the Station B samples were lower than either the Ice Station or microcosm values, and increased over the course of the experiment from 0.26 on day 6 to 0.41 on day 16. ρPSII declined over the course of the microcosms, from 440 to 302 (Figure 2E). ρPSII was consistently higher at the Ice Station than at Station B. For the microcosms, ρ followed an inverse relationship to Fv/Fm, falling from a day 0 value of 0.26 to 0.09 on day 1, before recovering to 0.25 on day 3 (Figure 2F). At the start of the experiment ρ was higher at the Ice Station than at Station B, these values converged near 0.08 by day 16.
On November 4 (6 days prior to T0) the 1% irradiance depth at the Ice Station was estimated to be 1.25 m (Supplementary Figure 1). On day 5 it was not possible to get a clean value for the uppermost portion of the water column and we could not estimate the depth of the 1% light level. The shape of the profile, however, suggests a similar value to that estimated for November 4. The lowest irradiance values observed for Station B on day 7 was 17.0%. The irradiance at 5 m depth (the sampling depth for our Station B metatranscriptomes) was 51.7%.
Metatranscriptome Results
We produced 76 merged sequence libraries with a minimum quality score of 33, ranging in size from 3,492,999 to 104,508,538 (mean = 4.94 × 10⁷, SD = 2.49 × 10⁷). The fraction of reads mapped to a reference transcriptome/genome for each sample ranged from 13.06 to 81.87% (mean = 48.48%, SD = 13.48%). All sequence data is available from the NCBI SRA at BioProject PRJNA494856, and a flat file of differentially expressed genes is provided as Supplementary Table 1. Heatmaps for each enzyme in the paprica-mt database that had significant log2 fold-change differences for one or more reference transcriptomes are provided as a Supplementary Material.
We identified 93 reference genomes/transcriptomes with significantly differentially expressed genes. Of these, 37 had differentially expressed genes for all points of comparison. These were primarily eukaryotic reference transcriptomes from the MMETSP, but included one prokaryotic reference genome; GCF_000012305.1 (Psychrobacter arcticus 273-4). The prokaryotic genome was not considered further in our analysis. The remaining reference transcriptomes included 23 members of Bacillariophyta (diatoms), 10 Dinophyta (dinoflagellates), 1 Ascomycota (fungi), 1 Ochrophyta (a chrysophyte or golden algae), and 1 Sarcomastigophora (Table 1). Each reference transcriptome could represent a range of more or less closely related phytoplankton present in the system. Here, when we refer to a reference transcriptome by name we are referring to the collection of phytoplankton with gene transcripts that mapped to that reference transcriptome. This approach does not imply a close evolutionary relationship between the reference and environmental phytoplankton. For brevity the strain name of each reference transcriptome is included only at first use.
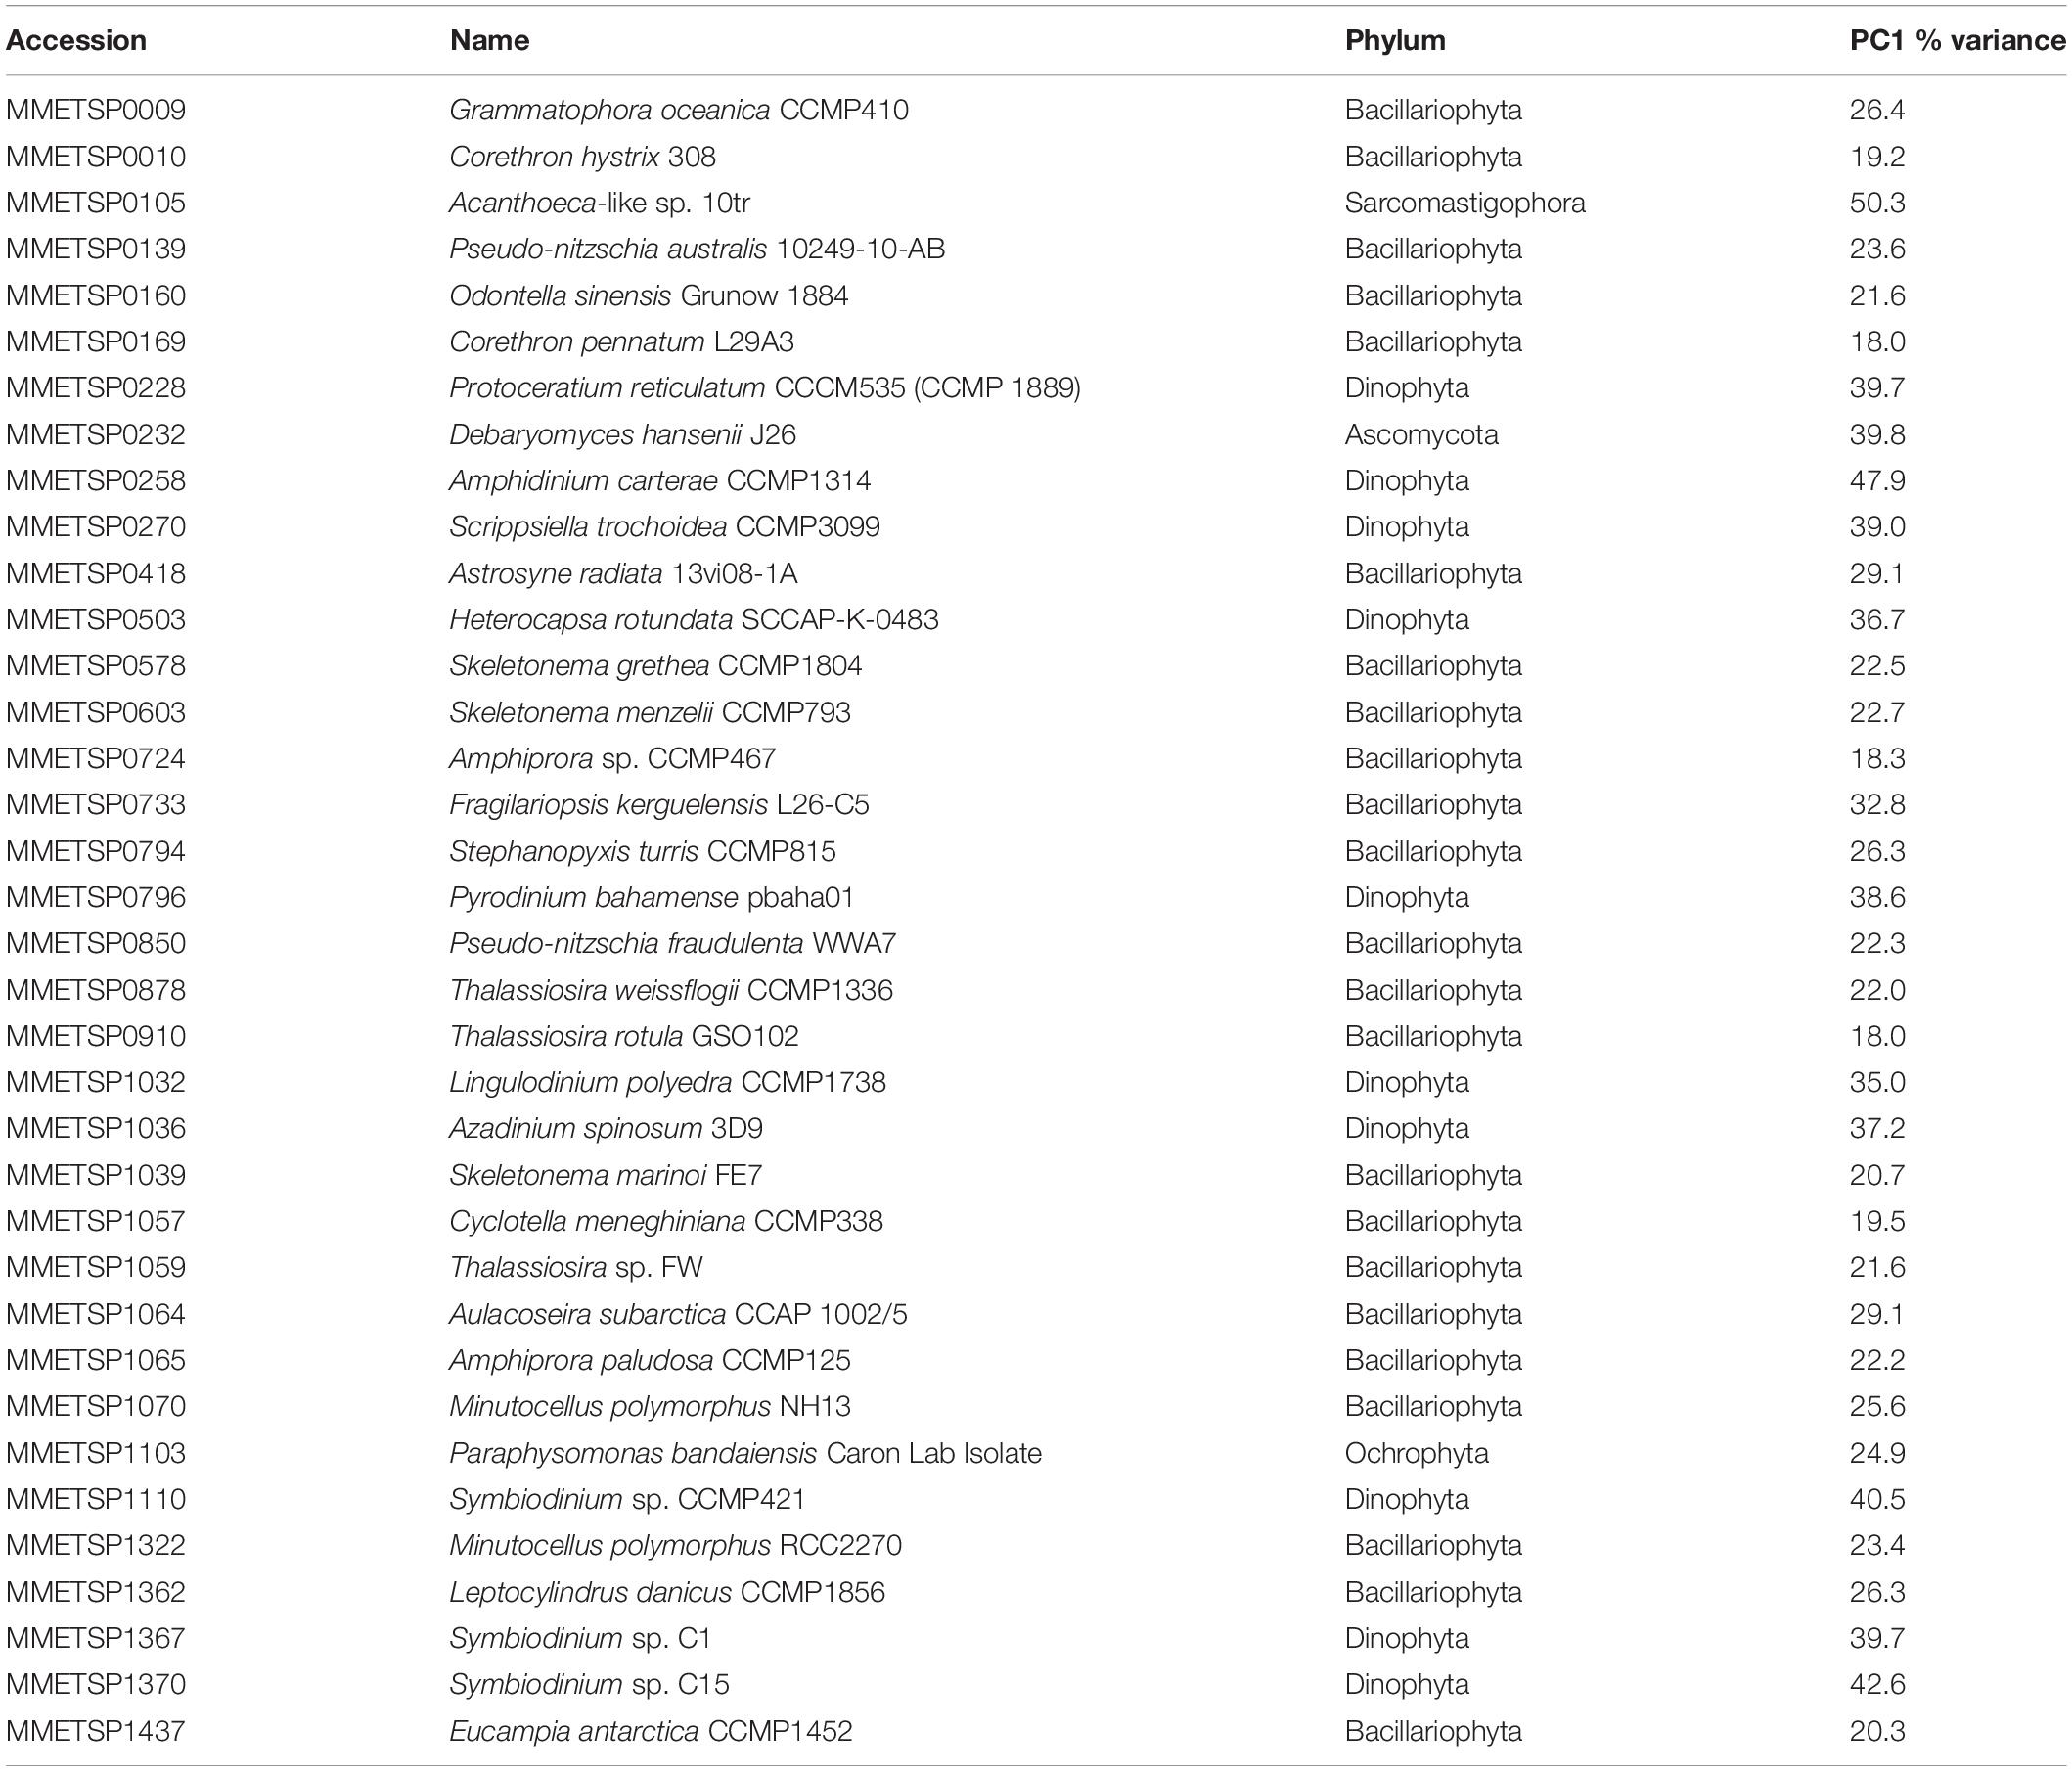
Table 1. Reference transcriptomes with reads mapped for all points of comparison.
To assess general growth and the photosynthetic response to changing conditions we considered the expression patterns of genes coding for DNA polymerase (EC 2.7.7.7), Photosystem I enzymes (EC 1.97.1.12), Photosystem II enzymes (EC 1.10.3.9), and ribulose bisphosphate carboxylase/oxygenase (RUBISCO, EC 4.1.1.39). The regulation of genes coding for DNA polymerase was highly variable (Supplementary Figure 2), however, diatoms associated with three reference transcriptomes had the strongest response to the microcosm experiments: MMETSP0169 (Corethron pennatum L29A3), MMETSP0910 (Thalassiosira rotula GSO102), and MMETSP0733 (Fragilariopsis kerguelensis L26-C5). F. kerguelensis initially up-regulated genes coding for DNA polymerase between microcosm day 0 and day 1, then down-regulated these genes after day 1. By contrast C. pennatum generally up-regulated these genes throughout the microcosm experiment, and in comparisons between earlier and later experimental time-points.
Photosystem I (Supplementary Figure 3) and II (Supplementary Figure 4) expression patterns were dominated by dinoflagellates. While most phytoplankton associated with the reference transcriptomes up-regulated Photosystem I over the course of the microcosm experiment, and in comparisons between earlier and later experimental time-points, MMETSP1367 (Symbiodinium sp. C1) and MMETSP0503 (Heterocapsa rotundata SCCAP-K-0483) strongly down-regulated the genes coding for Photosystem I at the start of the microcosms. A similar pattern was observed for Photosystem II, though MMETSP0796 (Pyrodinium bahamense RCC2770) and MMETSP0228 (Protoceratium reticulatum CCCM535 = CCMP1889) had a strong transcriptional response, and generally up-regulated Photosystem II in response to conditions associated with higher light levels. It should be noted that here we have retained the MMETSP nomenclature for the Symbiodinium reference transcriptomes, however, Symbiodinium C1 is now a member of the genus Cladocopium (LaJeunesse et al., 2018).
Dinoflagellates also dominated the expression pattern of genes coding for RUBISCO (Supplementary Figure 5). MMETSP1036 (Azadinium spinosum 3D9), MMETSP0258 (Amphidinium carterae CCMP1314), and Symbiodinium sp. C1 strongly up-regulated these genes in response to conditions of higher light. A large number of diatoms also significantly up- or down-regulated the genes coding for RUBISCO over the course of the experiment, albeit at lower levels than the dinoflagellates.
The total number of differentially expressed genes for a given reference and comparison ranged between 1 and 328 (Figure 3). We consider this value as the response complexity of the reference genome/transcriptome for the point of comparison. Hierarchical clustering of response complexity for the eukaryotic reference transcriptomes identified 19 significant clusters according to a simprof analysis. Three reference transcriptomes stood out as having high response complexity; F. kerguelensis, C. pennatum, and T. rotula, with the latter two forming a statistically significant cluster. These reference transcriptomes also had the strongest DNA polymerase signal across the microcosm portion of the experiment. The greatest response complexity was observed for F. kerguelensis between Ice Station day 5 (November 15) and Station B day 7 (November 17), and between Ice Station day 5 and Station B day 27 (December 7).
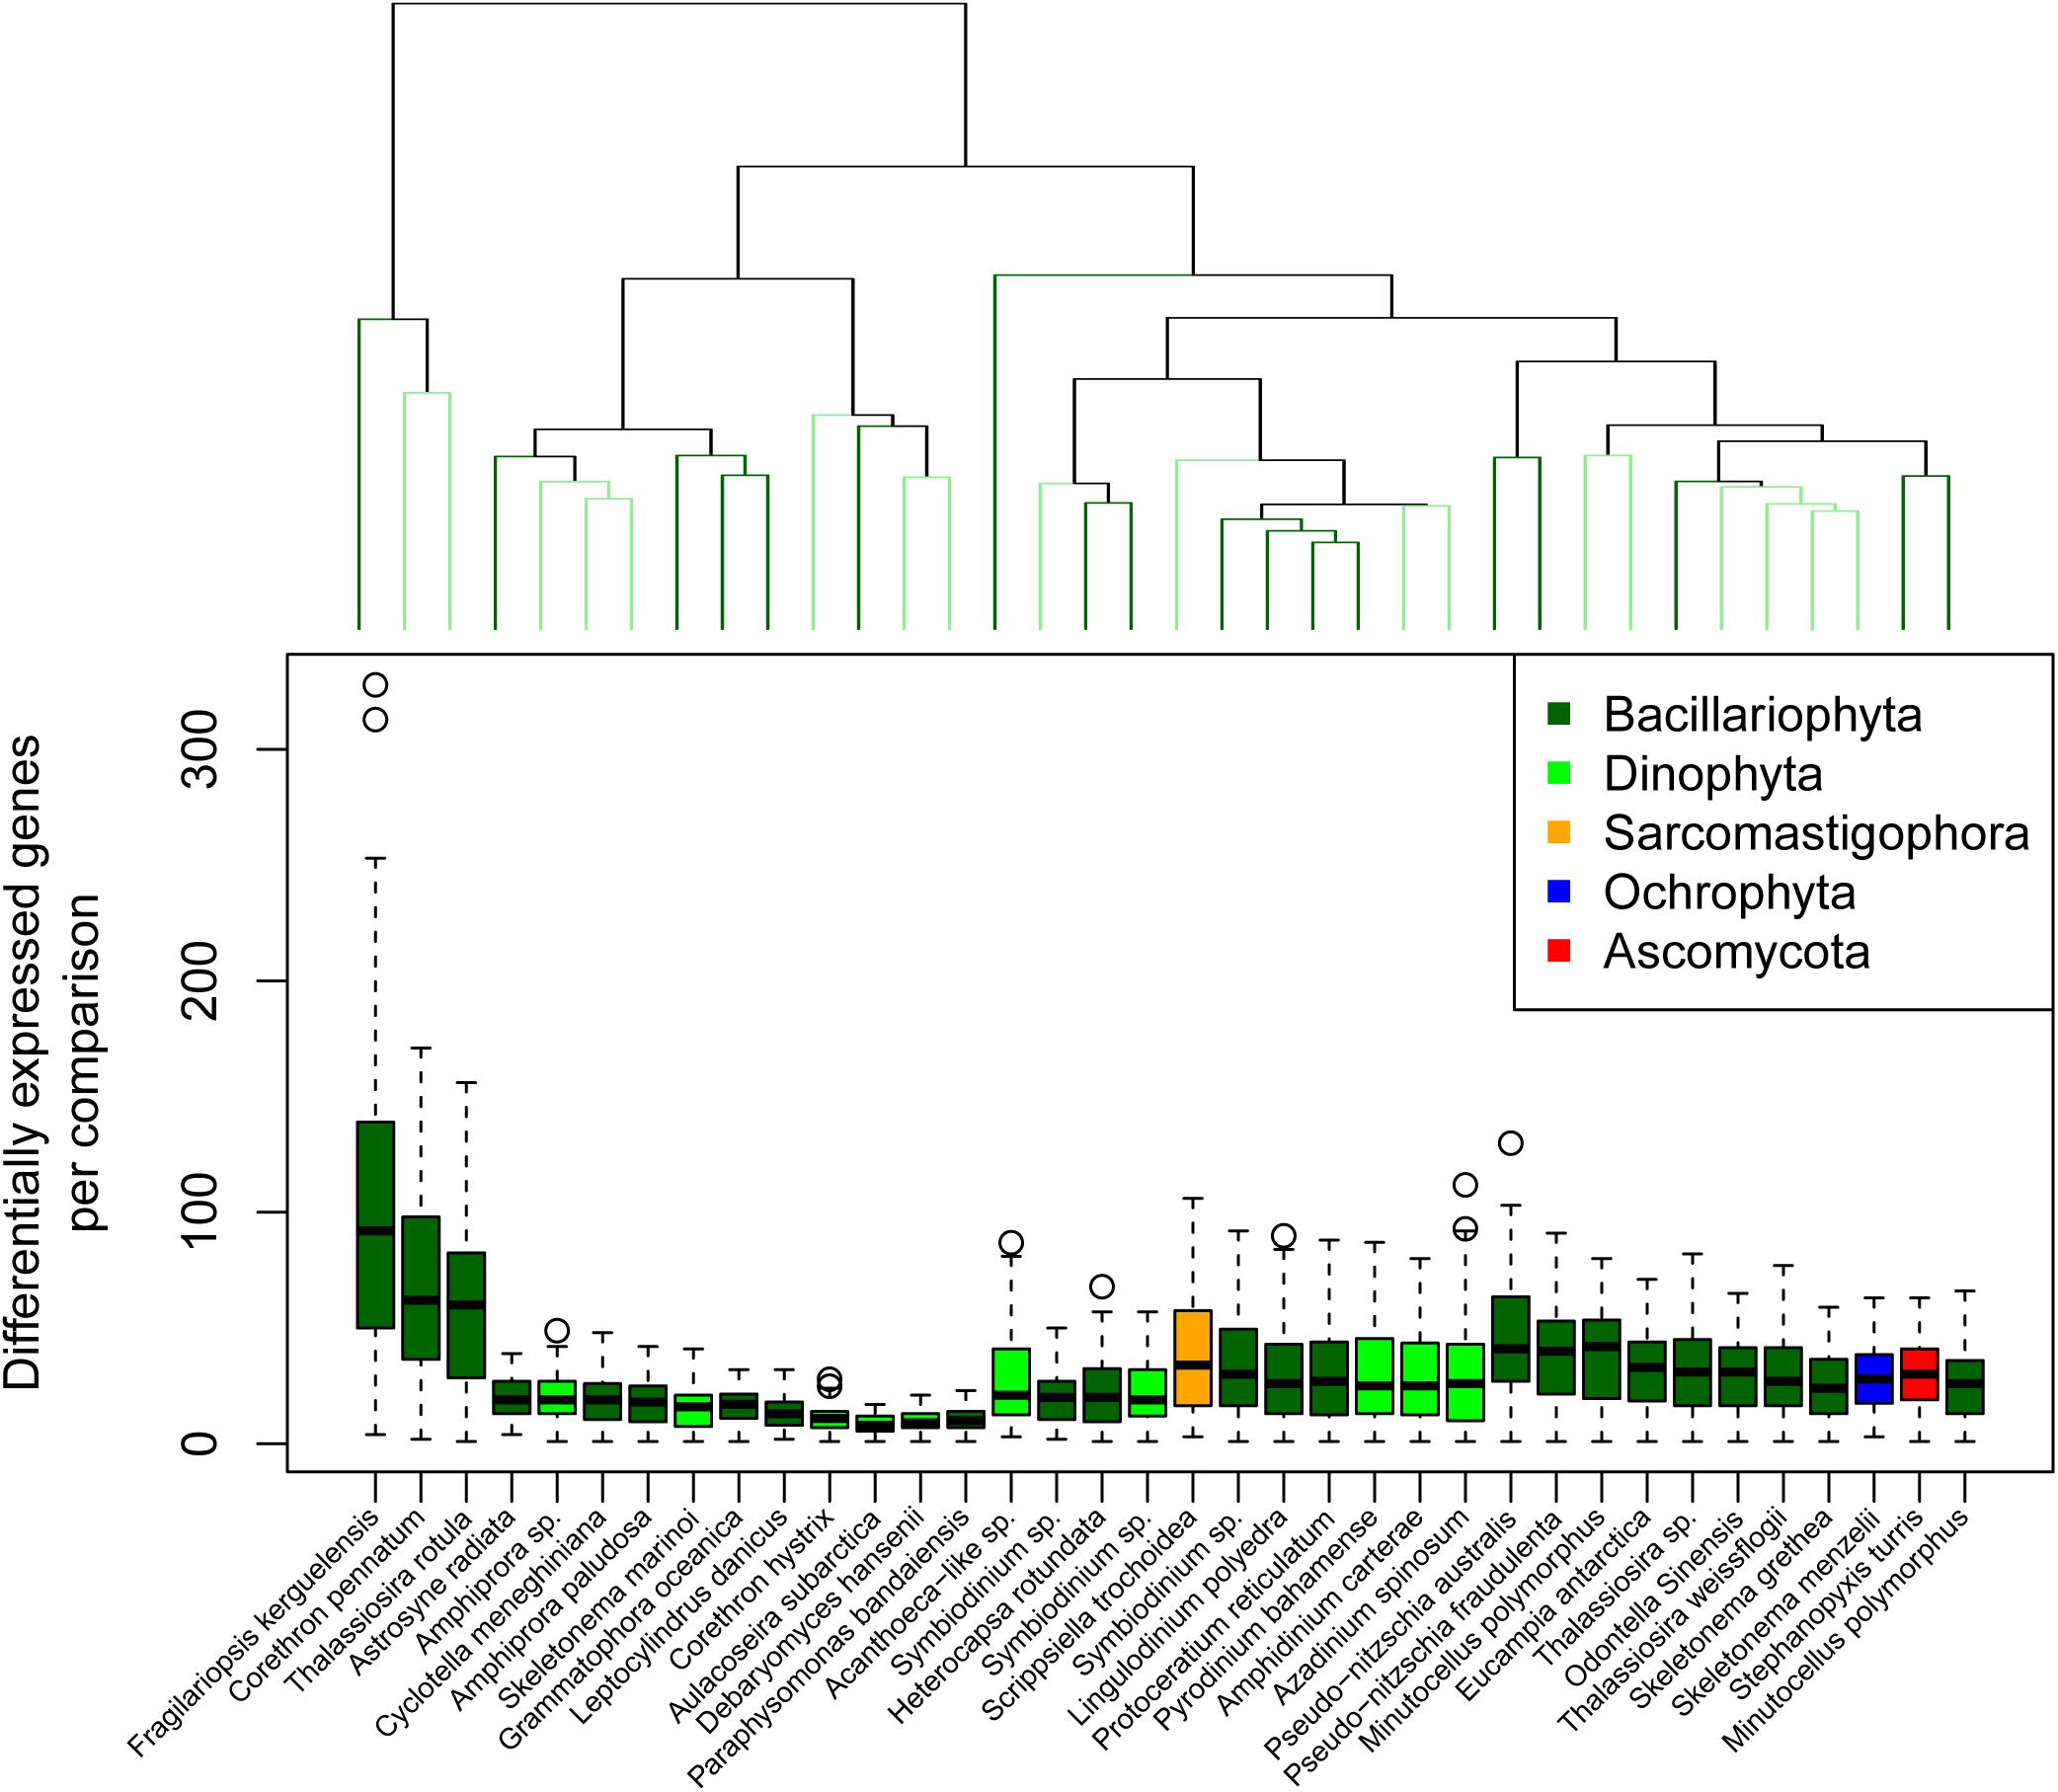
Figure 3. Transcriptional response complexity. Transcriptional response complexity was determined as the number of genes in each reference transcriptomes determined to be differentially expressed between two points of comparison. The dendrogram at the top of the plot indicates similarity according to the number of unique genes differentially expressed between points of comparison but does not consider the identify of those genes. Significant clusters are indicated by alternating light and dark green color.
For Ice Station day 5 to Station B day 7, the comparison of greatest response complexity for F. kerguelensis, several genes relevant to lipid metabolism were significantly down-regulated (Supplementary Table 1). These included long-chain-3-hydroxyacyl-CoA dehydrogenase (EC 1.1.1.211; normalized log2 fold-change −7.41), 2,4-dienoyl-CoA reductase (EC 1.3.1.34; normalized log2 fold-change −6.26), triacylglycerol lipase (3.1.1.3; normalized log2 fold-change −5.31), and 3-oxoacyl-(acyl-carrier-protein) reductase (EC 1.1.1.100; normalized log2 fold-change −5.11). A gene coding for sphingolipid 4-desaturase (EC 1.14.19.17; normalized log2 fold-change 4.00) was significantly up-regulated. Of these, only 2,4-dienoyl-CoA reductase was similarly down-regulated by T. rotula, and none were significantly up- or down-regulated by C. pennatum.
In contrast to response complexity we defined response strength as the summed fold-change for all differentially expressed genes for a given reference and comparison (Figure 4). Hierarchical clustering of response strength identified 23 significant clusters according to a simprof analysis, with F. kerguelensis and C. pennatum responding most strongly to changing conditions. To identify which references responded similarly to changing conditions we considered the magnitude of each sample comparison in PC1.
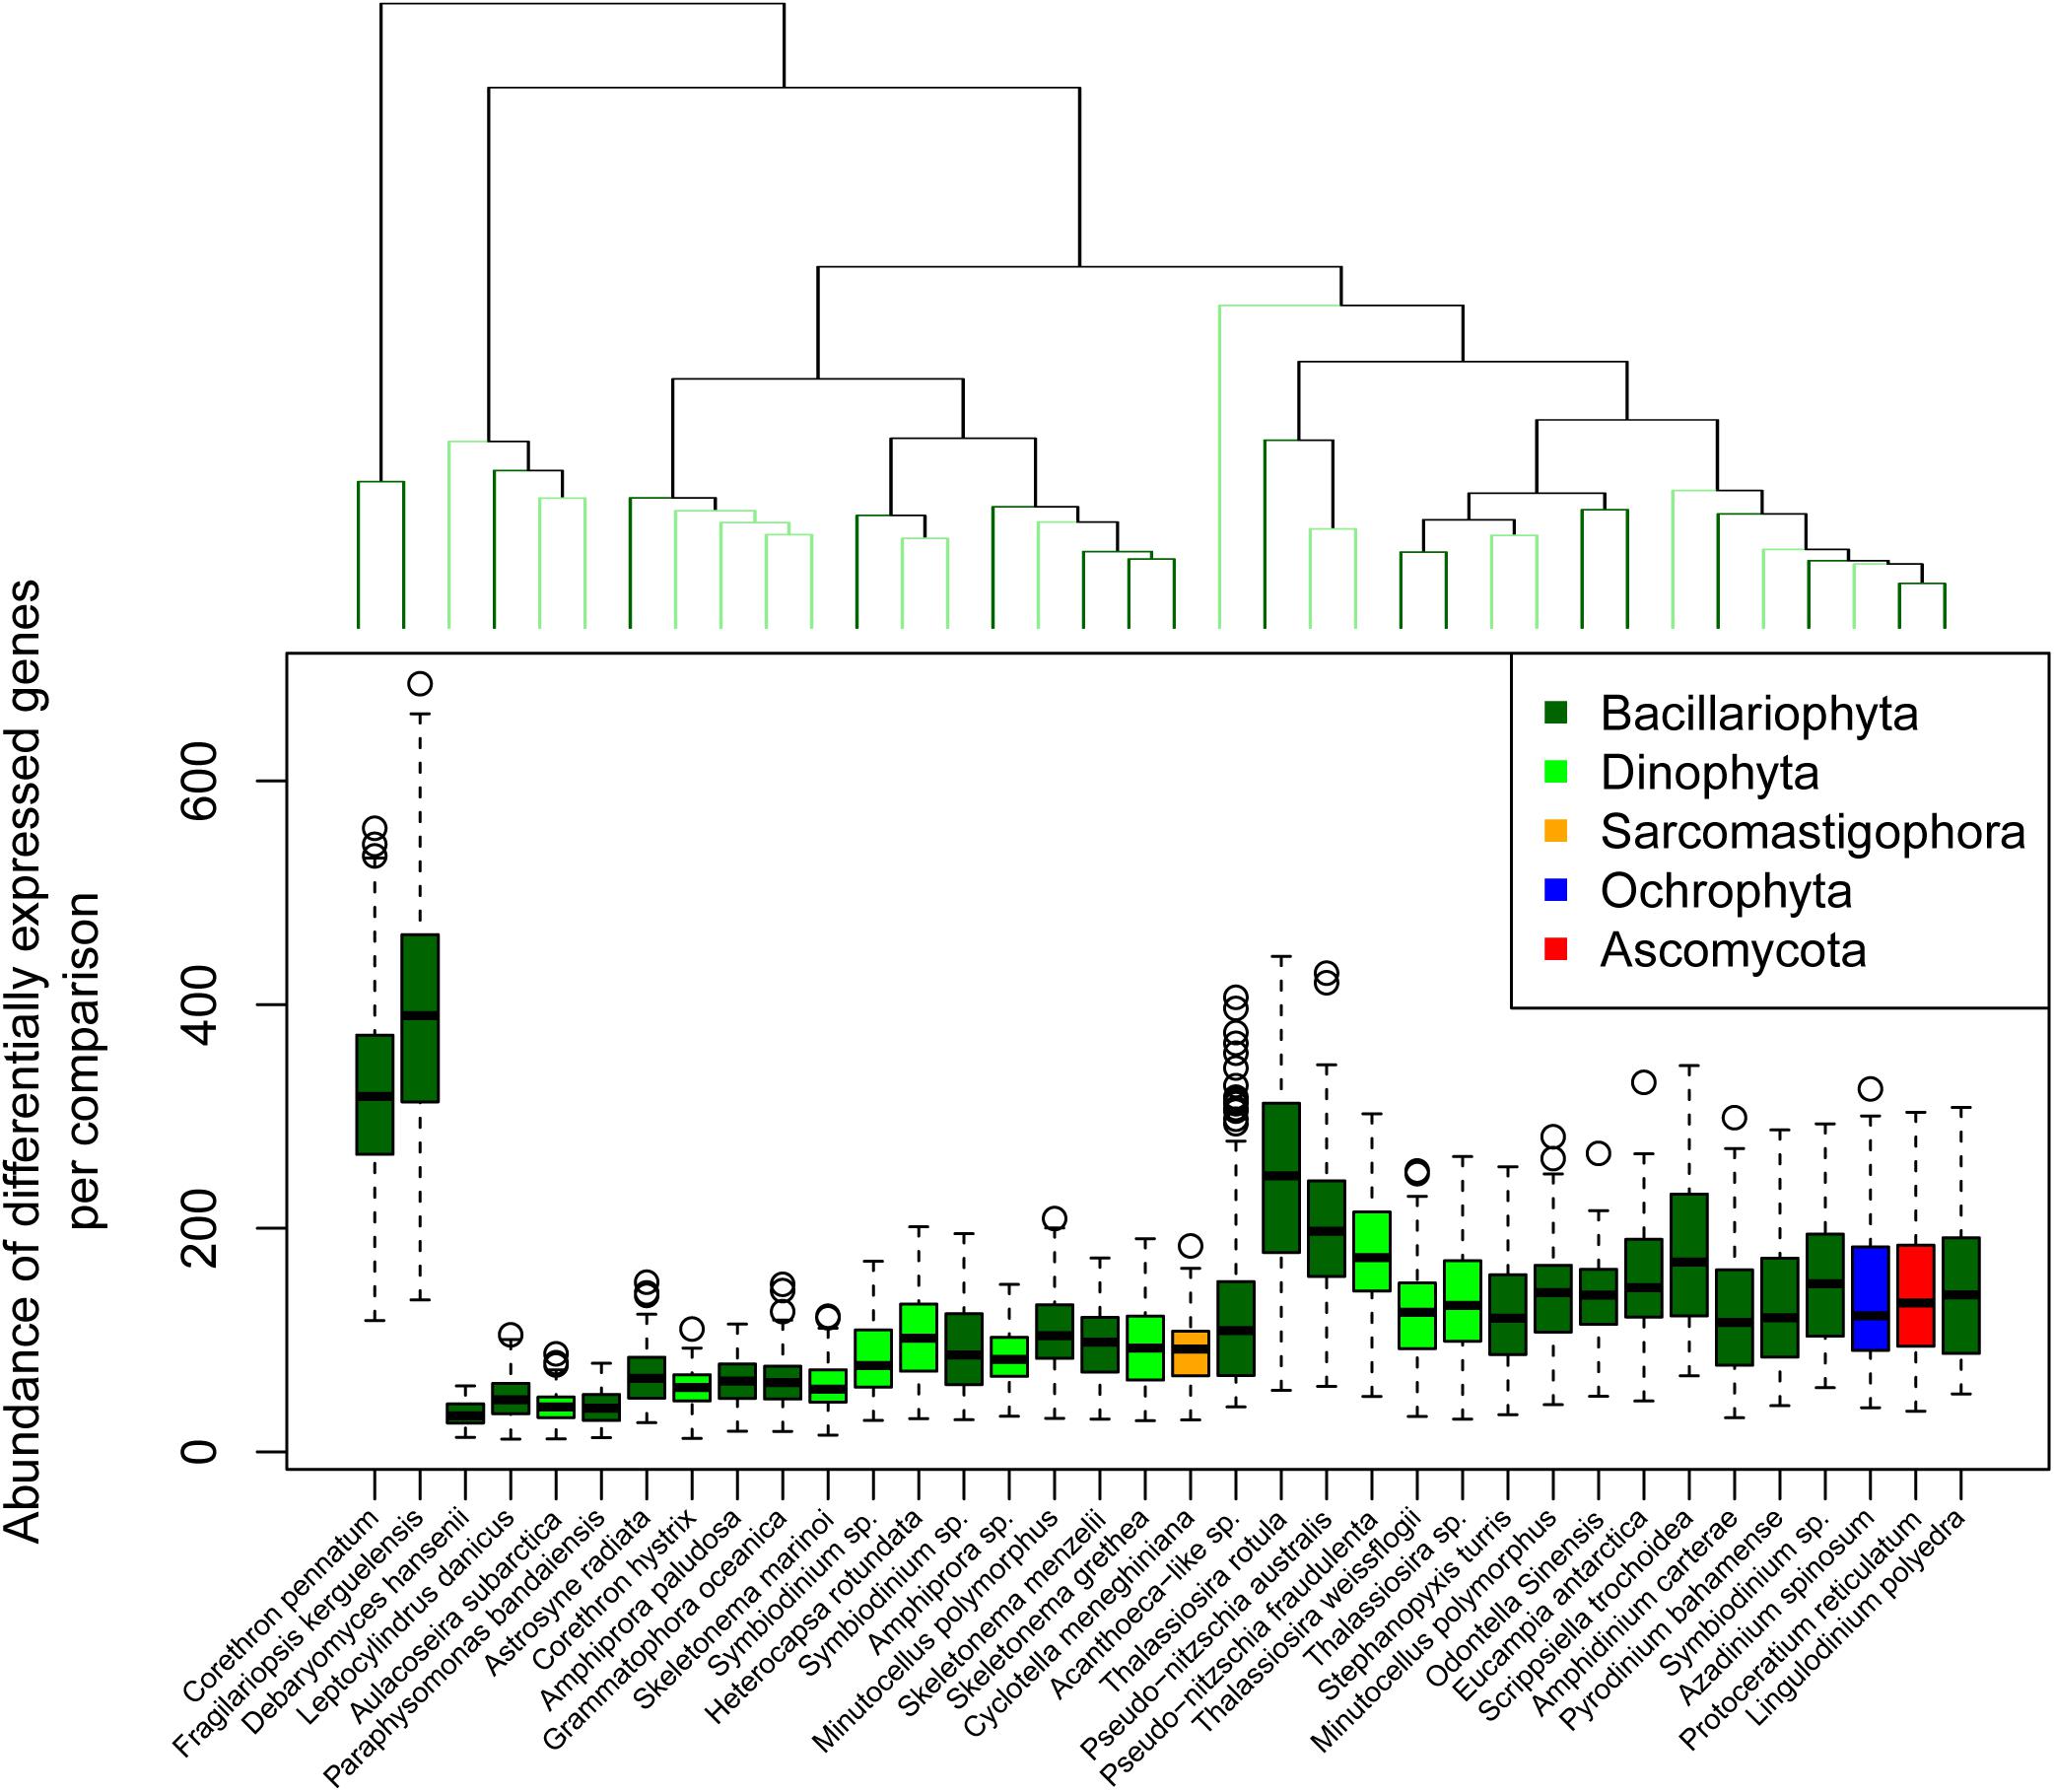
Figure 4. Transcriptional response strength. Transcriptional response strength was determined as the summed, normalized log2 fold-change for all significantly differentially expressed genes in each reference transcriptome between two points of comparison. The dendrogram at the top of the plot indicates similarity according to the total number of transcripts associated with differentially expressed genes between points of comparison but does not consider the identify of those genes. Significant clusters are indicated by alternating light and dark green color.
principal component 1 accounted for between 18.0 and 50.3% of variance across the points of comparison for all reference transcriptomes (Table 1; mean = 29.0%, SD = 9.2%). Using the magnitude of each sample comparison in PC1, we identified 23 distinct clusters of reference transcriptomes when organized by response to environmental gradients (normalized magnitude of points of comparison in PC1) (Supplementary Figure 6). Although they did not form a statistically significant cluster, the 10 dinoflagellate references formed a coherent group. These references showed a strong positive expression response for the Ice Station day 20 samples in comparison to the microcosms, and a strong negative expression response for the Station B day 7 samples when compared to the day 8 microcosms (November 18). It is important to recognize that the magnitude in PC1 for a given sample comparison only considers the degree of response according to log2 fold-change, it does not imply that similar genes are being up- or down-regulated. The three reference transcriptomes with the largest response strength (F. kerguelensis and C. pennatum) and complexity (F. kerguelensis, C. pennatum, and T. rotula) clustered separately from one another in the PC1 magnitude analysis, though C. pennatum clustered with MMETSP0139 (Pseudo-nitzschia australis 1024910AB), and F. kerguelensis clustered with MMETSP0105 (Acanthoeca sp. 10tr).
To take a closer look at the three reference transcriptomes that exhibited the highest response complexity (T. rotula, F. kerguelensis, and C. pennatum) we considered the transcripts for each reference with the highest cos2 values for PC1 (Figure 5). These transcripts were presumed to contribute strongest to the transcriptional response described by PC1. Each of these references had a different transcriptional profile according to cos2, with the largest cos2 values associated with Ficus kerguenlensis. For that reference, contributions to PC1 were led by transcripts coding for phosphoenolpyruvate carboxykinase (EC 4.1.1.49), 3-hydroxyacyl-CoA dehydrogenase (EC 1.1.1.35), and triacylglycerol lipase (EC 3.1.1.3). Transcripts contributing most to PC1 for T. rotula coded for a hypothetical protein, a glutathione amide-dependent peroxidase (EC 1.11.1.17), malate dehydrogenase (EC 1.1.1.37), and cell division protein FtsH (EC 3.6.4.3). For C. pennatum, major contributors to PC1 included UDP-glucuronate decarboxylase (EC 4.1.1.35), proline dehydrogenase (EC 1.5.5.2), fatty acid desaturase (EC 1.14.19.3), and acyl-lipid omega-6 desaturase (EC 1.14.19.22).
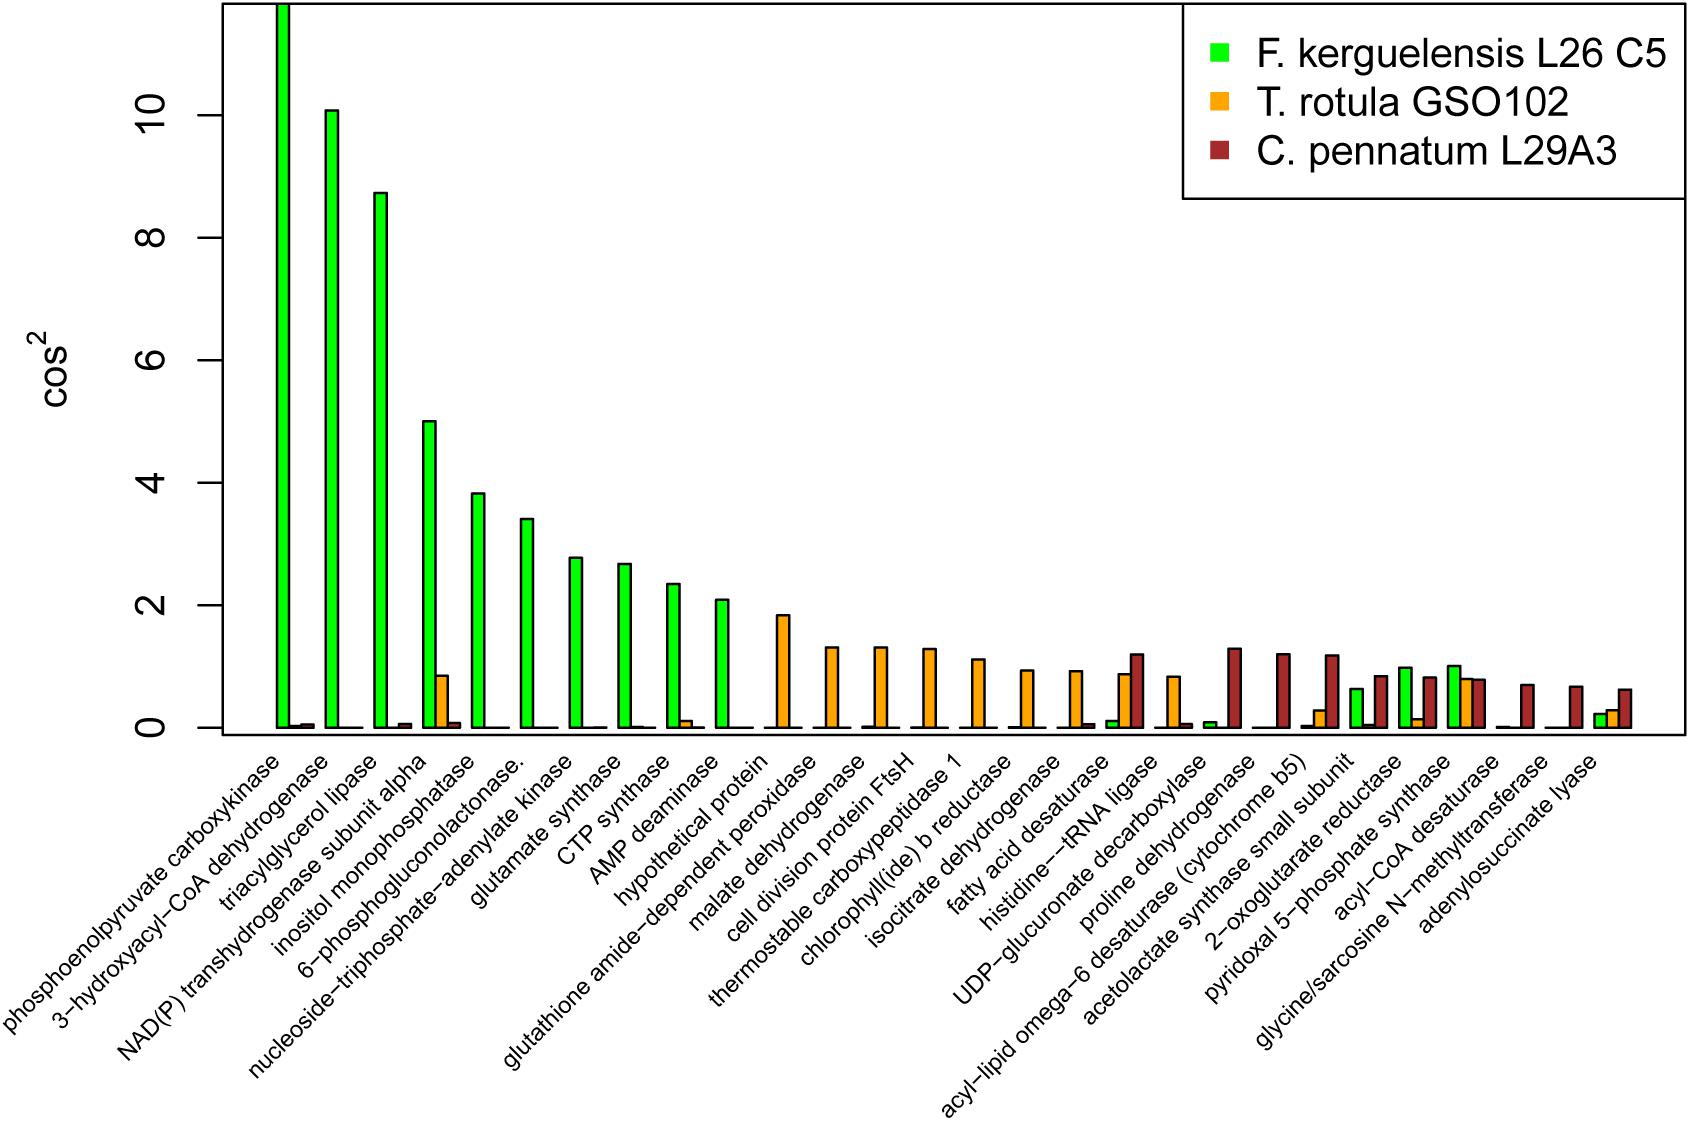
Figure 5. Major transcriptional response associated with the first principal component (PC1) for Fragilariopsis kerguelensis, Thalassiosira rotula, and Corethron pennatum. The cos2 metric is a measure of the contribution of each variable to a PC. The higher the cos2 value, the greater the contribution of that variable.
Lipid Distribution and Correlation With Metatranscriptomes
Triacylglycerols were the most abundant lipid class, followed by FFA (Figure 6 and Supplementary Figures 7, 8). TAGs rapidly increased in the microcosms, from 1847.3 pM at T0 (November 10) to 10,252.6 pM at the end (day 8). Over the same period, TAGs also increased at the Ice Station, reaching 11,132.3 pM on day 15. TAG concentrations at Station B reached 11,327.9 pM that same day, and increased by more than fourfold to 53,391.4 pM on day 34. At T0 the dominant TAGs were 48:2 and 48:1. For the microcosms, by day 8 the dominant TAG was 52:9, while at the end of the sampling period the dominant TAGs at Station B were 50:6, 52:6, and 52:7 (Supplementary Figure 7).
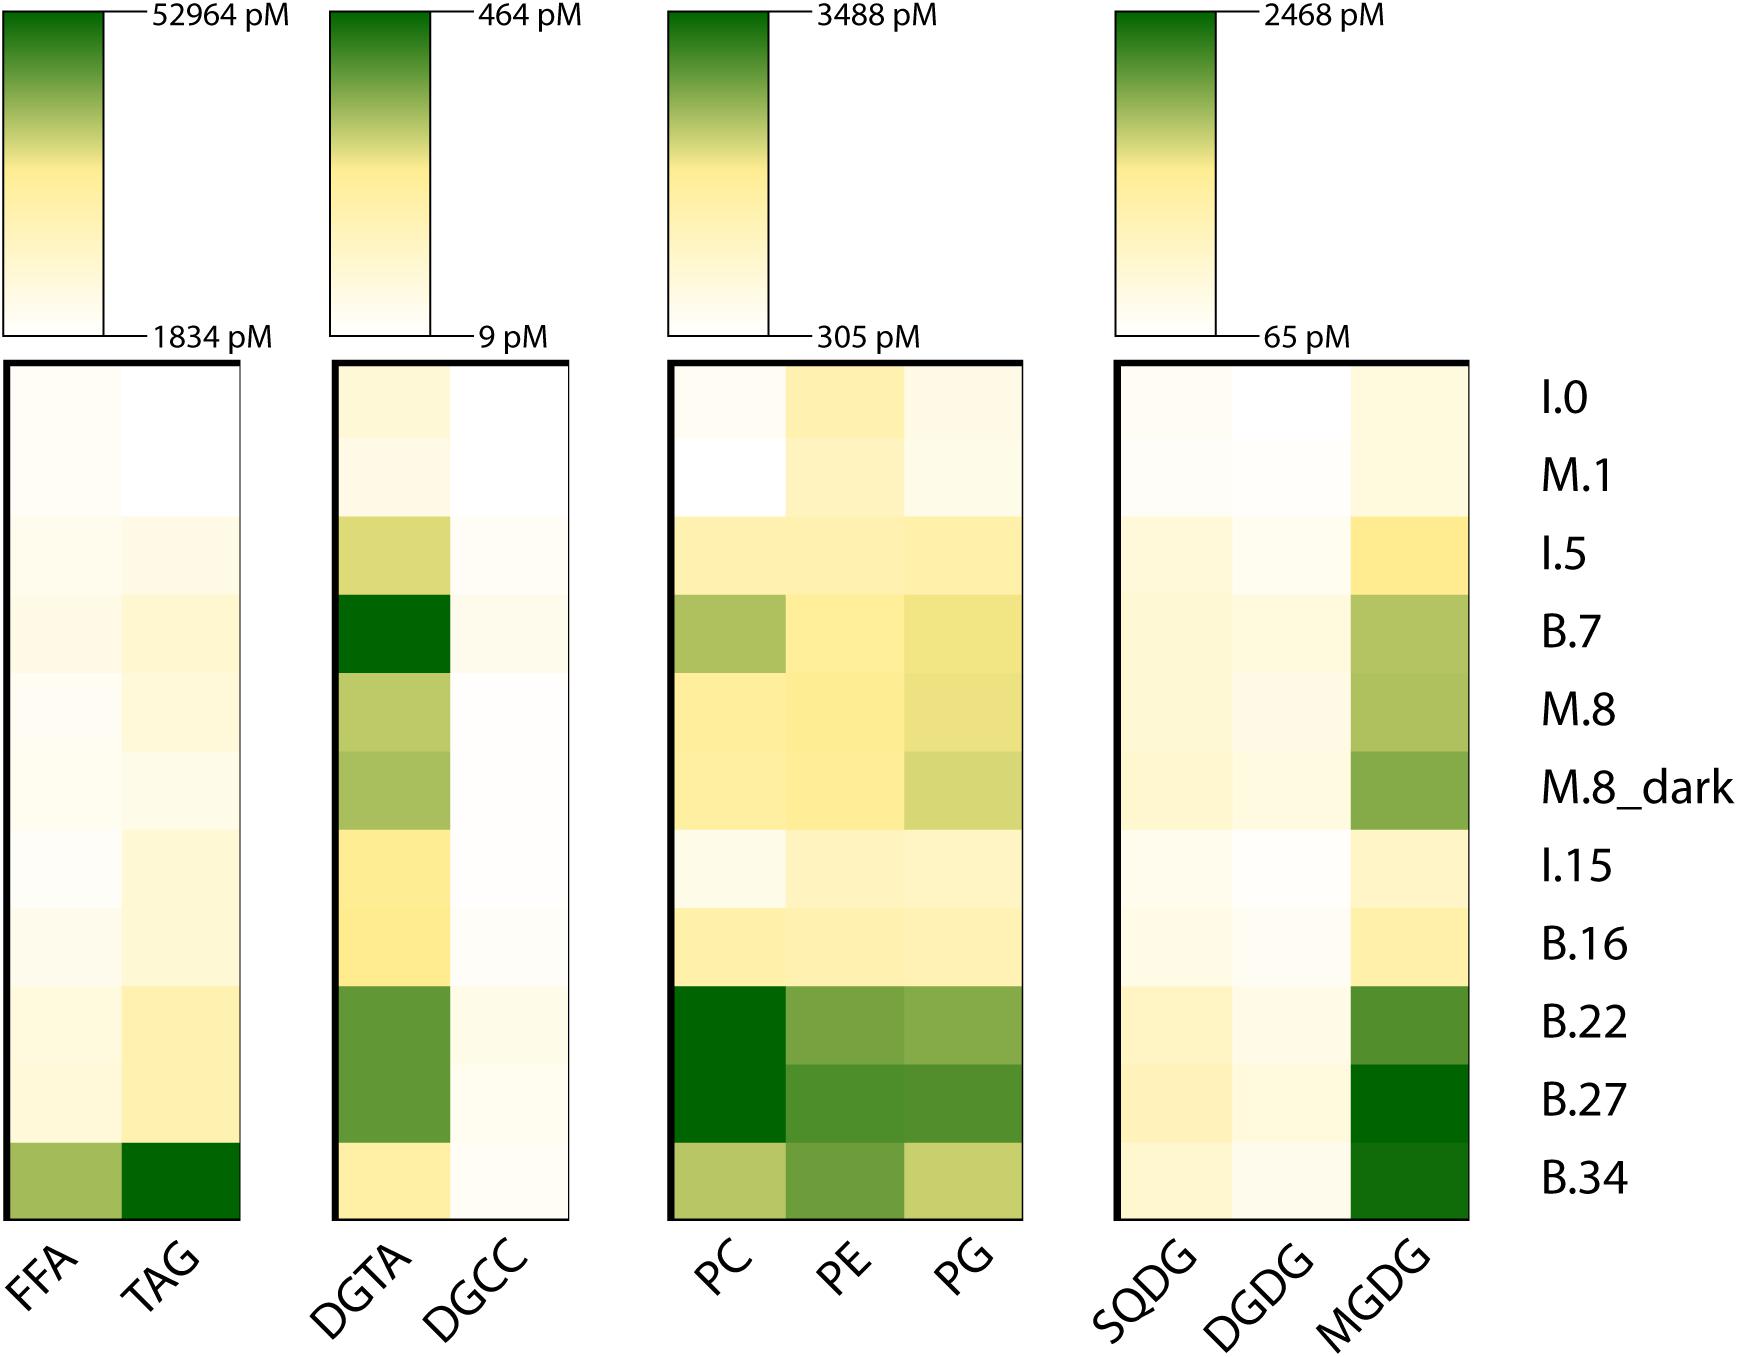
Figure 6. The abundance of major lipid classes during the experiment. The rows are sampling point, where the letter indicates experimental condition (I, ice station; M, microcosm; B, Station B), the number indicates days since the start of the experiment on November 10, 2015. The lipids are grouped according to abundance (TAG and FFA) and physiological role (DGTA and DGCC; PC, PE, and PG; SQDG, DGDG, and MGDG). Due to the large difference in abundance between groups each group is scaled differently.
Free fatty acids were the next most abundant lipid class (Figure 6) and exhibited a more variable distribution (Supplementary Figure 8). FFAs increased only slightly from 4409.3 pMol at the start of the microcosm experiment to 4901.2 pMol at the end of the experiment (day 8). Over the same period FFA increased at the Ice Station to 5697.5 pMol on day 5 (November 15), but then decreased to 3802.2 on day 15. FFA initially declined at Station B, from 7509.9 pMol on day 6 to 6233.1 pMol on day 15, however, FFA increased dramatically at Station B after day 15, ending at 36,632.8 pMol on day 34. Initially the dominant FFA was 18:0, however, 20:5 was the most abundant FFA in the microcosms by day 8, and this FFA was also dominant at Station B after day 22 (Supplementary Figure 8).
To look for correlations between changes in lipid concentration (Δlipid) and gene expression, we evaluated Pearson’s r for Δlipid and PC1 for all reference transcriptomes (Figure 7A). Mean variance in Δlipid explained by PC1 ranged from 10.41% for C. pennatum and 0.53% for T. rotula GSO102. C. pennatum and Aulacoseira subarctica yielded the strongest correlations between PC1 and Δlipid (Figures 7C–F), ranging from r = 0.57 for MGDG 24:0 (Figure 7C) to r = −0.71 for DGCC 37:0 (Figure 7D). Clustering the reference transcriptomes by r yielded two groups. One group, exemplified by P. australis 1024910AB, F. kerguelensis, and C. pennatum, was characterized by largely negative correlations with PC1, except for FFA and select DGCC lipids (Figure 7A). The other group was exemplified by MMETSP1362 (Leptocylindrus danicus CCMP1856), MMETSP1057 (Cyclotella meneghiniana CCMP338), and Aulacoseira subarctica CCAP1002-5. These had largely positive correlations between Δlipid and PC1, and weak or negative correlations between FFA and PC1.
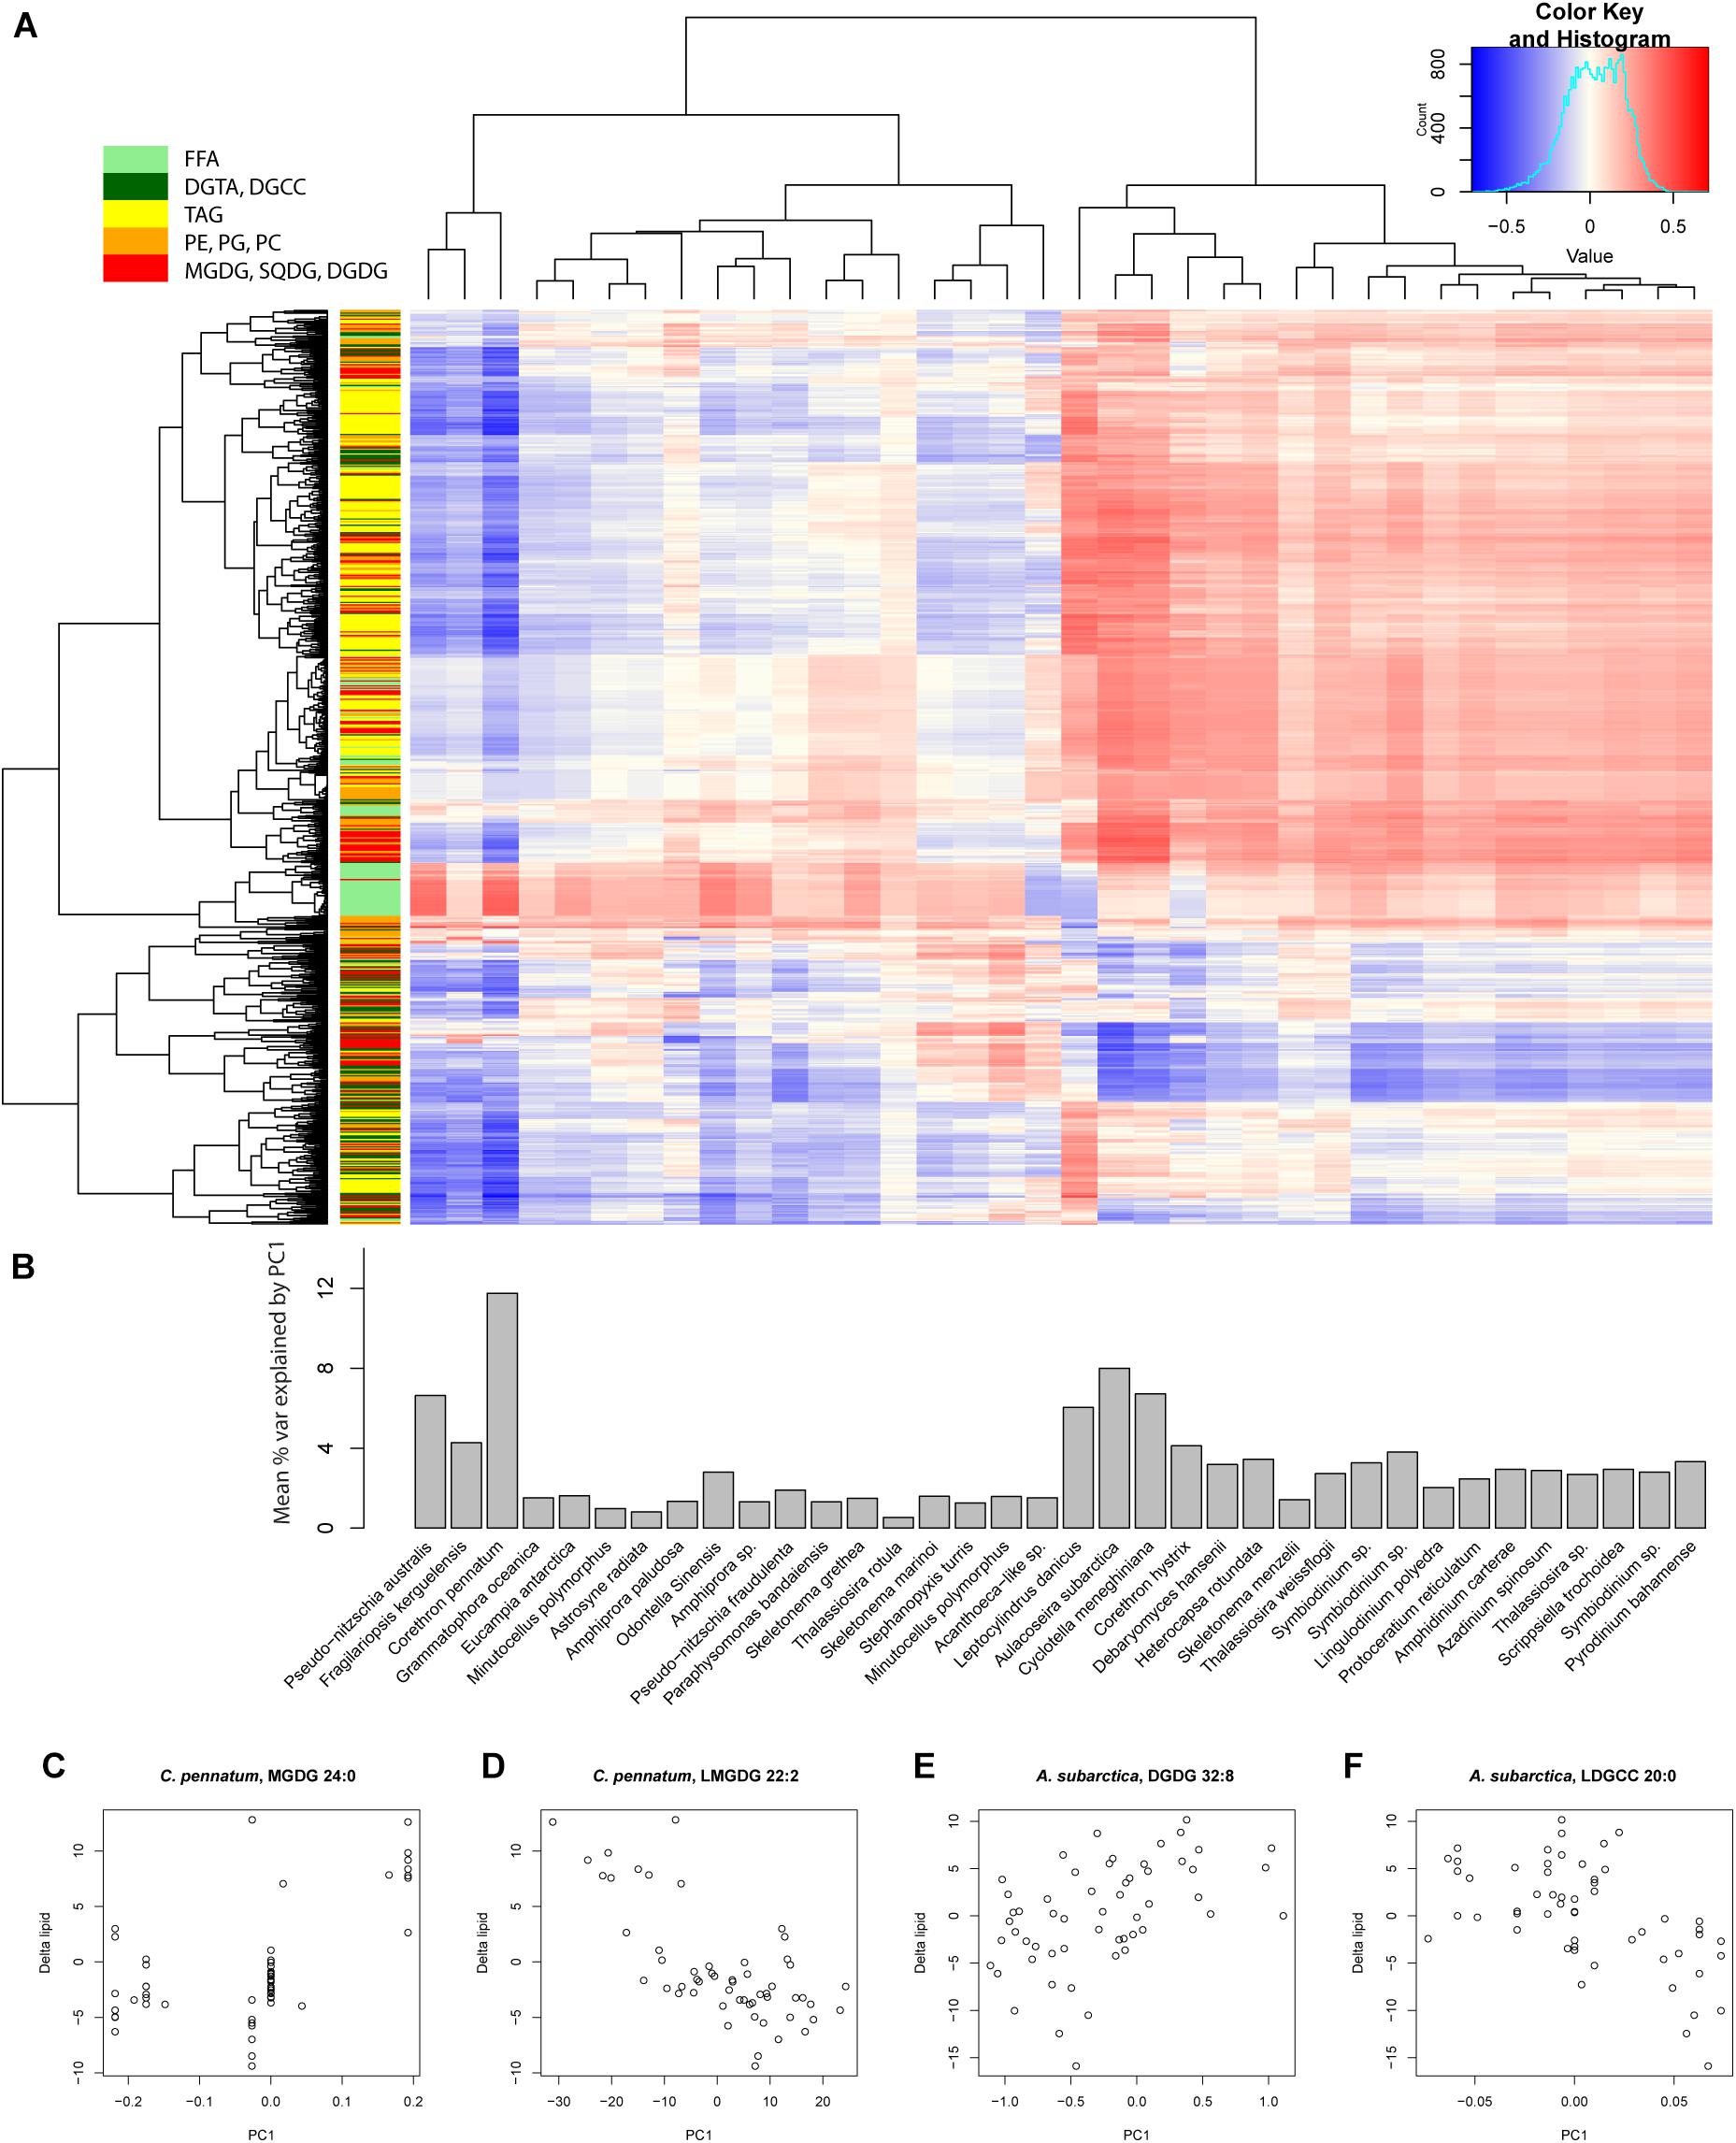
Figure 7. Correlation between the first principal component (PC1) and individual lipids for each reference transcriptome. (A) Matrix of Pearson’s correlation coefficient (r) for each lipid and PC1 for all reference transcriptomes. Columns and rows of the correlation matrix are organized according to hierarchical clustering based on Euclidean distance. Row colorbar indicates the class of lipid. FFA, free fatty acid; DGTA, Diacylglyceryl hydroxymethyl-trimethylalaninee; DGCC, Diacylglyceryl hydroxymethyl-trimethylalaninee; TAG, triacylglycerol; PE, phosphatidylethanolamine; PG, phosphatidylglycerol; PC, phosphatidylcholine; MGDG, monogalactosyldiacylglycerol; SQDG, sulfoquinovosyldiacylglycerol; DGDG, digalactosyldiacylglycerol. (B) Barplot of mean % variance explained for all lipids by PC1 for each reference transcriptome. Calculated by taking the mean of r2 for each column in (A). These values are distinct from the variance explained by PC1 for the transcriptome data described by the principal components. (C–F) Scatterplots of Δlipid and PC1 for the highest r2 values for Corethron pennatum (MMETSP0169) and Aulacoseira subarctica (MMETSP1064). These two reference transcriptomes had the highest mean % variance explained by PC1.
Discussion
Dynamic light conditions are associated with the winter to spring seasonal transition in the coastal Antarctic. Superimposed on the steady increase in irradiance associated with solar declination and day length are variable-term variations in irradiance caused by sea ice cover. We observed that the development of the spring phytoplankton bloom was significantly impeded by sea ice cover at our ice station, with only a slight increase in chlorophyll a over the observational period. Nonetheless, the concentration of TAGs increased at the ice station from day 0 to day 15, consistent with the downregulation of the gene coding for triacylglycerol lipase (EC 3.1.1.3) in F. kerguelensis and increasing PP. Combined with the up-regulation of genes coding for DNA polymerase, this suggests that F. kerguelensis was acclimated to the extreme low light conditions present and actively undergoing PP at the Ice Station throughout the experimental period.
This early transcriptional activity suggests a diverse lipid utilization strategy by the phytoplankton associated with the F. kerguelensis transcriptome. F. kerguelensis was by far the most transcriptionally active reference for the gene coding triacylglycerol lipase. Although the gene was generally down-regulated from earlier to later season samples, and from the Ice Station to Station B, it was up-regulated in the microcosms on days 1, 3, and 8 in comparison with day 0. One possible explanation is that F. kerguenlensis had become photoinhibited within 24 h of exposure to high light conditions, and reverted to lipid catabolism for energy. There is strong evidence for photoinhibition in the microcosms by day 1. Although Fv/Fm increased slightly before dropping on day 3, ρ, a measure of reaction center connectivity, dropped sharply.
Other members of the phytoplankton community responded quickly to the simulated removal of ice and release from light limitation. Within 192 h, chlorophyll a concentration had more than doubled, TAG lipid concentrations had reached parity with those observed at Station B the day prior (despite the up-regulation of triacylglycerol lipase by F. kerguelensis), and the transcriptional response was dominated by a mixed diatom community. Diatoms represented by the reference transcriptomes T. rotula, F. kerguelensis, and C. pennatum were observed to have the strongest and most complex transcriptional response to changing environmental conditions. The specific response, however, and underlying transcriptional patterns varied widely across these references. As seen by the magnitude in PC1 for these points of comparison (Figure 7B), C. pennatum responded strongest to the experimental conditions in the microcosms, with high values for the transition from Ice Station day −6 and day 0 samples to the microcosm day 8 and Station B day 16 samples. We consider the phytoplankton associated with the C. pennatum reference transcriptome as high light specialists capable of rapidly responding to a stable light regime. Based on the % variance in lipid concentration explained by PC1 (Figure 7B), C. pennatum was also the dominant driver of the composition of the lipidome over the course of the experiment. Overall, our analysis suggests that the lipidome and transcriptome were only weakly connected. This may reflect a more complex and transient transcriptional regulation of the lipidome that is not easily detected by correlation, or alternate modes of regulation.
In contrast to C. pennatum, F. kerguelensis down-regulated the genes coding for DNA polymerase between the microcosm day 1 and day 8 samples, but up-regulated them between the Ice Station day 0 and Station B samples. Similarly, F. kerguelensis had a neutral or down-regulated response to these conditions in genes coding for Photosystems I and II. This is consistent with the idea of F. kerguelensis-associated phytoplankton as low-light specialists, capable of early-season growth below sea ice and within the marginal ice zone, but inhibited in the higher light regime represented by the microcosm experiments.
The phytoplankton associated with the T. rotula reference transcriptome may represent an intermediate case. Like F. kerguelensis, T. rotula responded strongly in comparisons between Ice Station day 0 and Station B days 27 and 34. Unlike F. kerguelensis, T. rotula showed an early positive growth response to the microcosm conditions through up-regulation of the genes coding for DNA polymerase. This regulation was not sustained over the course of the microcosm experiments, however, and could represent an effort to repair damage brought on by the rapid increase in light, or a quick transition from a preferential to inhibiting photon dose.
Transcripts associated with several dinoflagellates were observed over the course of the experiment. The dinoflagellate references exhibited similar transcriptional response strength and complexity, and low mean % variance explained by PC1 (Figure 7B), suggesting a weak connection to the lipidome. Although very few studies have evaluated the ecological role of dinoflagellates along the WAP, they are thought to form blooms (Schofield et al., 2017) and to play a significant role in the regional carbon budget (Lin et al., 2017). Dinoflagellates are well known for their unusual modes of transcriptional regulation, which can lead to a reduced transcriptional response to changing environmental conditions. Because our analysis considered only the log2 fold-change of significantly differentially expressed genes, the role of dinoflagellates may be underrepresented in this study. Despite this potential issue, dinoflagellate associated transcripts for PSI, PSII, and RUBISCO dominated transcriptional responses to increased light. This suggests that they are not poised to take immediate advantage of available light, as the diatoms may be, perhaps because they are able to supplement their nutritional needs during low light conditions through mixotrophic grazing.
Our findings come with two important caveats. One is that the true composition of the community does not necessarily reflect the mapping of reads to our reference transcriptomes, however, many of the references mapped are expected members of the WAP phytoplankton assemblage. F. kerguelensis, C. pennatum, and T. rotula in particular have been observed in the region or in coastal Antarctica. T. rotula is highly cosmopolitan (Whittaker et al., 2012), while C. pennatum and F. kerguelensis have previously been observed in WAP phytoplankton blooms (Lange et al., 2007; Świło et al., 2016). It is important to note that the model sea ice diatom F. cylindrus, a known low-light specialist with broad distribution in the Antarctic, is not present in the MMETSP database. Thus, read recruitment to F. kerguelensis could represent the presence of F. cylindrus. Other species not present in our database may also have been present in our samples. To work around this we focused our analysis on the specific response of those taxa we were able to observe.
The second caveat is that transcriptional response to the day 8 dark control in our microcosm experiments is very similar to that of the day 8 treatment. The amount of screening needed to achieve a 1% irradiance level was determined experimentally with the PAR meter, however, it was not possible to verify this light level after the carboys had been screened. Thus we suspect light leakage resulted in a higher light level than anticipated. Although we do not know what range of light was represented by our treatment and control, the expected wide difference in irradiance yet similar response points to the broad niche defined by “normal” light levels.
Here we used a novel analytical approach to couple two high-dimensional datasets. Although our findings are inferential, and further experiments will be required to confirm the changes in gene expression and lipid composition that we observed for different reference transcriptomes, we have identified phytoplankton responding to different light levels brought on by variable sea ice conditions. Putative low light and high light specialists had distinct transcriptional signatures, and impacts on the community lipidome. As sea ice cover along the western Antarctic Peninsula continues to change on annual and decadal scales, we expect these changes to impact the composition of the phytoplankton community, and the concentration and composition of the lipidome. Because of the ecological role played by lipids, which function as key sources of energy, as signaling molecules, and even toxins, we expect these changes to have wider ecosystem ramifications during the critical winter–spring seasonal transition.
Data Availability Statement
The datasets presented in this study can be found in online repositories. The names of the repository/repositories and accession number(s) can be found below: NCBI BioProject, PRJNA494856.
Ethics Statement
Written informed consent was obtained from the individuals for the publication of any potentially identifiable images or data included in this article.
Author Contributions
JB and JC designed the study with input from HD, BV, and NC. JB, JC, and NC carried out the sampling with assistance from CH. DL, HF, and BV contributed the lipidomics analysis. JB carried out the metatranscriptomics analysis and drafted the initial version of the manuscript. RG and CH contributed discussions of protist physiology and enzyme functions. All authors edited the manuscript.
Funding
JB was supported by NSF-OPP 1641019, NSF-OPP 1846837, and the Simons Foundation Early Career Marine Microbial Investigator program. BV, DL and JC were supported by NSF (OPP-1543328 and OCE-1756254). CH was supported by NSF OCE-1355720. The Palmer LTER project is support by NSF-OPP 1440435. A small-scale Community Sequencing Project (CSP) award from the DOE Joint Genome Institute supported part of the sequencing effort.
Conflict of Interest
The authors declare that the research was conducted in the absence of any commercial or financial relationships that could be construed as a potential conflict of interest.
Acknowledgments
We would like to thank Ashley Goncalves and Chelsea Farischon for assistance with sampling at Palmer Station, and the Palmer Station logistics personnel for their dedication during the 2015–2016 season. Satellite imagery in support of this project (see Figure 1A) was kindly provided by the Polar Geospatial Center.
Supplementary Material
The Supplementary Material for this article can be found online at: https://www.frontiersin.org/articles/10.3389/fmars.2021.593566/full#supplementary-material
Supplementary Figure 1 | PAR profiles for Station B and the Ice Station.
Supplementary Figure 2 | Differential expression of genes coding for DNA polymerase. Only significant values are shown, all other values are represented as 0.
Supplementary Figure 3 | Differential expression of genes coding for Photosystem I. Only significant values are shown, all other values are represented as 0.
Supplementary Figure 4 | Differential expression of genes coding for Photosystem II. Only significant values are shown, all other values are represented as 0.
Supplementary Figure 5 | Differential expression of genes coding for RUBISCO. Only significant values are shown, all other values are represented as 0.
Supplementary Figure 6 | The magnitude of each point of comparison in the first principal component (PC1) of each reference transcriptome. Reference transcriptomes and points of comparison are organized by hierarchical clustering based on Euclidean distance. For the reference transcriptomes only, significant clusters as determined by simprof analysis are indicated by alternating light and dark green colors. Reference transcriptomes that fall in the same cluster, or that clustered more closely, can be interpreted as responding to similar changes in environmental conditions. The nature of the transcriptional response, however, is likely different (and can be evaluated through an analysis of cos2). The row names in the heatmap describe the two sample points being compared. The letter describes the sample type (M, microcosm; B, Station B; I, Ice Station) and the number describes the experimental day (days from day 0).
Supplementary Figures 7–14 | bye Heatmaps of abundance for the 50 most abundant lipids for all analyzed lipid classes.
References
Becker, K. W., Collins, J. R., Durham, B. P., Groussman, R. D., White, A. E., Fredricks, H. F., et al. (2018). Daily changes in phytoplankton lipidomes reveal mechanisms of energy storage in the open ocean. Nat. Commun. 9:5179. doi: 10.1038/s41467-018-07346-z
Benton, H. P., Want, E. J., and Ebbels, T. M. D. (2010). Correction of mass calibration gaps in liquid chromatography-mass spectrometry metabolomics data. Bioinformatics 26, 2488–2489. doi: 10.1093/bioinformatics/btq441
Bligh, E. G., and Dyer, W. J. (1959). A rapid method of total lipid extraction and purification. Can. J. Biochem. Physiol. 37.
Bowman, J., and Ducklow, H. (2015a). Microbial communities can be described by metabolic structure: a general framework and application to a seasonally variable, depth-stratified microbial community from the coastal West Antarctic Peninsula. PLoS One 10:e0135868.
Bowman, J., and Ducklow, H. (2015b). paprica. Available online at: https://github.com/bowmanjeffs/paprica.
Bowman, J. S., Vick-Majors, T. J., Morgan-Kiss, R. M., Takacs-Vesbach, C., Ducklow, H. W., and Priscu, J. C. (2016). Microbial community dynamics in two polar extremes: the lakes of the mcmurdo dry valleys and the west antarctic peninsula marine ecosystem. Bioscience 66, 830–847.
Collins, J. R., Edwards, B. R., Fredricks, H. F., and Van Mooy, B. A. S. (2016). LOBSTAHS: an adduct-based lipidomics strategy for discovery and identification of oxidative stress biomarkers. Anal. Chem. 88, 7154–7162. doi: 10.1021/acs.analchem.6b01260
Collins, J. R., Fredricks, H. F., Bowman, J. S., Ward, C. P., Moreno, C., Longnecker, K., et al. (2018). The molecular products and biogeochemical significance of lipid photooxidation in West Antarctic surface waters. Geochim. Cosmochim. Acta 232, 244–264. doi: 10.1016/j.gca.2018.04.030
Edwards, B. R., Bidle, K. D., and Van Mooy, B. A. S. (2015). Dose-dependent regulation of microbial activity on sinking particles by polyunsaturated aldehydes: implications for the carbon cycle. Proc. Natl. Acad. Sci. U.S.A. 112:201422664. doi: 10.1073/pnas.1422664112
Hummel, J., Segu, S., Li, Y., Irgang, S., Jueppner, J., and Giavalisco, P. (2011). Ultra performance liquid chromatography and high resolution mass spectrometry for the analysis of plant lipids. Front. Plant Sci. 2:54. doi: 10.3389/fpls.2011.00054
Kassambara, A., and Mundt, F. (2017). factoextra: Extract and Visualize the Results of Multivariate Data Analyses. Available online at: https://cran.r-project.org/package=factoextra (accessed April 01, 2020).
Keeling, P. J., Burki, F., Wilcox, H. M., Allam, B., Allen, E. E., Amaral-Zettler, L. A., et al. (2014). The marine microbial eukaryote transcriptome sequencing project (MMETSP): illuminating the functional diversity of eukaryotic life in the oceans through transcriptome sequencing. PLoS Biol. 12:e1001889. doi: 10.1371/journal.pbio.1001889
Kennedy, F., Martin, A., Bowman, J. P., Wilson, R., and McMinn, A. (2019). Dark metabolism: a molecular insight into how the Antarctic sea-ice diatom Fragilariopsis cylindrus survives long-term darkness. New Phytol. 223, 675–691. doi: 10.1111/nph.15843
Kuhl, C., Tautenhahn, R., Bottcher, C., Larson, T. R., and Neumann, S. (2012). CAMERA: an integrated strategy for compound spectra extraction and annotation of liquid chromatography/mass spectrometry data sets. Anal. Chem. 84, 283–289. doi: 10.1021/ac202450g
LaJeunesse, T. C., Parkinson, J. E., Gabrielson, P. W., Jeong, H. J., Reimer, J. D., Voolstra, C. R., et al. (2018). Systematic revision of Symbiodiniaceae highlights the antiquity and diversity of coral endosymbionts. Curr. Biol. 28, 2570.e6–2580.e6. doi: 10.1016/j.cub.2018.07.008
Lange, P. K., Tenenbaum, D. R., De Santis Braga, E., and Campos, L. S. (2007). Microphytoplankton assemblages in shallow waters at Admiralty Bay (King George Island, Antarctica) during the summer 2002-2003. Polar Biol. 30, 1483–1492. doi: 10.1007/s00300-007-0309-8
Langmead, B., Trapnell, C., Pop, M., and Salzberg, S. L. (2009). Ultrafast and memory-efficient alignment of short DNA sequences to the human genome. Genome Biol. 10:R25. doi: 10.1186/gb-2009-10-3-r25
Lin, Y., Cassar, N., Marchetti, A., Moreno, C., Ducklow, H., and Li, Z. (2017). Specific eukaryotic plankton are good predictors of net community production in the Western Antarctic Peninsula. Sci. Rep. 7, 1–11. doi: 10.1038/s41598-017-14109-1
Love, M. I., Huber, W., and Anders, S. (2014). Moderated estimation of fold change and dispersion for RNA-seq data with DESeq2. Genome Biol. 15:550. doi: 10.1186/s13059-014-0550-8
Palmer LTER Science Team (2021). Palmer LTER Datazoo. Available online at: http://pal.lternet.edu/data.
Popendorf, K. J., Fredricks, H. F., and Van Mooy, B. A. S. (2013). Molecular ion-independent quantification of polar glycerolipid classes in marine plankton using triple quadrupole MS. Lipids 48, 185–195. doi: 10.1007/s11745-012-3748-0
R Core Team (2014). R: A Language and Environment for Statistical Computing. Available online at: http://www.r-project.org/ (accessed December 1, 2012).
Schofield, O., Saba, G., Coleman, K., Carvalho, F., Couto, N., Ducklow, H., et al. (2017). Decadal variability in coastal phytoplankton community composition in a changing West Antarctic Peninsula. Deep Sea Res. Part I Oceanogr. Res. Pap. 124, 42–54. doi: 10.1016/j.dsr.2017.04.014
Smith, C. A., Want, E. J., O’Maille, G., Abagyan, R., and Siuzdak, G. (2006). XCMS: processing mass spectrometry data for metabolite profiling using nonlinear peak alignment, matching, and identification. Anal. Chem. 78, 779–787. doi: 10.1021/ac051437y
Stamatakis, A., Zhang, J., and Kobert, K. (2014). PEAR: a fast and accurate Illumina Paired-End reAd mergeR. Bioinformatics 30, 614–620. doi: 10.1093/bioinformatics/btt593
Świło, M., Majewski, W., Minzoni, R. T., and Anderson, J. B. (2016). Diatom assemblages from coastal settings of West Antarctica. Mar. Micropaleontol. 125, 95–109. doi: 10.1016/j.marmicro.2016.04.001
Tautenhahn, R., Bottcher, C., and Neumann, S. (2008). Highly sensitive feature detection for high resolution LC/MS. BMC Bioinformatics 9:504. doi: 10.1186/1471-2105-9-504
Whitaker, D., and Christman, M. (2014). clustsig: Significant Cluster Analysis. Available online at: http://cran.r-project.org/package=clustsig (accessed March 1, 2016).
Keywords: Antarctica, phytoplankton, lipids, metatranscriptomics, Palmer LTER project
Citation: Bowman JS, Van Mooy BAS, Lowenstein DP, Fredricks HF, Hansel CM, Gast R, Collins JR, Couto N and Ducklow HW (2021) Whole Community Metatranscriptomes and Lipidomes Reveal Diverse Responses Among Antarctic Phytoplankton to Changing Ice Conditions. Front. Mar. Sci. 8:593566. doi: 10.3389/fmars.2021.593566
Received: 10 August 2020; Accepted: 29 January 2021;
Published: 18 February 2021.
Edited by:
Anne Helene Solberg Tandberg, University Museum of Bergen, NorwayReviewed by:
Xiubao Li, Hainan University, ChinaKen G. Ryan, Victoria University of Wellington, New Zealand
Copyright © 2021 Bowman, Van Mooy, Lowenstein, Fredricks, Hansel, Gast, Collins, Couto and Ducklow. This is an open-access article distributed under the terms of the Creative Commons Attribution License (CC BY). The use, distribution or reproduction in other forums is permitted, provided the original author(s) and the copyright owner(s) are credited and that the original publication in this journal is cited, in accordance with accepted academic practice. No use, distribution or reproduction is permitted which does not comply with these terms.
*Correspondence: Jeff S. Bowman, jsbowman@ucsd.edu