Agricultural Greenhouse Gas Fluxes Under Different Cover Crop Systems
 Yanyu Wang
 Eri Saikawa
 Alexander Avramov
 Nicholas S. Hill
- 1Department of Environmental Sciences, Emory University, Atlanta, GA, United States
- 2Gangarosa Department of Environmental Health, Rollins School of Public Health, Emory University, Atlanta, GA, United States
- 3Department of Crop and Soil Sciences, University of Georgia, Athens, GA, United States
Cultivated lands that support high productivity have the potential to produce a large amount of GHG emissions, including carbon dioxide (CO2), nitrous oxide (N2O), and methane (CH4). Intensive land management practices can stimulate CO2, N2O, and CH4 emissions from the soil. Cover crop establishment is considered as one of the sustainable land management strategies under warm and humid environmental conditions. To better understand how the incorporation of cover crops affect three major GHGs, we compared trace gas fluxes in a no-till maize field over the whole growing season in 2018 in a no cover crop (Tr) system and three cover crop systems: crimson clover (CC), cereal rye (CR), and living mulch (LM) using white clover. In 2019, we further explored potential differences in the three GHGs between in-row (IR) and between-row (BWR) of maize for LM and Tr systems during the early growing season. Measurements were taken using a cavity ring-down spectroscopy gas analyzer in Watkinsville, GA. In 2018, the highest CO2 flux (7.00 μmol m−2 s−1) was observed from BWR of maize for LM. The maximum N2O flux observed in LM on June 20th in 2018 was when soil N increase rate was the largest. Soils served as sinks for CH4 and Tr system served as the smallest CH4 sink compared to the other three cover crop systems. For N2O, the highest fluxes were observed from the TrIR plot (4.13 μmol m−2 hr−1) in 2019 with the greatest N inputs. In 2019, we observed a smaller CH4 sink in TrIR (−0.13 μmol m−2 hr−1) compared to TrBWR (−0.67 μmol m−2 hr−1) due potentially to greater inhibition effects on CH4 consumption from greater N fertilizer inputs. The net carbon equivalent (CE) from May 23rd to Aug 16th in 2018, taking into account the three GHG fluxes, soil carbon content, and fertilizer, irrigation, and herbicide application, were 32–97, 35–101, 63–139, and 40–106 kg ha−1 yr−1 for CC, CR, LM, and Tr, respectively. LM had the lowest net CE after removing white clover respiration (−16–60 kg ha−1 yr−1). Our results show that implementing different types of cover crop systems and especially the LM system have some potential to mitigate climate change.
Introduction
Agriculture is essential for producing food and sustaining livelihoods, but it is also a large source of greenhouse gas (GHG) emissions, contributing to climate change. These environmental impacts are usually associated with the specific agricultural practice of mono-cropping, whereby a single crop is grown on a certain amount of land year after year, with heavy dependence on fertilizers and pesticides. 80% of the 1.5 billion hectares of arable land globally are devoted to mono-cropping. Another practice that has recently gained attention is to plant cover crops after harvest to prevent soil erosion, accumulate organic carbon (C) in soil, and to suppress weeds (Blanco-Canqui et al., 2015; Hanrahan and Mahl, 2018). Intercropping is yet another agricultural practice whereby more than one crop is grown on the same land area at the same time (Dyer et al., 2012). Intercropping and using cover crops are considered as Climate-Smart Agriculture (CSA) management practices (Paustian et al., 2016). CSA objectives are to: (1) sustainably increase agricultural productivity and incomes; (2) adapt and build resilience to climate change; and (3) reduce GHG emissions and increase C sequestration from soils (FAO, 2013). While the agricultural impacts on the environment are now widely recognized, we still lack the comprehensive understanding of how different agricultural practices affect the soil, atmosphere, and the ecosystems.
How the incorporation of cover crops could influence the mitigation of climate change is also still not well-understood. Studies suggest that cover crops with N-fixing capability (leguminous cover crop) could provide available N to cash crops without additional N inputs (Schomberg et al., 2006; Turner et al., 2016; Andrews et al., 2018). Even cover crops without having the ability to fix N (non-leguminous cover crop) is considered to scavenge the excessive nitrate in the soil and thereby reduce leaching and nitrous oxide (N2O) emissions from denitrification (Smith and Tiedje, 1979; Jarecki et al., 2009). However, studies found that increases in N2O after incorporating cover crops sometimes outweigh the mitigation effects from increased SOC, because mineral N fixed by legume cover crop can stimulate N2O emissions under denitrification (Mitchell et al., 2013; Basche et al., 2014). Moreover, a meta-analysis showed that increased N2O emissions cannot fully offset the enhanced SOC storage after adopting cover crops, and the mitigation potential from cover crops are highly site-specific (Guenet et al., 2021). Increased carbon (C) inputs from cover crop biomass can also enhance carbon dioxide (CO2) emissions. Living mulch (LM) is a recently emerging intercrop system, using leguminous cover crops maintained throughout the whole growing season (Zemenchik et al., 2000; Andrews et al., 2018). There are also conflicting findings as to whether LM would increase or decrease N2O emissions (Gomes et al., 2009; Turner et al., 2016; Peters et al., 2020).
In addition to the impacts on CO2 and N2O emissions, there is no simple characterization on how the inputs of cover crop residue will impact CH4 emissions or uptake capacity. Kim et al. (2012) found that higher CH4 emissions were observed in cover crops with high C/N ratio due to their higher labile C content, which stimulated CH4 emissions under anaerobic conditions (Lu et al., 2000; Le Mer and Roger, 2001). Conversely, Boeckx et al. (1996) observed that residue with low C/N led to high CH4 emissions due to elevated amount of and , which have strong inhibition effects on CH4 uptake. Meanwhile, previous studies revealed that N fertilizer addition, such as urea, usually exhibits inhibitory effects on CH4 consumption (Conrad and Rothfuss, 1991; Bronson and Mosier, 1994; Dunfield and Knowles, 1995). So far, however, it is relatively unknown how N pool in the soil and C/N ratio in cover crop will impact CH4 uptake in soils (Sanz-Cobena et al., 2014; Guardia et al., 2016; Kaye and Quemada, 2017).
Based on the complexities of how the incorporation of different cover crops may influence three major GHGs, Peters et al. (2020) conducted some experiments in 2016 and 2017 to explore these effects. From 2016 to 2017, trace gas fluxes (CO2 and N2O) were measured in between-row (BWR) of maize in crimson clover (CC), cereal rye (CR), LM using white clover, and no cover crop (Tr) systems. CO2 was also measured in-row (IR) of maize among those four treatments. What is meant by BWR or IR is whether the measurement was taken between rows of maize (BWR) or directly in the planted rows of maize (IR). In their study, researchers used a portable infrared gas analyzer (IRGA, 6400XT, Li-Cor) for CO2 and gas chromatography with mass spectrometry (GC-MS) for CO2 and N2O. Peters et al. (2020) found that LM showed both highest CO2 and N2O fluxes in both 2016 and 2017 compared to other treatments. Moreover, significantly higher CO2 fluxes were observed in BWR of maize, where clover was present, than IR of maize in the LM system in 2016. However, they were unable to detect CH4 fluxes due to the detection limit of GC-MS.
In addition to the ecological benefits and mitigation potential provided by cover crops, improving adaptive capacity through the adoption of cover crops could also alleviate the impacts of climate change. Adaptive capacity means that the ability of the agricultural system to maintain crop yields while minimizing nutrient losses when facing climate extremes (Kaye and Quemada, 2017). Concerns regarding lower yields when implementing cover crops compared to conventional cropping may result in a lower rate of adoption (Li et al., 2019). However, an 8-year cover crop study conducted by Olson et al. (2010) reported that average corn and soybean yields were similar comparing with and without cover crops. Complexities regarding the impacts of cover crop on yields also originate from local spatial heterogeneity.
To better understand how the incorporation of different agricultural practices affect three major GHGs and grain yields, we continued our study in 2018 and 2019 but with in-situ measurements, using a cavity ring-down spectroscopy gas analyzer (G2508, Picarro). Our first primary research question was: how do GHG fluxes and grain yields differ among CC, CR, LM, and Tr? Second, under the same technique (LM or Tr), are soil GHG fluxes in IR of maize significantly different from those in BWR? In this study, we compared trace gas fluxes (CO2, N2O, and CH4) and grain yields in three cover crop systems (CC, CR, and LM) and a no cover crop system (Tr) in a no-till maize field over the whole growing season in 2018. In 2019, In order to further explore potential differences for all three major GHGs between IR and BWR of maize, we focused on these measurements for LM and Tr systems and conducted more intensive daily measurements surrounding the two fertilization periods in the early growing season.
Methods
Site Description and Experimental Design
The study site was located at the West Unit of the University of Georgia's J. Phil Campbell Sr. Resource and Education Center in Watkinsville, GA, USA. More details regarding the location of the research station can be found in Peters et al. (2020). This site has been established for agricultural research since 1937 (Melancon, 2014). The classification of the soil is Cecil sandy loam analyzed by soil profile pedology near the research plots. Our experiment in 2018 consisted of twelve 6.1 × 7.3 m plots in no-till maize fields, three each for four treatments: (1) with dead crimson clover (CC) cover crop; (2) with dead cereal rye (CR) cover crop; (3) living much (LM) system, with white clover intercrop; and (4) traditional (no cover crop) system (Tr) with bare soil (Figure 1). Within each plot, three chambers were placed to account for soil heterogeneity. The surface area and volume of the chamber were 0.0182 m2 and 2.92 × 10⁻³ m3, respectively. Each cycle of sample collection consisted of taking CO2, N2O, and CH4 measurements from nine chambers (three chambers per plot from three plots) in BWR of maize over 81 min. We measured the accumulation of trace gases from nine chambers in one cycle using a multiplexer, sampling each chamber for 90 s, and rotating over the nine chambers six times in a cycle. Four cycles were typically used to collect measurements from all chambers on a sampling day. We quantified soil GHG flux weekly over the whole growing season in 2018. The last day of measurement (September 13) was taken after the maize was harvested. We used this day's observation as a baseline value and removed it from significance tests for GHG fluxes. In 2018, CC, CR, and Tr received the same amount of N inputs at the rate of 56 kg ha−1 on April 20. The second fertilizer application took place on May 18 and CC, CR, and Tr received N inputs at the rate of 168, 224, and 224 kg ha−1, respectively. LM did not receive any N inputs.
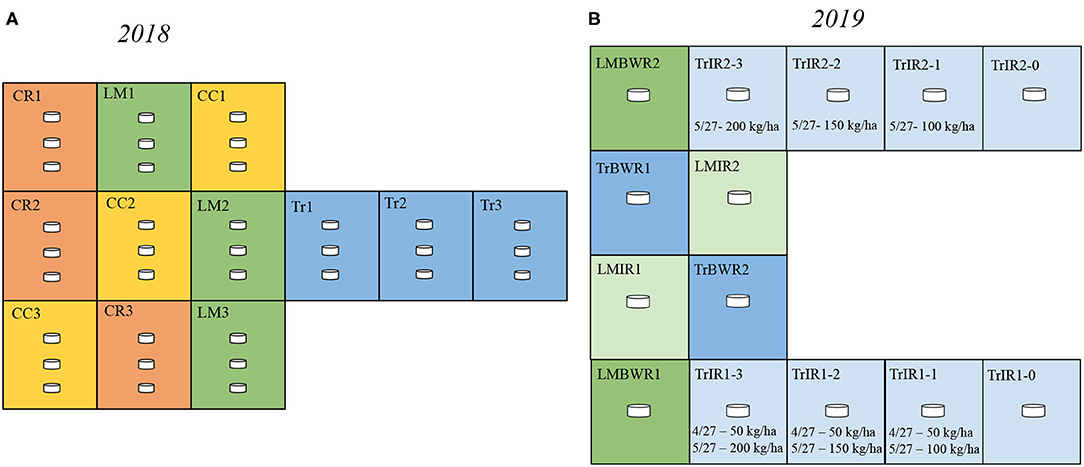
Figure 1. Experimental design in 2018 and 2019. (A) In 2018, our design consisted of three replicate plots of each agricultural practices [crimson clover (CC), yellow; cereal rye (CR), red; living mulch (LM), green; conventional (Tr), blue]. In each plot, there were three chambers. (B) In 2019, our design consisted of 14 plots: two plots for Traditional between-row (TrBWR), Living mulch in-row (LMIR), and Living mulch between-row (LMBWR), (TrBWR, blue; LMIR, light green; LMBWR, green), as well as eight plots for Traditional in-row (TrIR) with varying N fertilizer inputs marked by light blue. Details regarding the N fertilizer amount and dates are labeled.
In 2019, we conducted an intensive field campaign observing daily soil GHG fluxes at an early growing season, with a focus around the two fertilization periods. We measured the accumulation of the same gases under Tr and LM systems, with a focus on comparing the GHG emissions from IR and BWR of maize. We included the following: (a) traditional in row (TrIR); (b) traditional between row (TrBWR); (c) living mulch in row (LMIR); and (d) living mulch between row (LMBWR) (Figure 1). Our experimental setup in 2019 consisted of fourteen plots in no-till maize fields, two each for TrBWR, LMIR, and LMBWR, and remaining eight plots for TrIR. Within each plot, one chamber was established to sample CO2, N2O, and CH4 fluxes. Each cycle of sample collection (84 min total) consisted of taking measurements from seven chambers (four chambers from TrIR and one chamber per plot from three treatments: TrBWR, LMIR, and LMBWR). We measured the accumulation of trace gases from seven chambers in one cycle using a multiplexer. Each chamber was sampled for 60 s, followed by sampling the ambient air through a filter for another 60 s before sampling the next chamber. This sequence was repeated six times in a cycle for all seven chambers. We typically used two cycles to collect measurements from all chambers on a sampling day.
LMIR received N fertilizer at the rate of 35 kg ha−1 on April 27, while both TrBWR and LMBWR did not receive any. For TrIR, eight plots were established to explore GHG flux variations depending on different fertilization amounts and times. TrIR was separated into TrIR1 and TrIR2 with different fertilization rates. In TrIR1, all four paired plots were fertilized twice during our measurement campaign. On April 27, all four plots (TrIR1-0, TrIR1-1, TrIR1-2, and TrIR1-3) received N fertilizer at the rate of 50 kg ha−1. In addition, four plots in TrIR1 also received fertilizer on May 27, ranging from 0 to 200 kg ha−1 (TrIR1-0: 0 kg ha−1; TrIR1-1: 100 kg ha−1; TrIR1-2: 150 kg ha−1; TrIR1-3: 200 kg ha−1). In TrIR2, all four plots only received fertilizer once on May 27, and the rate ranged from 0 to 200 kg ha−1 (TrIR2-0: 0 kg ha−1; TrIR2-1: 100 kg ha−1; TrIR2-2: 150 kg ha−1; TrIR2-3: 200 kg ha−1). Irrigation events occurred on May 3, when 20 mm water was applied to all four treatments to ensure that the soil water content was above 40%. Summarized field events timeline and the stages of corn development can be found in Table 1 and Supplementary Table 1, respectively.
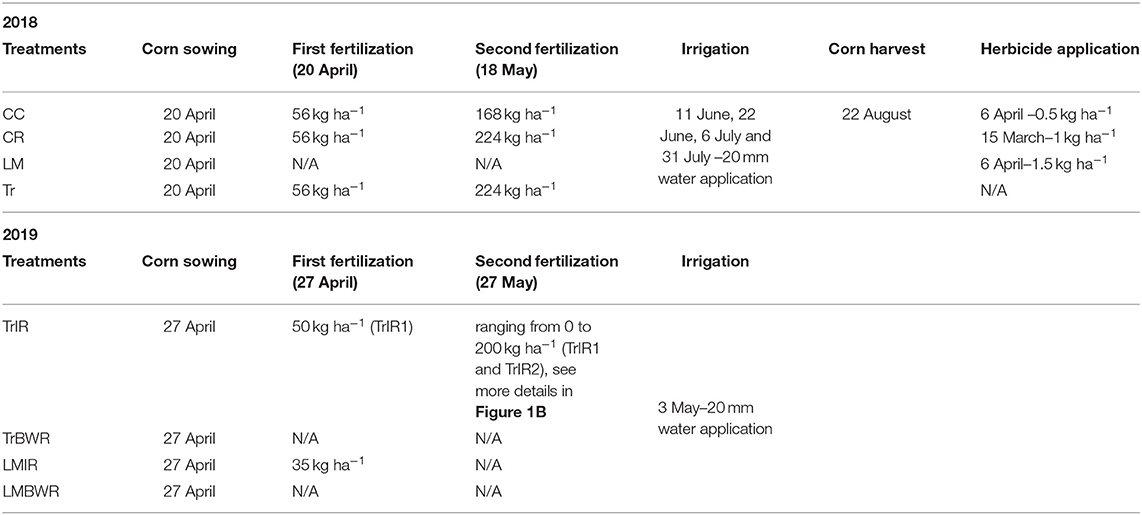
Table 1. Field events timeline.
Soil Sampling and GHG Flux Measurements
We used the G2508 Picarro concentration analyzer to measure the accumulation of trace gases in the chambers. The working principle of Picarro G2508 is based on cavity ring-down spectroscopy (CRDS). CRDS technology utilizes the beam that enters into the ring-down cavity formed by two or more high-reflectivity mirrors (Picarro G2508, Santa Clara, CA, USA, 2021). Three mirrors are used in the Picarro concentration analyzer to sustain the continuous traveling wave. Trace gases such as CO2, N2O, and CH4 have their unique absorption spectrum within the near-infrared range. By measuring the absorption intensity under this wavelength, it can determine the concentration of a specific gas (Picarro G2508, Santa Clara, CA, USA, 2021). CRDS extends the effective path length for absorbing up to several kilometers, and the sensitivity of gas concentration can reach parts per billion level in a few seconds (Picarro G2508, Santa Clara, CA, USA, 2021). With the CRDS technique, Picarro has the capability to measure CO2, N2O, CH4, NH3, and H2O simultaneously and ensures the data collection under high temporal resolution (Picarro G2508, Santa Clara, CA, USA, 2021). We used water-corrected trace gas mixing ratios for analysis.
Other studies have found a relationship between soil GHG fluxes and other variables, such as soil volumetric water content, soil temperature, and total amount of soil C and N (Franzluebbers, 2005; Steenwerth and Belina, 2008; Camarotto et al., 2018). CS 625 reflectometers (Campbell Scientific) were used to measure soil moisture and temperature data. The CS 625 reflectometers were placed at 0–15 cm soil depth in the center of the two center rows of each plot. The length of the rods is 30 cm and the rods were installed at an angle of 45° from the surface. Soil moisture and temperature data were collected at a 10-min interval to calculate hourly averages. Total soil C and N amounts were measured by combusting the soil at 1350°C under aerobic condition to convert C and N to CO2 and N2 in a weekly-manner in May and June and monthly in July and August. Clover biomass and corresponding soil N content were also measured in all LM plots in 2018 to investigate the effects of clover residue decomposition on N2O emission spikes at the late growing season. Meteorological data were obtained from a weather station located near experimental plots. Surface pressure and atmospheric temperature were used to calculate soil GHG flux.
Maize Harvest and Yield
We harvested the yield of maize on Aug 22nd for CC, CR, and LM in 2018. After the maize harvest, we also removed the corn residue from all the plots to ensure the re-seeding of CC and CR and similar soil preparation in each system. In LM system, we also applied pendimethalin at the rate of 1 kg ha−1 after the removal of corn residue for controlling the weed in the winter and allowing the better reestablishment of the white clover during the late summer to the next spring. We harvested maize ears by husking manually from a 3-m segment of the center two maize rows in each plot. We weighed the shelled grain, which was removed by using a mechanical corn sheller after drying the harvested ears at 60°C. The maize yield was calculated by adjusting the moisture at 15%.
Data Analysis
Trace gas flux calculation was carried out using Interactive Data Language (IDL). The mixing ratio (μmol mol−1) of trace gases was first converted, following the Ideal Gas Law (1), where P is surface pressure (atm), R is a gas constant 8.205 × 10⁻⁵ (m3 atm mol−1 K−1), and T is air temperature (°C). Trace gas fluxes (μmol m−2 s−1 or μmol m−2 hr−1) were then calculated by the following equation using the change in a gas mixing ratio over a specific time period (t), where t denotes the time period (s or h), V represents a chamber volume [2.92 × 10⁻³ (m3)], and A represents chamber surface area [0.0182 (m2)], (Collier et al., 2014).
Since CO2 mixing ratio is greater in magnitude, the flux unit of CO2 is calculated in (μmol m−2 s−1), while fluxes of N2O and CH4 are calculated in (μmol m−2 hr−1). Positive surface flux is an indication that soils emit the gas to the atmosphere. When the surface flux is negative, soils serve as a sink, uptaking gas from the atmosphere. The quality of trace gas fluxes data was checked by assessing the linearity of the mixing ratio increase inside the closed chamber. Only measurements with R2 ≥ 0.7 were retained and used in the subsequent statistical analysis (Peters et al., 2020). In 2018, 343, 222, and 323 out of total 343 observations were kept for statistical analysis for CO2, N2O, and CH4, respectively. In 2019, 200 out of total 215 observations were kept for statistical analysis for CO2, N2O, and CH4 fluxes.
Statistics
All the statistical analyses in this study were performed using R 3.6.1 (R Core Team, 2019). Prior to statistical analysis, normality of all fluxes was assessed using Shapiro-Wilks test (Das and Imon, 2016). Mean CO2 flux throughout the whole measuring period in 2018 was transformed by taking the power of −1/2 and mean CO2 flux separated in both early and late growing season in 2018 was transformed by taking the power of −1/3 to meet the normality, as log transformation failed to meet the normality test for both years. ANOVA and Tukey's pairwise comparison was further implemented for transformed CO2 flux to investigate which specific agricultural practices were statistically significantly different in their means. Welch t-test was carried out for CO2 flux in 2019, as well as for N2O and CH4 fluxes due to the failure of meeting normality assumption for all the attempted transformations. The means of CO2, N2O and CH4 fluxes in 2019 were compared to explore whether there were significant differences between two sets of data. GHG fluxes among the four practices were also compared between different time periods. In 2018, we also analyzed soil GHG fluxes from four practices in early and late growing seasons separately. In 2019, we similarly analyzed GHG fluxes in the first and the second fertilization periods separately.
Net carbon equivalent (CE) was calculated and compared among four practices (CC, CR, LM, and Tr) from May 23rd to Aug 16th in 2018, including CO2, N2O and CH4 fluxes generated in the field, soil labile carbon content, as well as CE estimates due to the consumption of fertilizer, irrigation and herbicides (Lal, 2004). For three major GHGs, net CE was calculated by first converting three major GHGs' units from (μmol m−2 s−1 or μmol m−2 hr−1) to (kg ha−1 yr−1). After that, we used global warming potential (GWP) for a 100-year time horizon to standardize three major GHGs' different climate impacts. N2O and CH4 have 273, and 28 times greater GWP compared to CO2, respectively (Smith et al., 2021). In addition, land management practices for agriculture also lead to GHG emissions into the atmosphere. Lal (2004) summarized a range of estimates of CE for different farm operations: 0.9–1.8 kg CE per kg N fertilizer use, 6.3 kg CE per kg herbicides use, and 31–227 kg CE for applying 20 cm water irrigation. We calculated net CO2 eq for N fertilizer and herbicides use (kg) based on the area of our study plots. Each agricultural practice was assumed to occupy an area of 133.59 m2. We did not include the time period from April 22nd to May 18th into calculating the CE because of missing N2O and CH4 fluxes data which were removed based upon failure of meeting R2 ≥ 0.7. To remove the potential impacts of white clover respiration on observed CO2 flux in the LM system, we further subtracted the estimated white clover respiration in LM. We followed the methodology of Peters et al. (2020) and assumed a similar growth rate of white clover as in 2017.
Results
GHG Fluxes in 2018
We calculated fluxes of three major GHGs (CO2, N2O, and CH4) by conducting measurements weekly in BWR of maize from the four different agricultural practices during the maize growing season in 2018 (Figure 2). Similar to the findings in Peters et al. (2020), BWR measurements from LM were observed to produce statistically higher CO2 fluxes compared to CC, CR, and Tr, all at p < 0.001 level. In this study, the other two cover crop systems (CC and CR) also emitted significantly higher CO2 fluxes than Tr (Table 2), which was not observed in Peters et al. (2020). Between leguminous (CC) and non-leguminous (CR) cover crops, CO2 produced were not statistically significantly different (Table 2).
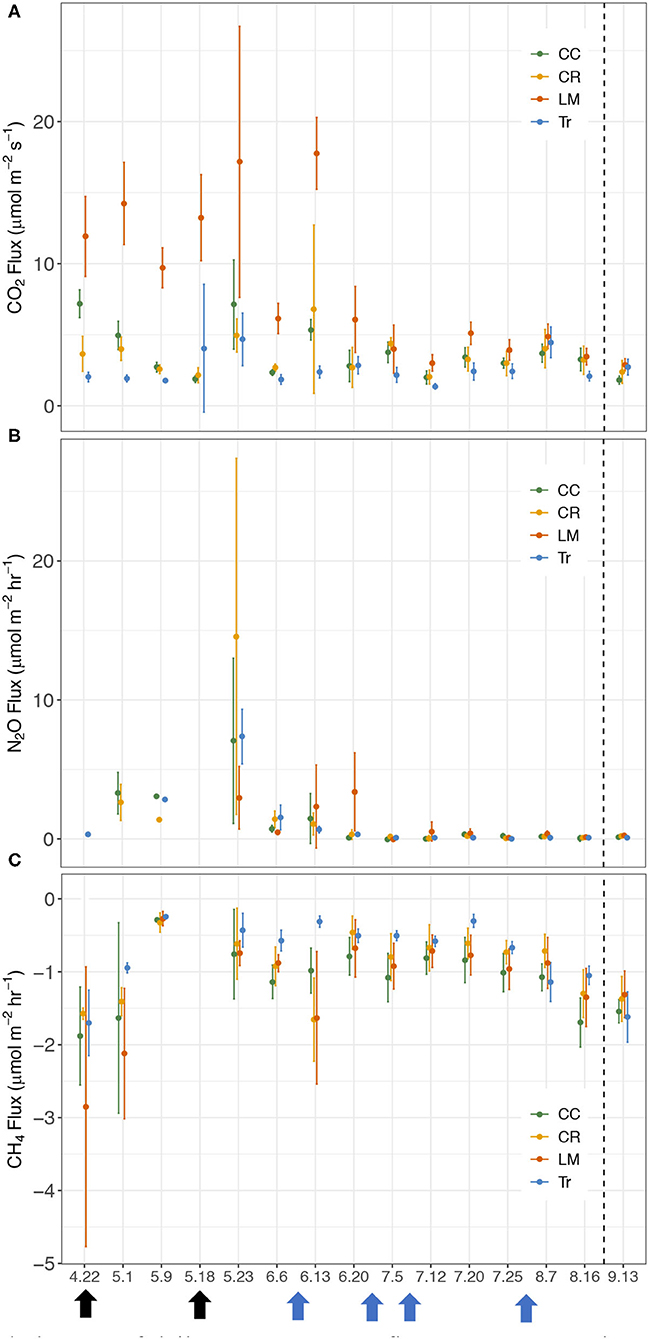
Figure 2. Temporal changes of daily average GHG fluxes between the maize rows in 2018 growing season for crimson clover (CC), cereal rye (CR), white clover living mulch (LM), and conventional (Tr) practices. (A) CO2 (μmol m−2 s−1), (B) N2O (μmol m−2 hr−1), (C) CH4 (μmol m−2 hr−1). Black arrows represent two fertilizer applications (4/22 and 5/18) and blue arrows represent four irrigation events (6/11, 6/22, 7/6, and 7/31).
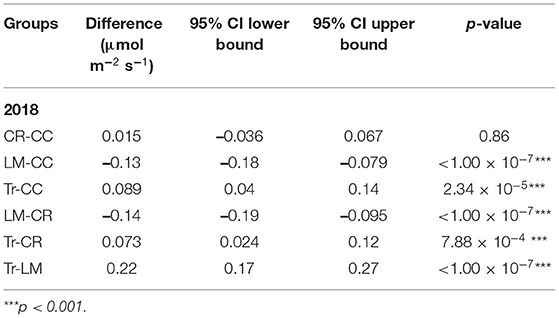
Table 2. Mean transformed CO2 flux (n = 342) group comparisons from four treatments in 2018.
We measured higher overall N2O fluxes from CR (2.07 μmol m−2 hr−1) and N2O flux from Tr increased on May 23rd after receiving fertilizer inputs (Figure 2). Greater fluxes were also observed in LM on June 20th (Figure 2), which was most likely due to the elevated soil N added from the decomposing white clover. In 2018, N2O fluxes from the four practices were not statistically significantly different from each other (Supplementary Table 2). This contradicts the finding from Peters et al. (2020), where LM was found to emit significantly higher N2O fluxes than CC, CR, and Tr in both 2016 and 2017.
Soils in all four systems exhibited as CH4 sinks (Figure 2). Tr showed a significantly lower CH4 uptake rate (−0.65 μmol m−2 hr−1) compared to the other three cover crop systems (Tr-CC: p < 0.001; Tr-CR: p < 0.01; Tr-LM: p < 0.001; Supplementary Table 3). CC (−1.08 μmol m−2 hr−1) and LM (−1.00 μmol m−2 hr−1) served as larger sinks compared to other treatments and the two did not differ significantly (p = 0.43). Comparing CH4 uptake capacity between leguminous (CC) and non-leguminous cover crop (CR), CC served as a significantly larger CH4 sink compared to CR, with the difference of 0.25 μmol m−2 hr−1 (p < 0.01; Supplementary Table 3).
Both CO2 and N2O fluxes were much lower in mid-July and August compared to the earlier period of the growing season (Supplementary Figure 1). On the other hand, soils served as a larger CH4 sink in the latter half of the growing season than in earlier period (Supplementary Figure 1). We thus separated the whole growing season into early (April 22nd–July 5th) and late (July 12th–August 16th) periods to explore GHG flux variations among the four treatments better. During the early period, the average CO2 fluxes in CC, CR, LM, and Tr were 4.07 ± 2.28, 3.67 ± 2.03, 9.93 ± 6.33, and 2.71 ± 1.54 μmol m−2 s−1, respectively (Table 3; Supplementary Figure 1). In the late period, the average CO2 fluxes in CC, CR, LM, and Tr were 2.99 ± 0.83, 3.02 ± 1.08, 3.93 ± 1.02, and 2.56 ± 1.21 μmol m−2 s−1, respectively (Table 3). As found during the whole growing season, the differences between LM and each of the three other agricultural treatments were statistically significantly different in both periods (early: all p < 0.001; late: LM-CC: p < 0.01; LM-CR: p < 0.01; LM-Tr: p < 0.001; Table 4). Moreover, both CC and CR also emitted higher CO2 fluxes than Tr in both periods, as found during the whole growing season (Table 2).
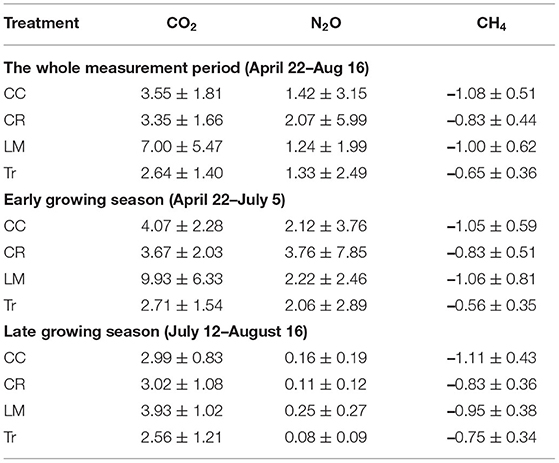
Table 3. Average and standard deviation of trace gas fluxes (CO2: μmol m−2 s−1, N2O and CH4: μmol m−2 hr−1) for four systems throughout the whole measurement period (CO2: n = 342; N2O: n = 222; CH4: n = 323) and both early (CO2: n = 181; N2O: n = 129; CH4: n = 163) and late (CO2: n = 161; N2O: n = 93; CH4: n = 160) growing seasons in 2018.
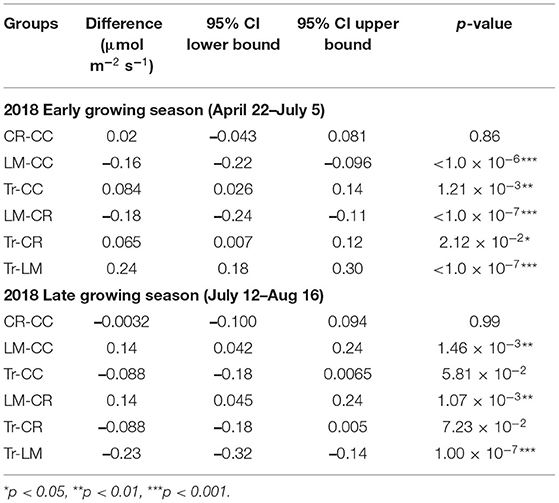
Table 4. Mean transformed CO2 flux group comparisons from four treatments in early (n = 181) and late (n = 161) growing seasons in 2018.
The highest N2O fluxes were measured from the CR system (3.76 μmol m−2 hr−1) during the early growing season and from the LM system (0.25 μmol m−2 hr−1) in the late growing seasons. In the early growing season, we did not observe statistically significant difference in N2O fluxes among four practices (Supplementary Table 4). However, in the late growing season, N2O fluxes in LM were significantly higher than those in CR and Tr (LM-CR: p < 0.05; LM-Tr: p < 0.01; Supplementary Table 4). Differences in N2O fluxes between leguminous cover crop (CC) and non-leguminous cover crop (CR) did not differ significantly in either period (early: p = 0.32; late: p = 0.35; Supplementary Table 4).
Soils in all four treatments functioned as CH4 sinks. In the early growing season, Tr showed lower CH4 uptake rate compared to the other three cover crop systems (CC-Tr: p < 0.001; CR-Tr: p < 0.01; LM-Tr: p < 0.001; Supplementary Table 5). In the late growing season, however, statistically significantly lower CH4 uptake rate in Tr was only observed in comparison with the N-fixing cover crop systems–CC and LM (Supplementary Table 5). Compared to CC and CR, soils in LM were not a larger CH4 sink in either of the early or late growing seasons (Supplementary Table 5). Between leguminous cover crop (CC) and non-leguminous cover crop (CR), a larger CH4 sink was observed in CC compared with CR only in the late growing season (early: CC-CR: p = 0.09; late: CC-CR: p < 0.01; Supplementary Table 5).
From the measurements of the average maize yields in 2018, Hill et al. (2021) reported that similar yields were found for CC (14.73 Mg ha−1) and CR (16.06 Mg ha−1), while statistically significantly lower yields under LM (12.78 Mg ha−1). Achieving both soil health and increased yields remains a challenge. In order to better assess the mitigation potential of different cover crop systems compared to the conventional agricultural system, we also compared four agricultural practices with a net CE. The net CE from CC, CR, LM, and Tr were 32–97, 35–101, 63–139, and 40–106 kg ha−1 yr−1, respectively. After removing the estimated white clover respiration, the net CE from LM was −160–60 kg ha−1 yr−1.
GHG Fluxes in 2019
We conducted an intensive daily measurement campaign surrounding the two fertilization dates (April 27th–May 4th and May 23rd–June 1st) during the early growing season in 2019. Daily GHG fluxes were measured for a week in both BWR of maize and IR of maize from Tr and LM plots (Figure 3). On the first fertilization date (April 27th), LMIR received N fertilizer inputs at the rate of 35 kg ha−1, and three chambers in TrIR1 (TrIR1-1, TrIR1-2, TrIR1-3) also received N fertilizer at the rate of 50 kg ha−1. On the second fertilization period (May 27th), six chambers in TrIR received N fertilizer, ranging from 0 to 200 kg ha−1. LMBWR and TrBWR did not receive any N addition in either period. Higher CO2 and N2O fluxes were observed in the second measurement period compared to the first (Supplementary Figure 2). At the same time, the magnitude of the CH4 sink was also larger in the second period than the first (Supplementary Figure 2). We thus first compared GHG fluxes during the whole measurement period for TrIR, TrBWR, LMIR, and LMBWR, then separated the measurements in 2019 into the first measurement period (April 27th–May 4th) and second (May 23rd–June 1st) to explore how GHG fluxes generated in BWR of maize and IR of maize from Tr and LM plots varied in the two measurement periods.
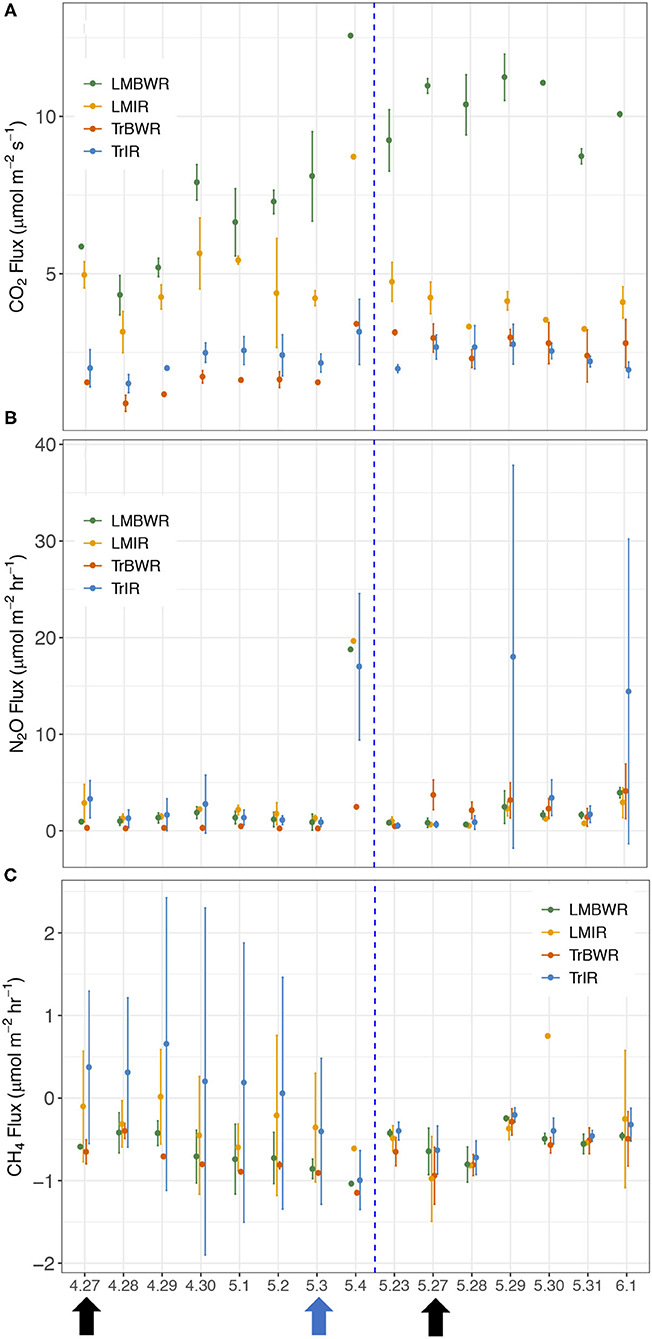
Figure 3. Temporal changes of daily average GHG fluxes between the maize rows in 2019 during early growing season in tradition in row (TrIR), traditional between the row (TrBWR), living mulch in row (LMIR), and living mulch between the row (LMBWR). (A) CO2 (μmol m−2 s−1), (B) N2O (μmol m−2 hr−1), (C) CH4 (μmol m−2 hr−1). Black arrows represent twice fertilizer application (4/27 and 5/27), and blue arrow represents one irrigation event (5/3) during the measurement period.
The highest CO2 fluxes were observed from LMBWR (8.31 μmol m−2 s−1; Table 5), similar to what was reported in Peters et al. (2020) for years 2016 and 2017. Peters et al. (2020) found that in 2016, higher CO2 flux in LM compared to Tr was only observed in BWR of maize, where clover was present but not within rows. However, in 2019, higher CO2 fluxes were observed in both LMIR and LMBWR as compared to TrIR and TrBWR, respectively (both p < 0.001; Table 6). All four (TrIR, TrBWR, LMIR, and LMBWR) showed increased CO2 fluxes during the second fertilization period than the first, especially for LMBWR (Figure 3). The CO2 difference between LMIR and LMBWR was greater after the second fertilization period than the first (first: LMBWR-LMIR: 1.87 μmol m−2 s−1; second: LMBWR-LMIR: 6.26 μmol m−2 s−1; Table 7).
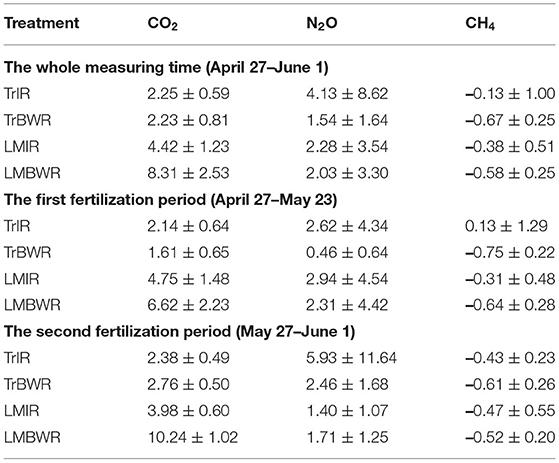
Table 5. Average and standard deviation of trace gas fluxes (CO2: μmol m−2 s−1, N2O and CH4: μmol m−2 hr−1) for four measurements throughout the whole measurement period (n = 200 for all trace gas species) and both first (n = 107 for all trace gas species) and second (n = 93 for all trace gas species) fertilization periods in 2019.
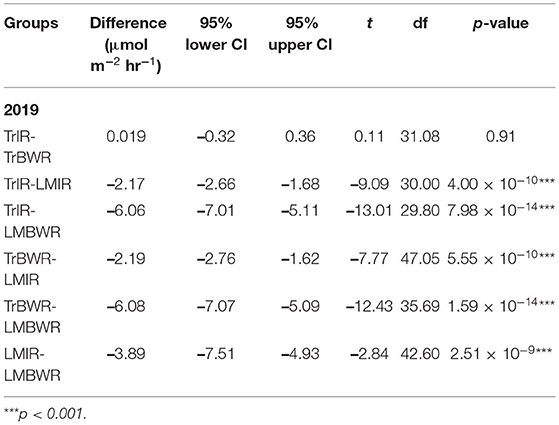
Table 6. Mean CO2 flux Welch t-test (n = 200) between select two measurements in 2019.
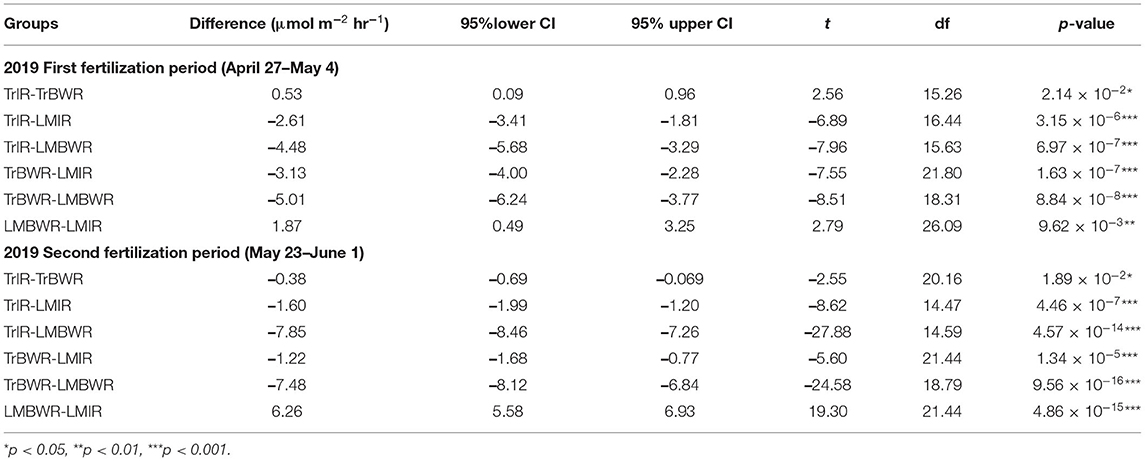
Table 7. Mean CO2 flux Welch t-test between certain two measurements among TrIR, TrBWR, LMIR, and LMBWR in in first (n = 107) and second (n = 93) fertilization periods in 2019.
Throughout the whole measurement period in 2019, we observed the highest average N2O fluxes from TrIR (4.13 μmol m−2 hr−1; Table 5). Peters et al. (2020) observed higher N2O flux in LM compared to Tr in 2016 and 2017. Unlike the previous study, we did not observe the highest N2O fluxes from LMBWR in 2019. The average N2O fluxes generated in both IR and BWR of Tr were higher in the second fertilization period than those in the first, while the opposite was true for the LM system. Around the first fertilization period, the highest average N2O flux was observed in LMIR (2.94 μmol m−2 hr−1), which was however only slightly greater than those in TrBWR (p < 0.05; Supplementary Table 6). Comparing N2O fluxes between IR and BWR, higher N2O fluxes were found in TrIR than in TrBWR in the first fertilization period (p < 0.001; Supplementary Table 6). In the second fertilization period, we observed significantly higher N2O fluxes in TrIR (5.93 μmol m−2 hr−1) compared to TrBWR and LMIR (TrIR-TrBWR: p < 0.05; TrIR-LMIR: p < 0.05; Supplementary Table 6). In LM, IR and BWR measurements did not show significant differences in N2O fluxes generated in neither first nor second fertilization periods (first: LMIR-LMBWR: p = 0.69; second: LMIR-LMBWR: p = 0.50; Supplementary Table 6).
We observed a statistically significantly smaller CH4 sink in TrIR (−0.13 μmol m−2 hr−1; Table 5) compared to TrBWR and LMBWR in 2019 (both p < 0.001; Supplementary Table 7). A statistically significantly larger CH4 sink was observed in TrBWR compared with TrIR in both first and second fertilization periods (early: TrBWR-TrIR: p < 0.001; late: p < 0.05; Supplementary Table 8). However, LMIR and LMBWR only showed statistically significant CH4 flux difference in the first fertilization period (LMIR-LMBWR: −0.33 μmol m−2 hr−1, p < 0.05; Supplementary Table 8).
Discussion
CO2 and N2O Fluxes
We observed statistically significantly higher CO2 fluxes in both LMIR and LMBWR compared with TrIR and TrBWR, respectively. Our findings differ from a previous study, where higher CO2 fluxes were only found in LMBWR compared to TrBWR (Peters et al., 2020). There are two potential reasons explaining why we also observed higher CO2 fluxes in LMIR compared to both TrIR and TrBWR. The first reason is that we conducted our experiment in an intensive daily manner with in-situ measurement, which made it possible to observe the difference better in 2019. The second potential reason is that the soil C and N amount changed in BWR of maize as well as IR of maize after 3-year incorporation of LM in the soil. For example, from observing measurements of soil C and N amount, in 2019, soils in LMIR had a larger C but a lower N during the early growing season when we conducted our measurements (Figure 4). Although white clover is present only in BWR, it is clear that soils in IR of maize were also impacted from the clover presence as the LM soil C content was greater than that in Tr system in 2019.
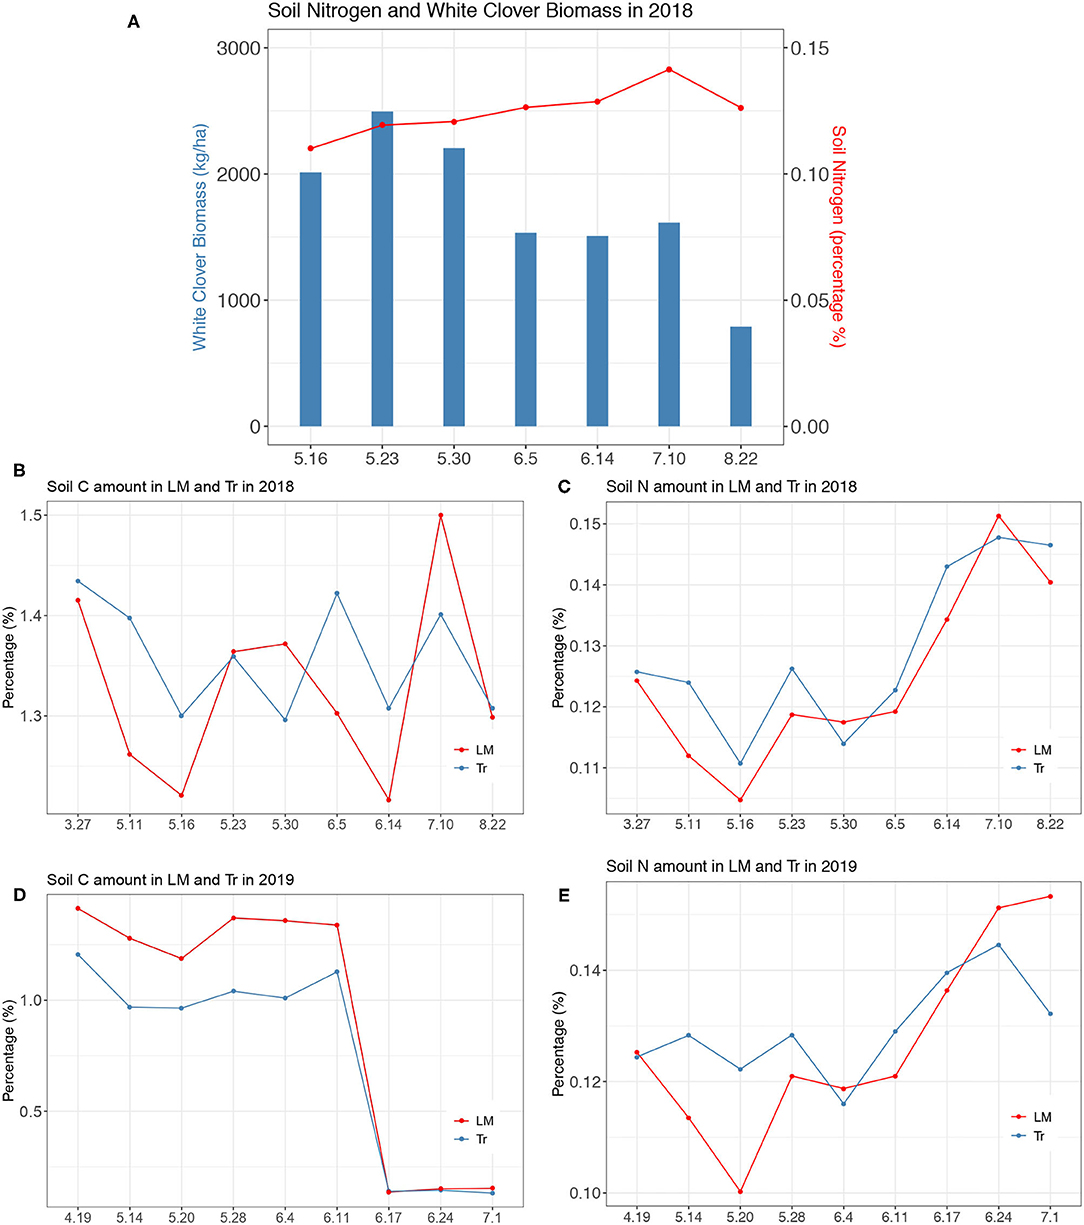
Figure 4. (A) The relationship between soil nitrogen content (percentage %) and white clover biomass (kg ha−1) in 2018, (B) Soil C amount measured in rows of maize under LM and Tr in 2018, (C) Soil N amount measured in rows of maize under LM and Tr in 2018, (D) Soil C amount measured in rows of maize under LM and Tr in 2019, (E) Soil N amount measured in rows of maize under LM and Tr in 2019.
We observed lower average N2O fluxes throughout our measurement period in LM in 2018 compared to the other three treatments (CC, CR, and Tr), which is different from the previous findings. Peters et al. (2020) observed the highest N2O fluxes occurred in the LM system in 2016 and 2017. We did observe an N2O fluxes peak in LM on June 20th, which was likely due to the elevated soil N added as the white clover decomposed. From observing the relationship between the soil N amount and white clover biomass in the soil, the soil N content increased as white clover biomass decreased between the end of May to mid-July in 2018 (Figure 4). At the same time, from June 5th to July 10th is the time when the rate of soil N amount increase is one of the highest under the LM system in 2018 (Figure 4). In 2019, from June 11th to June 24th, the rate of soil N amount increase was one of the highest when we observed the maximum N2O flux generated in LM (Figure 4). Therefore, N2O production in LM might also be associated with the rate of soil N content increase rather than only with the absolute soil N content as we found in 2018.
Greater soil N was observed in Tr than LM from April to the end of May when we conducted measurements (Figure 4). Soil N in LM increased from the end of May to mid-July due to the decomposition of white clover, which corresponded perfectly to the higher N2O flux observed in late June to early July in LM in 2018 (Figure 2). This is similar to what Peters et al. (2020) observed in 2016 and 2017. However, in 2019, since we focused our measurements in the early growing season during fertilization periods, higher N2O fluxes induced by the added N from clover were not observed in LM compared to Tr. As discussed earlier in 2018, even though we conducted measurements throughout the whole growing season, we still did not observe the highest N2O fluxes generated in LM. Despite the lack of N inputs in LM in 2018, the soil N amount in LM was similar to that in Tr from late June to July (Figure 4) and N2O flux levels in both plots did not differ.
Among eight chambers of TrIR in 2019, chambers that received N inputs twice (TrIR1) tended to emit higher CO2 flux than their paired chambers, which only received fertilizer once (TrIR2, Supplementary Figure 3; Supplementary Table 9). For N2O, the chamber with the greatest amount of N inputs emitted the highest N2O fluxes in the second fertilization period (Supplementary Table 9). Among four chambers in either TrIR1 or TrIR2, chambers that received higher amount of N fertilizer inputs emitted higher N2O fluxes (Supplementary Table 9). More results describing GHG fluxes among eight chambers in TrIR could be found in the Supplementary Material. Higher N2O flux in LM from mid-June to July compared to CC and CR in 2018 could also be related to greater mineralizable C in the soil. Mineralizable C is used as a substrate to stimulate N2O fluxes generated from the denitrification process (Mitchell et al., 2013). From observing the soil C amount measured under LM in 2018, from June 14th to July 10th, the rate of soil C amount increase is one of the highest when we observed the maximum N2O flux on June 20th (Figure 4). Comparing CO2 and N2O fluxes between leguminous (CC) and non-leguminous cover crops (CR), no significant difference was observed between those two from observations in 2018. However, studies suggest that cover crops with N fixing ability tend to increase the amount of soil inorganic C, whereas cover crops with no N fixing ability leads to N immobilization (Schmatz et al., 2020).
CH4 Fluxes
Soils in cover crop systems were observed as larger CH4 sinks compared to Tr in 2018. This could result from fewer N inputs under cover crop systems compared to Tr. The addition of N fertilizer could increase the amount, hence reducing the CH4 oxidation capacity of the soil, as found in previous study (Boeckx et al., 1996). The similarity in physical properties of and CH4 molecules allow them to compete for binding sites in the Methane Monooxygenase (MMO) enzyme. inhibition effects refer to the fact that , which serves as a more aggressive competing substrate, can inhibit the CH4 oxidation process (Gulledge et al., 1997). Among three cover crop systems, slightly lower CH4 consumption in CR potentially resulted from its higher C/N ratio due to its inability to fix N. CR most likely had a higher soil C amount, which may have stimulated CH4 fluxes under anaerobic conditions (Le Mer and Roger, 2001). Future studies should include measurements of soil and soil C/N ratio to further investigate their impacts on CH4 uptake ability.
Intensive land management activities could also influence the CH4 uptake ability. In 2018, decreasing CH4 uptake occurred from April 22nd to early May, suggesting that soil disturbance event, such as planting maize and increased N inputs from fertilizer during this time affected the role of soil as absorbing CH4 (Conrad and Rothfuss, 1991; Bronson and Mosier, 1994; Dunfield and Knowles, 1995). In 2019, a higher CH4 sink from BWR than IR was observed under both LM and Tr systems. This indicates that higher soil N in the IR may have inhibited CH4 uptake and resulted in a smaller CH4 sink. However, instead of being the largest CH4 sink, TRIR2-0, the chamber which did not receive any N inputs, served as the smallest CH4 sink among the eight chambers in TrIR. Furthermore, chambers that received higher levels of N fertilizers tended to be larger CH4 sinks than those that received lower N. Additional experiments are needed to better understand what fertilization pattern enhances soil CH4 sink potential so that mitigation strategy can be considered in agriculture.
One limitation of our study is the lack of soil microbial data. Including soil microbial measurements would have added insights in understanding GHG fluxes variations that occurred between cover crop systems and the conventional agricultural system. In order to better understand the live clover impacts on GHG emissions, both long-term soil GHG observation and microbial level laboratory studies are needed. From the results of this study, we observed increased soil CO2 fluxes also from LMIR, which comes from the accelerated decomposition of native soil due to clover incorporation. Studies have shown that incorporating fresh organic matter such as clover residue could stimulate mineralization of soil organic matter, which is named as priming effect (Bingeman, 1952; Fontaine et al., 2003). Priming effect depends on both the biomass and microbial amounts in the soil (Camarotto et al., 2018). For example, incorporating biomass with high C/N ratio into the soil would accelerate the decomposition by microorganisms to acquire more N in the soil (Camarotto et al., 2018). Meanwhile, studies conducted by Chen et al. (2015) suggest that addition of residue could formulate a more diverse microbial community and lead to stronger priming effects, which potentially results in increased CO2 fluxes observed under cover crops, as found in this study. Future studies should also investigate the microbial mechanism of priming effects induced by cover crop residues. Moreover, soil parameters were only collected as total C and total N amounts in our study. Future studies should also include the measurements of both particulate and mineral soil organic matter types under different cover crop systems. Different types of soil organic matter measurements could better evaluate the type of organic matter added to the soil by cover crops, their susceptibility to further decomposition and CO2 and N2O emissions. A more comprehensive N budget should also be included in future studies to better evaluate the mitigation potential comparison between legume and non-legume cover crops. Reducing GHG emissions from agriculture is complex since the success of realizing mitigation potential through cover crop establishment is site-specific. Spatial heterogeneity acts as barriers to wider adoption of cover crops regarding different local conditions. There is no one-size-fits all solution, and future studies still need to fully evaluate both locally and globally about barriers and opportunities for successful cover crop implementation.
Practicality of Cover Crops
Crop yields and associated economic returns typically have a larger impact on the farmers' decision to implement cover crops than the potential reduction of GHG emissions. Even though maize yields under LM system were lower than CC and CR in 2018, the evaluation of economic impact of cover crops at a farm level should also include other factors as well. Gabriel et al. (2013) found that incorporating cover crops brought extra expense in establishment, seed, and killing, although there were potential savings from reduced fertilizer use. Selling the biomass of the cover crops as animal feed could bring additional savings as well. For example, from the case study conducted by Gabriel et al. (2013) in Spain, the extra cost of incorporating vetch as a cover crop was 71.65 € ha−1 but if the biomass of vetch was collected and sold as forage, the extra cost of the cover crops was reduced to 31.63 € ha−1. The spatial heterogeneity also makes the economic analysis of cover crop a challenging endeavor as it also depends on product and commodity prices. A comprehensive economic analysis is essential in order to provide a better reference regarding cover crop practicality with farmers.
Even though we witnessed reduced maize yields under the LM system in 2018, conflicting studies exist regarding the impacts of cover crop on grain yields. A review by Abdalla et al. (2019) reported that grain yields were reduced by 4% under cover crop systems as compared to the control treatment. However, a case study conducted in Spain showed that the yields of maize were two times higher after adopting cover crops than in fallow (Kaye and Quemada, 2017). Grain yields were also found to vary between legume and non-legume cover crops. For example, similar yields of cash crop were found under non-legume cover crop treatment compared to the control treatment. In contrast, Finney et al. (2016) found that adopting legume cover crop could increase the yields by 5–30%. Long-term studies are needed to better explore the impacts of cover crops on yields. It is also possible that the positive effects of the restored soil health on crop yields are more pronounced as the time of mulch incorporation increases.
Conclusion
This study finds that in addition to soil and water quality improvement, increased soil C storage, and reduced soil erosion and nitrate leaching, the implementation of cover crops can add another benefit for mitigating climate change, stemming from the larger CH4 sink potential of the soils under this agricultural practice. When we subtracted a rough estimate of white clover respiration from the LM system, the net CE turned out to be the lowest of all practices. In order to assess climate change mitigation potential from agriculture, it is important to analyze the three GHG fluxes holistically and understand the impacts of different practices in more detail. The economic returns also need to be quantified, as reduced fertilizer and herbicide costs could be substantial when implementing the LM system at a farm scale. Long-term studies are essential to better assess the practicality of cover crops in terms of crop yields, economic impacts, and climate mitigation potential.
Data Availability Statement
The raw data supporting the conclusions of this article will be made available by the authors, without undue reservation.
Author Contributions
ES and AA conceptualized the study and conducted field experiment. ES and NH obtained funding. YW analyzed the data and wrote the draft with ES. Everyone reviewed the manuscript and helped in revision. All authors have given approval to the final version of the manuscript.
Funding
This research was supported by the United States Department of Agriculture, National Institute of Food and Agriculture Foundation Program (No. 2018-67013-27401) and Emory University Research Committee grant.
Conflict of Interest
The authors declare that the research was conducted in the absence of any commercial or financial relationships that could be construed as a potential conflict of interest.
Publisher's Note
All claims expressed in this article are solely those of the authors and do not necessarily represent those of their affiliated organizations, or those of the publisher, the editors and the reviewers. Any product that may be evaluated in this article, or claim that may be made by its manufacturer, is not guaranteed or endorsed by the publisher.
Acknowledgments
We would like to thank Jill Mullican for providing us with the soil data and Samuel Peters, Benjamin Yosen, and Ken Wakabayashi for helping collect trace gas fluxes data in 2018. Their contribution helped us understand the results in depth.
Supplementary Material
The Supplementary Material for this article can be found online at: https://www.frontiersin.org/articles/10.3389/fclim.2021.742320/full#supplementary-material
References
Abdalla, M., Hastings, A., Cheng, K., and Yue, Q. (2019). A critical review of the impacts of cover crops on nitrogen leaching, net greenhouse gas balance and crop productivity. Glob. Change Biol. 25, 2530–2543. doi: 10.1111/gcb.14644
Andrews, J. S., Sanders, Z. P., Cabrera, M. L., Saha, U. K., and Hill, N. S. (2018). Nitrogen dynamics in living mulch and annual cover crop corn production systems. Agron. J. 110, 1309–1317. doi: 10.2134/agronj2017.10.0609
Basche, A. D., Miguez, F. E., Kaspar, T. C., and Castellano, M. J. (2014). Do cover crops increase or decrease nitrous oxide emissions? A meta-analysis. J. Soil Water Conserv. 69, 471–482. doi: 10.2489/jswc.69.6.471
Bingeman, C. W. (1952). The effect of the addition of organic materials on the decomposition of an organic soil (dissertation). Ohio State University, Columbus, OH, United States.
Blanco-Canqui, H., Shaver, T., Lindquist, J., Shapiro, C., Elmore, R., Francis, C., et al. (2015). Cover crops and ecosystem services: insights from studies in temperate soils. Agron. J. 107, 2449–2474. doi: 10.2134/agronj15.0086
Boeckx, P., Van Cleemput, O., and Villaralvo, I. (1996). Methane emission from a landfill and the methane oxidising capacity of its covering soil. Soil Biol. Biochem. 28, 1397–1405. doi: 10.1016/S0038-0717(96)00147-2
Bronson, K. F., and Mosier, A. R. (1994). Suppression of methane oxidation in aerobic soil by nitrogen fertilizers, nitrification inhibitors, and urease inhibitors. Biol. Fertil. Soils. 17, 263–268. doi: 10.1007/BF00383979
Camarotto, C., Dal Ferro, N., Piccoli, I., Polese, R., Furlan, L., Chiarini, F., et al. (2018). Conservation agriculture and cover crop practices to regulate water, carbon and nitrogen cycles in the low-lying Venetian plain. Catena. 167, 236–249. doi: 10.1016/j.catena.2018.05.006
Chen, S. T., Wang, Y. Y., Hu, Z. H., and Gao, H. (2015). CO2 emissions from a forest soil as influenced by amendments of different crop straws: implications for priming effects. Catena 131, 56–63. doi: 10.1016/j.catena.2015.03.016
Collier, S. M., Ruark, M. D. G, Oates, L. G., Jokela, W. E., and Dell, C. J. (2014). Measurement of greenhouse gas flux from agricultural soils using static chambers. J. Vis. Exp. 90, 1–8. doi: 10.3791/52110
Conrad, R., and Rothfuss, F. (1991). Methane oxidation in the soil surface layer of a flooded rice field and the effect of ammonium. Biol. Fertil. Soils 12, 28–32. doi: 10.1007/BF00369384
Das, K. R., and Imon, A. H. M. R. (2016). A brief review of tests for normality. J. Theor. Appl. Stat. 5:5. doi: 10.11648/j.ajtas.20160501.12
Dunfield, P., and Knowles, R. (1995). Kinetics of inhibition of methane oxidation by nitrate, nitrite, and ammonium in a humisol. Appl. Environ. Microbiol. 61, 3129–3135. doi: 10.1128/aem.61.8.3129-3135.1995
Dyer, L., Oelbermann, M., and Echarte, L. (2012). Soil carbon dioxide and nitrous oxide emissions during the growing season from temperate maize-soybean intercrops. J. Plant Nutr. Soil Sci. 175, 394–400. doi: 10.1002/jpln.201100167
FAO (2013). Climate-Smart Agriculture Sourcebook. Available online at: http://www.fao.org/docrep/018/i3325e/i3325e.pdf (accessed June 13, 2021).
Finney, D. M., White, C. M., and Kaye, J. P. (2016). Biomass production and carbon/nitrogen ratio influence ecosystem services from cover crop mixtures. Agron. J. 108, 39–52. doi: 10.2134/agronj15.0182
Fontaine, S., Mariotti, A., and Abbadie, L. (2003). The Priming effect of organic matter: a question of microbial competition? Soil Biol. Biochem. 35, 837–843. doi: 10.1016/S0038-0717(03)00123-8
Franzluebbers, A. J. (2005). Soil organic carbon sequestration and agricultural greenhouse gas emissions in the southeastern USA. Soil Tillage Res. 83, 120–47. doi: 10.1016/j.still.2005.02.012
Gabriel, J. L., Garrido, A., and Quemada, M. (2013). Cover crops effect on farm benefits and nitrate leaching: linking economic and environmental analysis. Agric. Syst. 121, 23–32. doi: 10.1016/j.agsy.2013.06.004
Gomes, J., Bayer, C., Costa, F. D. S., Piccolo, M., Acordi Zanatta, J. A., Vieira, F. C. B. V., et al. (2009). Soil nitrous oxide emissions in long-term cover crops-based rotations under subtropical climate. Soil Tillage Res. 106, 36–44. doi: 10.1016/j.still.2009.10.001
Guardia, G., Abalos, D., García-Marco, S., Quemada, M., Alonso-Ayuso, M., Cárdenas, L. M., et al. (2016). Effect of cover crops on greenhouse gas emissions in an irrigated field under integrated soil fertility management. Biogeosciences 13, 5245–5257. doi: 10.5194/bg-13-5245-2016
Guenet, B., Gabrielle, B., Chenu, C., Arrouays, D., Jérôme Balesdent, J., Bernoux, M., et al. (2021). Can N2O emissions offset the benefits from soil organic carbon storage?” Glob. Chang. Biol. 27, 237–256. doi: 10.1111/gcb.15342
Gulledge, J., Doyle, A. P., and Schimel, J. P. (1997). Different -inhibition patterns of soil CH4 consumption: a result of distinct CH4-oxidizer populations across sites. Soil Biol. Biochem. 29, 13–21. doi: 10.1016/S0038-0717(96)00265-9
Hanrahan, B. R., and Mahl, U. (2018). Winter cover crops reduce nitrate loss in an agricultural watershed in the central U.S. Agric. Ecosyst. Environ. 265, 513–523. doi: 10.1016/j.agee.2018.07.004
Hill, N. S., Levi, M., Basinger, N., Thompson, A., Cabrera, M., Wallace, J., et al. (2021). White clover living mulch enhances soil health vs. annual cover crops. Agron. J. 113, 3697–3707. doi: 10.1002/agj2.20768
Jarecki, M. K., Parkin, T. B., Chan, A. S. K., Kaspar, T. C., Moorman, T. B., Singer, J. W., et al. (2009). Cover crop effects on nitrous oxide emission from a manure-treated mollisol. Agric. Ecosyst. Environ. 134, 29–35. doi: 10.1016/j.agee.2009.05.008
Kaye, J. P., and Quemada, M. (2017). Using cover crops to mitigate and adapt to climate change. A review. Agron. Sustain. Dev. 37:4. doi: 10.1007/s13593-016-0410-x
Kim, S. Y., Gutierrez, J., and Kim, P. J. (2012). Considering winter cover crop selection as green manure to control methane emission during rice cultivation in paddy soil. Agric. Ecosyst. Environ. 161, 130–136. doi: 10.1016/j.agee.2012.07.026
Lal, R. (2004). Carbon emission from farm operations. Environ. Int. 30, 981–990. doi: 10.1016/j.envint.2004.03.005
Le Mer, J., and Roger, P. (2001). Production, oxidation, emission and consumption of methane by soils: a review. Eur. J. Soil Biol. 37, 25–50. doi: 10.1016/S1164-5563(01)01067-6
Li, M., Peterson, C. A., Tautges, N. E., Scow, K. M., and Gaudin, A. C. M. (2019). Yields and resilience outcomes of organic, cover crop, and conventional practices in a Mediterranean climate. Sci. Rep. 9:12283. doi: 10.1038/s41598-019-48747-4
Lu, Y. H., Wassmann, R., Neue, H. U., and Huang, C. Y. (2000). Dissolved organic carbon and methane emissions from a rice paddy fertilized with ammonium and nitrate. J. Environ. Qual. 29, 1733–1740. doi: 10.2134/jeq2000.00472425002900060002x
Melancon, J. M. (2014). Research and Education Center Set to Continue Legacy in Sustainable agriculture. UGATODAY. Available online at: https://news.uga.edu/phil-j-campbell-sr-research-and-education-center-set-to-continue-legac/ (accessed June 17, 2021).
Mitchell, D. C., Castellano, M. J., Sawyer, J. E., and Pantoja, J. (2013). Cover crop effects on nitrous oxide emissions: role of mineralizable carbon. Soil Sci. Soc. Am. J. 77, 1765–1773. doi: 10.2136/sssaj2013.02.0074
Olson, K. R., Ebelhar, S. A., and Lang, J. M. (2010). Cover crop effects on crop yields and soil organic carbon content. Soil Sci. 175, 89–98. doi: 10.1097/SS.0b013e3181cf7959
Paustian, K., Lehmann, J., Ogle, S., Reay, D., Robertson, G. P., and Smith, P. (2016). Climate-smart soils. Nature 532, 49–57. doi: 10.1038/nature17174
Peters, S. J., Saikawa, E., Markewitz, D., Sutter, L., Avramov, A., Sanders, Z. P., et al. (2020). Soil trace gas fluxes in living mulch and conventional agricultural systems. J. Environ. Qual. 49, 268–280. doi: 10.1002/jeq2.20041
Picarro G2508 Santa Clara, CA, USA. (2021). G2508 Gas Concentration Analyzer. Available online at: https://www.picarro.com/g2508_gas_concentration_analyzer?language=en (accessed June 17, 2021).
Sanz-Cobena, A., García-Marco, S., Quemada, M., Gabriel, J. L., Almendros, P., and Vallejo, A. (2014). Do cover crops enhance N2O, CO2 or CH4 emissions from soil in Mediterranean arable systems? Sci. Total Environ. 466–467, 164–174. doi: 10.1016/j.scitotenv.2013.07.023
Schmatz, R., Recous, S., Adams Weiler, D., Elias Pilecco, G., Adriane Luiza Schu, A., Lago Giovelli, R., et al. (2020). How the mass and quality of wheat and vetch mulches affect drivers of soil N2O emissions. Geoderma 372:114395. doi: 10.1016/j.geoderma.2020.114395
Schomberg, H. H., Endale, D. M., Calegari, A., Peixoto, R., Miyazawa, M., and Cabrera, M. L. (2006). Influence of cover crops on potential nitrogen availability to succeeding crops in a southern piedmont soil. Biol. Fertil. Soils. 42, 299–307. doi: 10.1007/s00374-005-0027-8
Smith, C., Nicholls, Z. R. J., Armour, K., Collins, W., Forster, P., Meinshausen, M., et al. (2021). “The earth's energy budget, climate feedbacks, and climate sensitivity supplementary material,” in Climate Change 2021: The Physical Science Basis. Contribution of Working Group I to the Sixth Assessment Report of the Intergovernmental Panel on Climate Change, eds V. Masson-Delmotte, P. Zhai, A. Pirani, S. L. Connors, C. Péan, S. Berger, et al. (New York, NY: IPCC). Available online at: https://www.ipcc.ch/
Smith, M. S., and Tiedje, J. M. (1979). Phases of denitrification following oxygen depletion in soil. Soil Biol. Biochem. 11, 261–267. doi: 10.1016/0038-0717(79)90071-3
Steenwerth, K., and Belina, K. M. (2008). Cover crops and cultivation: impacts on soil n dynamics and microbiological function in a mediterranean vineyard agroecosystem. Appl. Soil Ecol. 40, 370–380. doi: 10.1016/j.apsoil.2008.06.004
Turner, P. A., Baker, J. M., Griffis, T. J., and Venterea, R. T. (2016). Impact of kura clover living mulch on nitrous oxide emissions in a corn-soybean system. J. Environ. Qual. 45, 1782–1787. doi: 10.2134/jeq2016.01.0036
Keywords: climate change, soil greenhouse gas (GHG), cover crop, crimson clover, cereal rye, living mulch system
Citation: Wang Y, Saikawa E, Avramov A and Hill NS (2022) Agricultural Greenhouse Gas Fluxes Under Different Cover Crop Systems. Front. Clim. 3:742320. doi: 10.3389/fclim.2021.742320
Received: 16 July 2021; Accepted: 30 September 2021;
Published: 04 January 2022.
Edited by:
Yuanjian Yang, Nanjing University of Information Science and Technology, ChinaReviewed by:
Felix Leung, The Chinese University of Hong Kong, ChinaLinlin Wang, Institute of Atmospheric Physics (CAS), China
Copyright © 2022 Wang, Saikawa, Avramov and Hill. This is an open-access article distributed under the terms of the Creative Commons Attribution License (CC BY). The use, distribution or reproduction in other forums is permitted, provided the original author(s) and the copyright owner(s) are credited and that the original publication in this journal is cited, in accordance with accepted academic practice. No use, distribution or reproduction is permitted which does not comply with these terms.
*Correspondence: Eri Saikawa, eri.saikawa@emory.edu