


Abstract
To examine job satisfaction, well-being, job stress, and burnout among laboratory professionals.
The study utilized a cross-sectional survey design. The survey was administered online via the American Society for Clinical Pathology’s survey tool, to elicit information about job satisfaction, well-being, job stress, and burnout among medical laboratory professionals.
Although this survey shows high job satisfaction among respondents, overall job-related stress is high and burnout is prevalent. The majority of the respondents rated their work-life balance as “fair.” The main contributing factors to job stress, burnout, and work-life balance are quantity of workload and understaffing.
Based on the results of this survey, creating targeted interventions may help improve the quality of well-being programs for laboratory professionals. A comprehensive wellness program developed at the institutional, local, and national levels may improve morale and alleviate the recruitment and retention challenges faced by medical laboratory professionals.
Medical laboratory practitioners (which includes pathologists, laboratory professionals, and pathology residents) are critical members of the health care team. Their work impacts almost every aspect of patient care, from diagnosis to prevention and primary care.1 They also play a vital role in improving patient outcomes, promoting effective test utilization, ensuring laboratory quality, and public health.1 With the passage of health reform legislation, there has been an increased focus on patient-centered care and the value of the patient experience, which has led to an expectation that caregivers be positively engaged in their work and able to do their jobs efficiently and effectively in a supportive environment.2 This has led to a significant increase in research on job satisfaction, well-being, and burnout in the health care sector.
At present, however, extensive data and research on these topics have mainly focused on physicians and nurses. A study conducted by Dyrbye et al3 indicates that understanding factors that affect physician career satisfaction is vital because it correlates with patient satisfaction and quality of care. Understanding well-being, burnout, and job satisfaction among laboratory practitioners is equally important because this group is very diverse; it comprises pathologists and residents with various subspecialties, as well as more than 15 types of laboratory professionals that ultimately affect patient care.4
To date, there has not been a comprehensive national study that has evaluated the job satisfaction, stress, burnout, and work-life balance of laboratory professionals. While there is considerable variation in the prevalence of burnout among physicians and medical personnel, amid a wide range of operationalizations used in individual studies and other contributing factors, one of the common themes is an indication that concerns are widespread.5 Most of the existing research is out of date and limited to only one group within the field, pathologists. Thus, the purpose of this survey was to examine these factors among laboratory professionals. The survey had three objectives: to provide data on job satisfaction, well-being, and burnout among laboratory professionals; to determine factors that affect job satisfaction, well-being, and burnout among laboratory professionals; and to offer recommendations to promote well-being and prevent burnout among laboratory professionals.
Materials and Methods
The study utilized a cross-sectional survey design. The survey was administered online via Key Survey to elicit information about job satisfaction, well-being, and burnout among medical laboratory professionals. This study was reviewed and approved by the institutional review board of the University of Nebraska Medical Center (No. 632-18-EX).
Study Population
Email invitations to complete the survey online were sent to American Society for Clinical Pathology (ASCP) members, technologists/technicians, and laboratory managers/supervisors from the ASCP membership database in October 2018. To maximize participation, the survey used snowball sampling, in which respondents were asked to forward the survey invitation e-mail to other individuals currently practicing in the field. The survey closed in December 2018.
Measures
Developed from a review of peer-reviewed literature on research studies that explored the level of job satisfaction, well-being, and burnout among medical professionals, the survey targeted a wide array of indicators and measures of job satisfaction, job stress, burnout, and mental and emotional well-being. Definition of burnout was derived from established burnout instruments and used in the survey questionnaire.6,7 Burnout was defined as “feeling overwhelmed, feeling emotionally exhausted, not caring about work, and feeling a low sense of value or accomplishment.” 6,7
Survey development began with discussions among a steering committee of laboratory professionals and pathologists, as well as a review of peer-reviewed literature on job satisfaction and burnout among medical personnel. Survey items were subsequently crafted from these discussions and derived from existing instruments.6-,13 Job satisfaction, job stress, burnout, and general well-being were assessed, including prevalence of stress and burnout as well as their main sources and contributing factors, prevalence of work-life balance and well-being, and how satisfied are laboratory professionals with their job.
Results
This survey presents data from 4,613 laboratory professionals across the United States. The respondents’ demographics are shown in Table 1. Respondents are predominantly female and white, with an average age of 45 years. Distribution of respondents by age group shows that most of the respondents are between the ages of 55 and 64 years (Table 1). Respondents have worked in the field for an average of 18.2 years and have been in their current position for an average of 11.1 years (Table 1). Medical technologist (MT)/medical laboratory scientist (MLS)/clinical laboratory scientist (CLS) comprise the largest occupational group at 60.2% Table 2.
Demographics and Sample Characteristics
| Characteristic | No. (%) |
|---|---|
| Gender | |
| Female | 3,818 (83.3) |
| Male | 756 (16.5) |
| Other | 12 (0.2) |
| Ethnicity | |
| White | 3,665 (80.2) |
| Asian or Pacific Islander | 328 (7.2) |
| Hispanic or Latino | 242 (5.3) |
| Black or African American | 214 (4.7) |
| Other | 96 (2.1) |
| Native American | 24 (0.5) |
| Age group, y | |
| 18-24 | 122 (2.7) |
| 25-34 | 1,085 (24.0) |
| 35-44 | 948 (21.1) |
| 45-54 | 929 (20.6) |
| 55-64 | 1,266 (28.1) |
| 65-74 | 151 (3.4) |
| Mean age, y (SD) | 45.3 (±12.7) |
| Age range, y | 19.0-76.0 |
| Total No. of years as a laboratory professional, mean | 18.2 |
| Years in current position, mean | 11.1 |
Total Number of Responses by Occupational Title and Percentage Distribution of All Survey Respondents
| Occupational Title | No. (%) |
|---|---|
| Medical technologist (MT)/medical laboratory scientist (MLS)/clinical laboratory scientist (CLS) | 2,776 (60.3) |
| Medical laboratory technician (MLT)/clinical laboratory technician (CLT) | 661 (14.4) |
| Histotechnician (HT) | 159 (3.5) |
| Cytotechnologist (CT) | 152 (3.3) |
| Other | 152 (3.3) |
| Pathologists’ assistant (PA) | 123 (2.7) |
| Cytogenetic technologist (CG) | 107 (2.3) |
| Histotechnologist (HTL) | 99 (2.2) |
| Phlebotomist (PBT) | 96 (2.1) |
| Specialist in blood banking (SBB) | 81 (1.8) |
| Molecular biologist (MB) | 60 (1.3) |
| Performance improvement/quality assurance (PI/QA) | 44 (1.0) |
| Clinical laboratory assistant (CLA)/medical laboratory assistant (MLA) | 39 (0.8) |
| Point-of-care testing personnel (POCT) | 35 (0.8) |
| Laboratory information system personnel (LIS) | 20 (0.4) |
The types of facilities and departments where the participants are primarily employed are shown in Table 3. Respondents are mainly from South Central Atlantic states (Alabama, Delaware, District of Columbia, Florida, Georgia, Kentucky, Maryland, Mississippi, North Carolina, South Carolina, Tennessee, Virginia, and West Virginia). Also, most of the respondents are located in urban areas.14
Percentage of Respondents by Facility and Percentage of Respondents by Departmenta
| Category | % |
|---|---|
| Facility | |
| Academic hospital with 500 or more beds | 18.7 |
| Nonacademic hospital with 100-299 beds | 13.1 |
| Nonacademic hospital with fewer than 100 beds | 10.1 |
| Academic hospital with 300-499 beds | 9.6 |
| Nonacademic hospital with 300-499 beds | 7.8 |
| Academic hospital with 100-299 beds | 6.7 |
| Nonacademic hospital with 500 or more beds | 3.8 |
| Physician’s office laboratory | 3.7 |
| Outpatient clinic laboratory | 3.5 |
| National reference laboratory/independent laboratory | 3.3 |
| Local reference laboratory/independent laboratory | 2.7 |
| Military facility, Veteran’s Administration, Veterans Health Administration | 2.6 |
| Regional reference laboratory/independent laboratory | 2.3 |
| Government facility | 2.0 |
| Academic hospital with fewer than 100 beds | 1.9 |
| Blood center or blood bank | 1.7 |
| Pathologists’ laboratory/private laboratory | 1.6 |
| Industry | 0.4 |
| Retail laboratory (direct to consumer) | 0.2 |
| Department | |
| Hematology/coagulation | 40.7 |
| Chemistry/toxicology | 39.1 |
| Blood bank (immunohematology) | 33.3 |
| Microbiology/virology/infectious disease | 29.4 |
| Molecular pathology/diagnostics | 29.4 |
| Core lab | 28.4 |
| Specimen processing | 25.1 |
| Immunology | 19.2 |
| Send outs | 18.6 |
| Phlebotomy | 17.9 |
| Point of care | 12.8 |
| Laboratory information system/quality assurance/ performance improvement | 9.8 |
| Other | 8.2 |
| Anatomic pathology | 6.7 |
| Histology | 6.1 |
| Education | 5.0 |
| Cytology | 4.4 |
| Cytogenetics | 2.4 |
| Flow cytometry | 2.2 |
aGovernment facility includes department of Health, Food and Drug Administration, prison, state hospitals, medical examiners, public health lab, community health centers, and health departments. Physician’s office laboratory includes laboratory located, managed, and operated within a physician practice that provides services for patients of the practice, eg, hematologist/oncologist with small hematology laboratory to do in-house CBCs and differentials. Industry includes chemical suppliers, IVD manufacturers, pharmaceutical companies, and medical device companies. Outpatient clinic laboratory includes laboratory that supports outpatient clinics offering preventative, primary, and urgent care patient services. Pathologists’ laboratory/private laboratory includes laboratory owned or operated by a pathologist or PhD clinical scientist.
Table 4 details the employment characteristics of the survey respondents. Most laboratory professionals are permanent employees with full-time status (88.3%); get paid by shift, hourly, or other time-based payment (73.7%); and work an average of 40.7 hours per week.
Laboratory Professionals’ Employment Characteristics
| Employment Characteristic | No. (%) |
|---|---|
| Employment status | |
| Full-time, permanent | 4,052 (88.3) |
| Part-time | 342 (7.5) |
| Full-time, temporary/contract | 83 (1.8) |
| Per diem | 57 (1.2) |
| Pro re nata (PRN), on call, as needed | 56 (1.2) |
| Pay structure | |
| Shift, hourly, or other time-based payment | 3,387 (73.7) |
| Salary | 1,159 (25.2) |
| Contractor | 35 (0.8) |
| Other | 9 (0.2) |
| Commission-based (eg, share of practice billings or workload) | 4 (0.1) |
| Average hours worked per week, mean (SD) | 40.7 (±9.4) |
Job Satisfaction
Indicators of job satisfaction include the respondents’ overall rating of how satisfied they are, ratings of how much they enjoy their work, their sense of meaning and engagement, and their perceptions of the adequacy of their compensation. Overall, most (62.7%) respondents indicated that they are somewhat satisfied to very satisfied with their current job in the laboratory (somewhat to very dissatisfied, 37.2%; not sure/don’t know, 0.1%). According to respondents, being part of a union/collective bargaining unit and having negotiated job contract neither detracts nor adds to job satisfaction, but having a merit-based wage adjustment and having a cost-of-living wage adjustment adds to job satisfaction (a little to a lot) Figure 1. Over half (59.1%) reported that they disagree to strongly disagree with the statement, “I am adequately compensated for the work that I do” (agree to strongly agree, 39.7%; not sure/don’t know, 1.2%). When asked how well their job responsibilities/duties align with their job title, 68.3% reported that it is moderately to very well aligned.
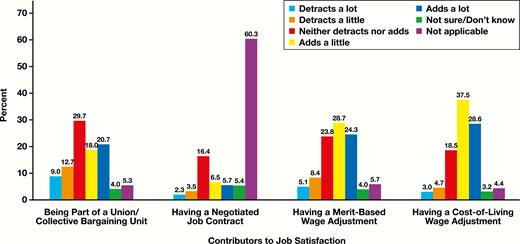
Contributors to job satisfaction.
Approximately two-thirds of the respondents agree that their professional values are well aligned with those of their department leaders and those of their institution/organization. Most agree to strongly agree they feel they have produced worthwhile accomplishments on their job (87.5%); enjoy their work as a laboratory professional (85.5%); feel valued by their colleagues (70.8%); feel empowered to make work-related decisions (67.2%); and generally feel energetic at work (62.5%). However, less than half agree to strongly agree that they feel valued by professionals outside their team (49.8%) and feel respected in the field of pathology (47.2%).
Over half disagree to strongly disagree that they feel just as excited about being a laboratory professional as they did when they started their career (53.3%) and also disagree that they feel appreciated by their institution (57.1%) Figure 2. Follow-up analysis indicated a significant positive correlation between level of agreement with feeling excited about being a laboratory professional and level of job satisfaction, with higher rating of feeling excited associated with higher level of job satisfaction (rs = 0.5, n = 4,190, P < .001). Level of job satisfaction was also found to have a significant positive correlation with level of agreement with feeling appreciated by their institution (rs = 0.5, n = 4,190, P < .001) and level of agreement with feeling empowered to make work-related decisions (rs = 0.5, n = 4,190, P < .001).
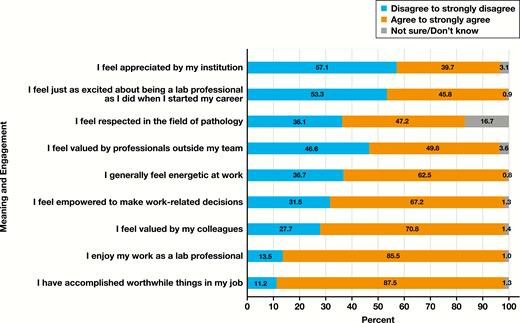
Percentage of laboratory professionals by their level of agreement to the statements regarding meaning and engagement.
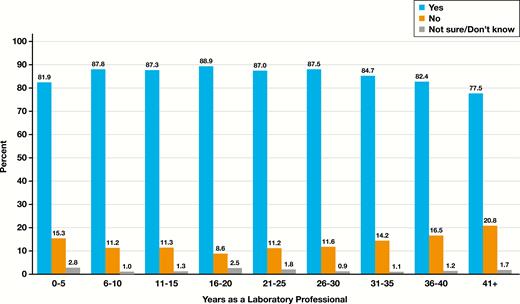
By occupational title, performance improvement/quality assurance personnel have the highest job satisfaction at 73.8% while phlebotomists have the lowest at 53.8% Figure 3. (Data on job satisfaction by occupational title, employment status, facility, department, and region can be found in the Supplemental Figures and Tables; all supplemental materials can be found at American Journal of Clinical Pathology online). Respondents aged 45 to 54 years and 65 to 74 years reported the highest job satisfaction (66.2% and 66.0%, respectively) and those aged 35 to 44 years reported the lowest job satisfaction (59.1%) Figure 4, with the differences in job satisfaction by age group being statistically significant (χ 2 [df = 15, n = 4,151] = 45.1; P < .001). Laboratory professionals who have been working for 41 years or more reported having the highest rate of job satisfaction compared to other groups surveyed Figure 5; however, follow-up analysis showed that the differences in job satisfaction by years as laboratory professional are not statistically significant (χ 2 [df = 24, n = 3,740] = 35.6; P > .05). A gender comparison of job satisfaction showed statistically significant difference, with women reporting more satisfaction with their current job in the laboratory than men (men, somewhat to very satisfied, 58.0%, and somewhat to very dissatisfied, 41.7%; women, somewhat to very satisfied, 63.6%, and somewhat to very dissatisfied, 36.3%; χ 2 [df = 3, n = 4,207] = 10.6; P < .05).
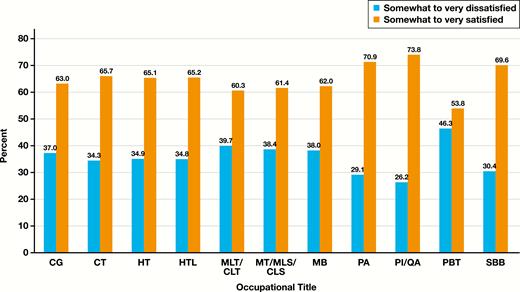
Level of satisfaction with current job in the laboratory by occupational title. CG, cytogenetic technologist; CLA, clinical laboratory assistant; CLS, clinical laboratory scientist; CLT, clinical laboratory technician; CT, cytotechnologist; HT, histotechnician; HTL, histotechnologist; LIS, laboratory information system personnel; MB, molecular biologist; MLA, medical laboratory assistant; MLS, medical laboratory scientist; MLT, medical laboratory technician; MT, medical technologist; PA, pathologists’ assistant; PBT, phlebotomist; PI, performance improvement; POCT, point-of-care testing personnel; QA, quality assurance; SBB, specialist in blood banking.
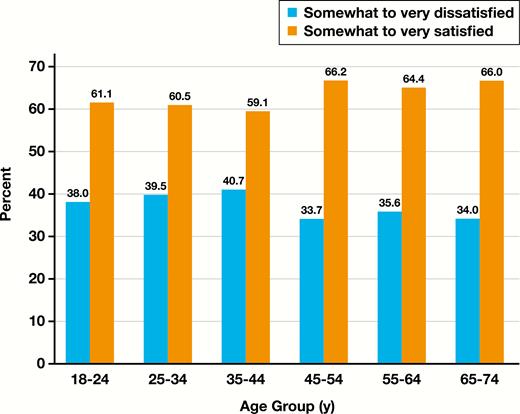
Job satisfaction among laboratory professionals by age group.
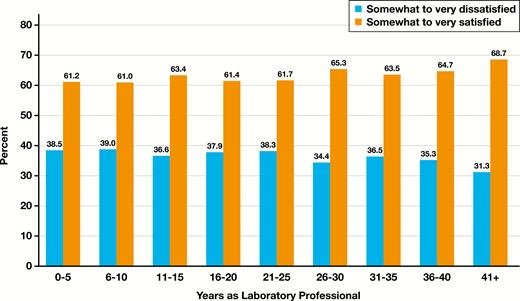
Job satisfaction by total number of years as a laboratory professional.
When asked what is the most rewarding aspect of their job as a laboratory professional, over half (53.3%) indicated that it is knowing that they play a crucial part in patient health care (ie, contributing to the diagnosis and treatment of the patient). Other top four rewarding aspects shared by the respondents included: working as part of an interdisciplinary team (12.8%), being able to deliver high quality and high quantity results in a timely manner (6.3%), having the opportunity to mentor and teach other laboratory professionals (5.9%), and making positive changes that improve the laboratory (3.1%).
The majority of respondents (86.5%) agree that their workplace has adequate compliance to safety practices. Approximately 17% reported that they witnessed or experienced sexual harassment in their program or institution. Of those, 50.7% thought that their program didn’t handle the situation appropriately. Approximately 24% of respondents reported having witnessed or experienced age discrimination in their program or institution, 69.5% of whom thought that their program didn’t handle the situation appropriately.
Job Stress
Most respondents (53.4%) reported feeling a lot of stress (a little bit of stress, 42.7%; no stress at all, 3.8%; not sure/don’t know, 0.1%). Over half of these individuals reported that it was mainly due to workload or call duties (74.6%), followed by working with colleagues (45.1%). In addition to their role as a laboratory professional, the top three responsibilities respondents are also involved in include education/training (57.8%), clerical work (42.7%), and administrative work (37.4%). Respondents were asked about the extent to which they feel overwhelmed by their workload. Many respondents reported feeling overwhelmed (varying degrees) by their workload (slightly overwhelmed, 37.6%; moderately overwhelmed, 29.5%; and very overwhelmed, 17.9%). Only 14.7% reported not feeling overwhelmed and 0.3% were not sure/didn’t know. The top reasons respondents feel overwhelmed by their workload are: understaffing (74.9%), quantity of workload (eg, number of tasks/cases) (73.4%), additional responsibilities (59.0%), uneven distribution of workload (47.6%), and documentation (29.1%).
Respondents rated the adequacy of time their job allowed for different types of tasks in the laboratory Figure 6. Most indicated that their jobs provide them with adequate time to perform these tasks, with continuing education and training others rated lowest in adequate time allowed Figure 6. More than half of the respondents reported having little control (55.3%) or no control (21.2%) over their work schedule (a lot of control, 23.0%; not sure/don’t know, 0.4%). When asked how often their work schedule encroaches on their personal time, the most common response (53.1%) was that this sometimes occurred (often, 37.1%; never, 8.2%; not sure/don’t know, 0.9%; and other, 0.8%).
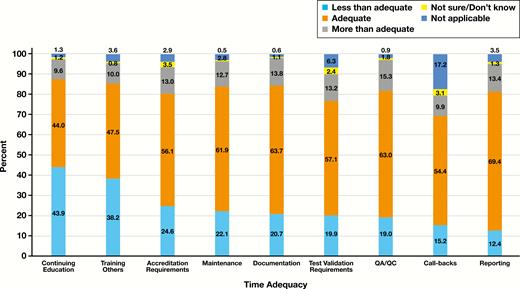
Adequacy of time that the laboratory professional’s job allows for each type of tasks.
The survey also asked the respondents to rate how anxious or worried they are about their work. Overall, 13.8% of respondents reported feeling very anxious, 24.8% moderately anxious, 37.7% slightly anxious, and 23.0% were not anxious at all. Furthermore, there was a significant correlation between the respondents’ ratings for job stress and feeling anxious about their work; higher ratings of job stress was associated with higher ratings of anxiety about work (rs = 0.5, n = 4,122, P < .001). When asked the question, “How isolated or connected do you feel to your colleagues in your role as a laboratory professional?” the majority of respondents (44.8%) reported feeling somewhat connected to their colleagues (very connected to colleagues, 26.3%; somewhat isolated or alone, 20.9%; very isolated or alone, 7.0%; not sure/don’t know, 1.0%). Follow-up analyses showed a higher percentage of respondents identified working with their colleagues as one of the main sources of stress among those who feel somewhat or very isolated, as opposed to feeling connected with the differences being significant (54.3% vs 34.9%; χ 2 [df = 3, n = 4,213] = 268.3; P < .001).
By occupational title, most respondents, except for cytotechnologists, histotechnicians, performance improvement/quality assurance, and pathologists’ assistants, experience a lot of stress due to their job Figure 7. Data on job stress by occupational title, employment status, facility, department, and region can be found in the Supplemental Figures and Tables. By age, those who reported the highest levels of stress are in the 35 to 44, 45 to 54, and 55 to 64 year age groups Figure 8 with the differences in age groups not being statistically significant (χ 2 [df = 10, n = 4,060] = 10.8; P > .05). Respondents who reported the highest stress are those who have worked as a laboratory professional for 21 to 25 years Figure 9 although follow-up analysis showed that there is no statistically significant difference between the groups (χ 2 [df = 16, n = 3,690] = 23.4; P > .05). Men reported feeling less stress than women (men: no stress, 5.9%, a little bit of stress, 44.4%, a lot of stress, 49.7%; women: no stress, 3.4%, a little bit of stress, 42.5%, a lot of stress, 54.0%), with the difference in job stress by gender being statistically significant (χ 2 [df = 2, n = 4,117] = 11.2; P < .01).
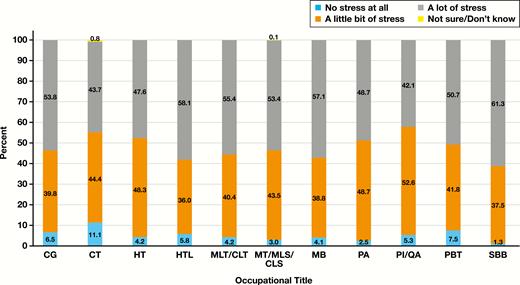
Job stress among laboratory professionals by occupational title. CG, cytogenetic technologist; CLA, clinical laboratory assistant; CLS, clinical laboratory scientist; CLT, clinical laboratory technician; CT, cytotechnologist; HT, histotechnician; HTL, histotechnologist; LIS, laboratory information system personnel; MB, molecular biologist; MLA, medical laboratory assistant; MLS, medical laboratory scientist; MLT, medical laboratory technician; MT, medical technologist; PA, pathologists’ assistant; PBT, phlebotomist; PI, performance improvement; POCT, point-of-care testing personnel; QA, quality assurance; SBB, specialist in blood banking.
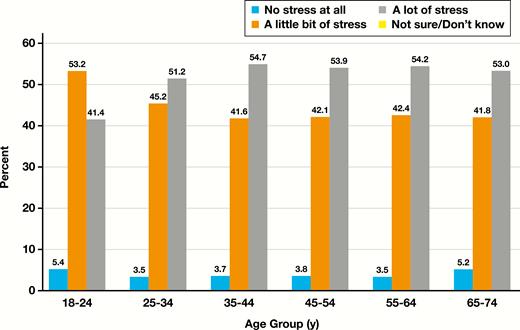
Job stress among laboratory professionals by age group.
Job stress by total number of years as a laboratory professional.
Burnout
Overall, 85.3% of respondents reported having felt burnout as a laboratory professional, 12.9% never experienced burnout, and 1.9% were not sure/didn’t know.
About half of all laboratory personnel that felt burnout reported this as a current issue (49.9%). These individuals also considered making the following changes : changing careers completely (44.4%), getting a similar position in a different clinical laboratory (40.0%), employment in a related field (33.4%), retiring (24.9%), and none of the above (9.5%). Respondents indicated that they felt these changes would mainly offer better wages (58.9%), better job benefits (43.5%), better location (28.9%), better work-life balance (job satisfaction, less stress, flexible schedule, more respect) (27.1%), better work environment (14.1%), and other (10.6%). A comparison between levels of job stress and present burnout showed a statistically significant association between higher levels of job stress and presently experiencing burnout. While 78.3% of the respondents who were feeling a lot of job stress were also experiencing burnout, only 26% of those who were a little bit or not stressed out at all were also feeling burnout presently (χ 2 [df = 2, n = 3,824] = 1,070.6; P < .001).
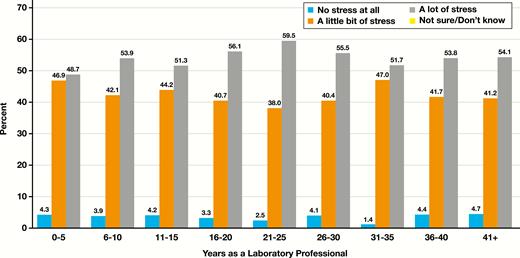
By occupational title, the respondents who reported the most burnout were molecular biologists at 91.8% and the least burnout were phlebotomists at 70.1% Figure 10. Those who reported having felt burnout as a laboratory professional were highest among those between the ages 35 and 44 years and lowest for those between the ages 65 and 74 years Figure 11, with the difference in having felt burnout by age group being statistically significant (χ 2 [df = 5, n = 4,052] = 47.4; P < .001). Respondents who have been working as a laboratory professional between 6 and 30 years have comparable burnout rates, between 87% and 88%. Those who have been working as a laboratory professional for more than 41 years have the lowest rate of burnout (77.5%) Figure 12, with the differences in burnout between the groups being statistically significant (χ 2 [df = 8, n = 3,684] = 27.1; P < .01). There were almost equal rates of burnout (past and present) for male and female laboratory professionals Figure 13 and this did not show any statistically significant differences after follow-up analysis (χ 2 [df = 1, n = 4,111] = 0.6; P > .05; χ 2 [df = 1, n = 3,863] = 0.2; P > .05, respectively).
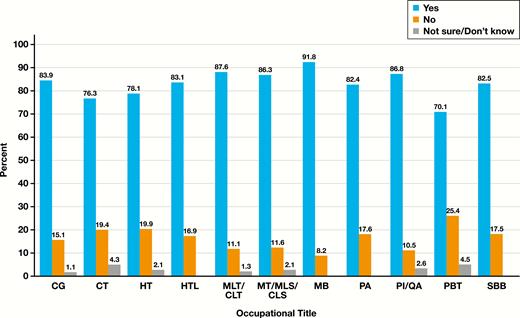
Percentage of respondents who had experienced burnout by occupational title. CG, cytogenetic technologist; CLA, clinical laboratory assistant; CLS, clinical laboratory scientist; CLT, clinical laboratory technician; CT, cytotechnologist; HT, histotechnician; HTL, histotechnologist; LIS, laboratory information system personnel; MB, molecular biologist; MLA, medical laboratory assistant; MLS, medical laboratory scientist; MLT, medical laboratory technician; MT, medical technologist; PA, pathologists’ assistant; PBT, phlebotomist; PI, performance improvement; POCT, point-of-care testing personnel; QA, quality assurance; SBB, specialist in blood banking.
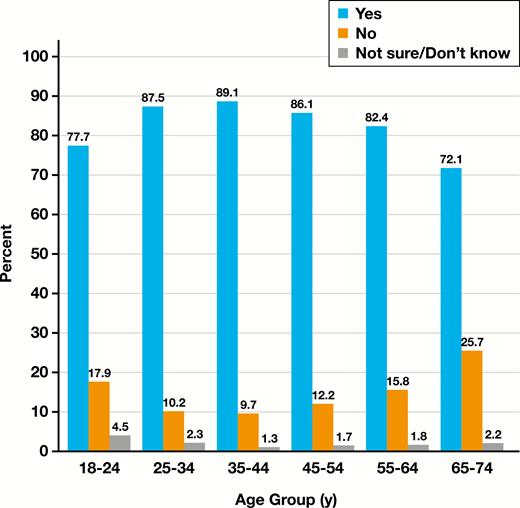
Percentage of respondents who had experienced burnout by age group.
Percentage of respondents who had experienced burnout by total number of years working as a laboratory professional.
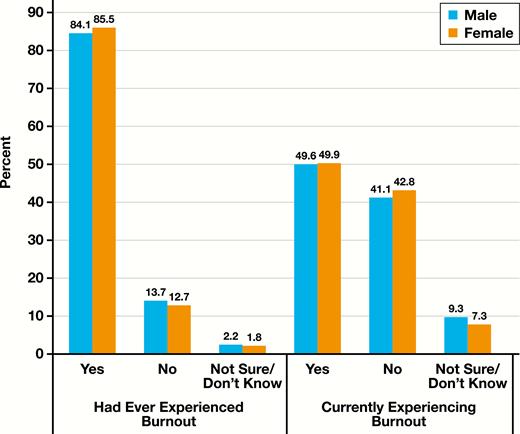
Percentage of respondents who had experienced or were currently experiencing burnout by gender.
Qualitative analysis (based on the 3,144 comments on the question, “What are (or were) the main issues contributing to your burnout?”) revealed that the top five issues that contribute to the burnout of laboratory professionals are: lack of adequate staffing (36.5%), heavy workload and pressure to complete all testing (31.5%), lack of understanding and support from management (16.3%), lack of control over schedule (15.1%), and lack of appreciation/recognition/respect (14.9%). Furthermore, there was a significant association between feeling overwhelmed by workload and experiencing burnout, with 77.8% of those who are moderately or very overwhelmed by workload reported presently experiencing burnout, as opposed to 31% of those who are slightly or not at all overwhelmed by workload, (χ 2 [df = 3, n = 3,878] = 957.7; P < .001). A significantly higher percentage of respondents (80.3%) who identified understaffing as a reason for being overwhelmed by workload are presently experiencing burnout, compared to those who did not report understaffing (69.8%; χ 2 [df = 1, n = 1,908] = 21.8; P < .001).
The survey also asked respondents what ASCP can do to minimize the issues leading to burnout. Most indicated advocating for higher salaries/fair wages (18.1%), followed by raising awareness of the profession outside the field (9.7%), and promoting important role/value of laboratory professionals in clinical settings to hospital management (8.3%).
General Well-Being (Work-Life Balance and Support Resources)
Most of the respondents (39.0%) rated the quality of their work-life balance as fair (excellent, 6.7%; good, 34.2%; poor, 19.5%; and not sure/don’t know, 0.7%). A comparison of prevalence of present burnout and quality of work-life balance showed that those who reported poor or fair work-life balance had a significantly higher percentage of presently experiencing burnout, as opposed to those who had good or excellent work-life balance (69.9% vs 29%; χ 2 [df = 3, n = 3,431] = 683.4; P < .001). Most (29.5%) also engage in hobbies, recreational activities, or personal interests outside of their role as a laboratory professional once or twice a month (once or twice a week, 22.0%; three to four times a month, 19.1%; three to four times a week, 13.3%; almost every day, 11.2%; and never, 4.0%). The top five strategies for those who reported that they have good or excellent work-life balance are: not bringing work home (24.7%), exercising (18.8%), pursuing hobbies and other personal interests (17.1%), spending time with family (14.8%), and going home on time (14.3%). There was a positive correlation between frequency of activities and quality of work-life balance (rs = 0.5, n = 3,764, P < .001), with higher rates of good or excellent work-life balance among those who engaged in activities more often. Those who reported engaging in hobbies, recreational activities, or personal interests outside of their work for less than once or twice a week indicated they had a lack of energy (72.8%), which was the main factor that prevented them from engaging in active pursuits, followed by workload or call duties (46.6%), family obligations (40.8%), burnout (40%), financial obligations (36.2%), and studying (7.7%).
By occupational title, the majority of respondents rated their work-life balance as fair, except cytotechnologists and histotechnicians who rated theirs as good, and cytogenetic technologists and molecular biologists who rated theirs as fair and good equally Figure 14. The majority of the respondents by age group reported having a fair work-life balance, except those aged 45 to 54 years and 65 to 74 years, who reported having a good work-life balance Figure 15; follow-up analysis showed that the differences in age groups are statistically significant (χ 2 [df = 15, n = 3,723] = 41.9; P < .001). In analyzing the work-life balance by total years of working as a laboratory professional, most reported having a fair work-life balance, except those who have been working in the field for 31 to 35 years and 36 to 40 years who reported having a good work-life balance Figure 16, the differences between the groups being statistically significant (χ 2 [df = 24, n = 3,376] = 45.1; P < .01). Women rated their work-life balance slightly higher than men (men: poor, 24.2%; fair, 36.1%; good, 31.0%; excellent, 7.2%; women: poor, 18.6%; fair, 39.5%; good, 34.8%; excellent, 6.5%), showing a statistically significant difference in gender after further analysis (χ 2 [df = 3, n = 3,768] = 12.1; P < .01).
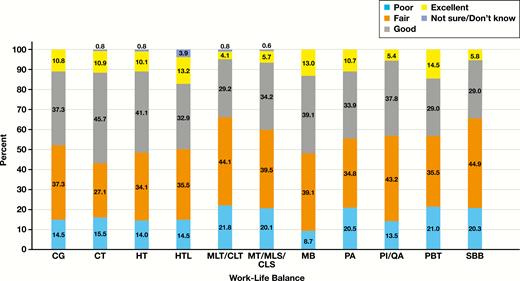
Percentage of respondents by work-life balance quality and occupational title. CG, cytogenetic technologist; CLA, clinical laboratory assistant; CLS, clinical laboratory scientist; CLT, clinical laboratory technician; CT, cytotechnologist; HT, histotechnician; HTL, histotechnologist; LIS, laboratory information system personnel; MB, molecular biologist; MLA, medical laboratory assistant; MLS, medical laboratory scientist; MLT, medical laboratory technician; MT, medical technologist; PA, pathologists’ assistant; PBT, phlebotomist; PI, performance improvement; POCT, point-of-care testing personnel; QA, quality assurance; SBB, specialist in blood banking.
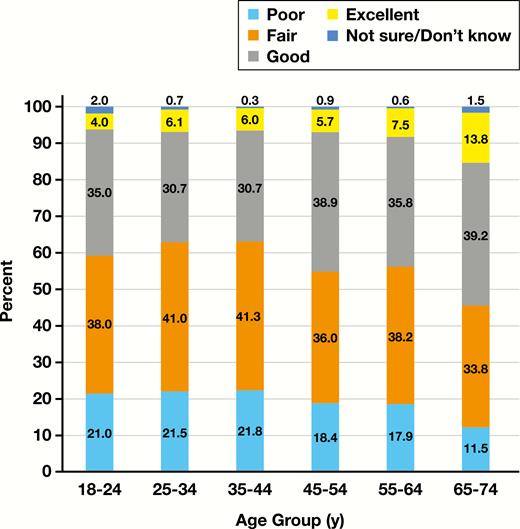
Percentage of respondents by work-life balance quality and age group.
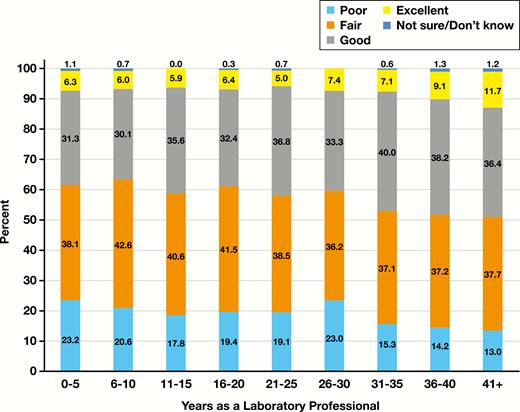
Percentage of respondents by work-life balance quality and total number of years working as a laboratory professional.
The survey asked questions about whether the respondents have experienced an emotional toll as a result of their job in the laboratory. While most respondents disagree that they have become more callous toward people since taking a job in the laboratory (52.4%), many agree that their job in the laboratory is hardening them emotionally (35.9%). More than half of the respondents also reported that they only sometimes have to deal with emotional problems at work (56.9%). A higher percentage of respondents who agree their job is hardening them emotionally reported presently experiencing burnout compared to those who disagree (73.8% vs 32.6%; χ 2 [df = 3, n = 3,768] = 709.9; P < .001).
When asked what type of resources are provided by their institutions to promote work-life balance or mental/emotional well-being, respondents reported that they are most often offered: wellness programs (47.3%), resources to promote physical wellness (27.5%), resources to promote mental or emotional well-being (24.1%), resources to combat substance abuse (18.5%), resources to address depression (16.7%), and resources to promote time management (10.5%). Fewer respondents reported the presence of resources on parenting/caregiving (9.9%) (more in-depth information on laboratory professional’s caregiver roles is in the Supplemental Material), recreational/recharge activities (9.1%), resources to address burnout (7.7%), peer support programs (5.3%), and mentorship program or resources for mentoring (3.6%). Of all the respondents, 13.2% reported that they do not have any wellness resources, while 14.7% do not know. Follow-up analyses showed a higher rate of present burnout among those who reported that their institution does not offer any resources compared to those who reported being offered one or more resources to promote well-being, with the difference being statistically significant (67.8% vs 47.7%; χ 2 [df = 1, n = 2,776] = 71.4; P < .001). Similarly, a higher percentage of laboratory professionals who were not offered any resources by their institutions rated their work-life balance poor or fair vs those who were offered some type of resource, with the difference being statistically significant (69.2% vs 54.6%; χ 2 [df = 3, n = 3,033] = 78.0; P < .001). Respondents who indicated that their institutions offered wellness programs (the most offered resource) have a lower present burnout rate than those who did not, the difference being statistically significant (46.4% vs 64.6%; χ 2 [df = 1, n = 2,776] = 75.8; P < .001).
Most laboratory professionals who responded to this survey rely on the following as their primary source of social support when they encounter a personal issue(s): family (66.8%), friends (52.1%), other laboratory colleagues (25.6%), other laboratory professionals (16.1%), mental health professionals (8.6%), mentor (4.0%), and faith-based activities (1.3%). The largest number of respondents (48.0%) also reported that they do not perceive (or have perceived) any stigma or negative consequences from their program/institution for seeking help for a personal issue (yes, 12.1%; not sure/don’t know, 17.1%; not applicable, 22.8%).
Discussion
While job satisfaction is high and well-being is rated fair to good by most respondents, feelings of anxiety or worry about work, high levels of stress, and burnout is prevalent among laboratory professionals. Among the contributing factors covered in the survey, the top contributor to job stress, burnout, and work-life balance are lack of adequate staffing and workload. Overall, job satisfaction is high among respondents from somewhat to very satisfied. Over half (59.1%), however, indicate that they are not being adequately compensated for the work that they do. There was a significant positive correlation between level of job satisfaction and level of agreement with feeling just as excited about being a laboratory professional as they did when they started their career, feeling empowered to make work-related decisions, and feeling appreciated by their institutions. From the follow-up analyses, there are statistically significant differences in job satisfaction of laboratory professionals by age group and gender.
Overall job stress is high among respondents, with 96.1% reporting a little bit to a lot of stress. Feelings of being overwhelmed vary from slightly to moderately overwhelmed due to understaffing and quantity of workload (eg, number of tasks/cases). Coupled with their role as laboratory professionals, they are also tasked to perform education/training, clerical, and administrative work, which could contribute to their workload. Many rated continuing education and training others lowest in adequate time allowed. Over half reported that they have little or no control over their work schedule and their work schedule encroaches on their personal time. Working with their colleagues is one of the main sources of stress more commonly found among those who feel somewhat or very isolated, as opposed to feeling connected. From the follow-up analyses, there is a statistically significant difference in job stress of laboratory professionals by gender.
In addition to high levels of job stress, burnout was also reported to be highly prevalent among respondents (85.3%). Those currently experiencing burnout considered changing careers completely to seek better wages and quality of life. Similar to job stress, the top contributors to burnout are lack of adequate staffing and heavy workload/pressure to complete all testing. Results show a higher rate of presently experiencing burnout among those who are feeling moderately or extremely overwhelmed by their workload vs those who are slightly or not at all overwhelmed. Furthermore, those who identified understaffing as a reason for being overwhelmed by workload have higher present burnout rates than those who did not. From the follow-up analyses, there are statistically significant differences in burnout of laboratory professionals by age group and years working in the laboratory. Further, an examination of job stress and burnout among laboratory professionals working in urban, urban clusters, and rural locations also showed that stress is being reported in all geographic areas.15 As a result of burnout, many laboratory professionals working in rural areas considered changing careers completely.15
Overall, the majority of respondents reported having a fair work-life balance. Those who reported poor or fair work-life balance have higher present burnout rates than those who reported good or excellent work-life balance. Strategies of those who reported having good or excellent work-life balance include not taking work home, engaging in physical activities, and having a strong social support. Those who seldom or never engage in activities report lack of energy, workload or call duties, and burnout as the factors that hinder them from pursuing activities. Frequency of engaging in activities was positively correlated with higher rating of work-life balance. From the follow-up analyses, there are statistically significant differences in work-life balance of laboratory professionals by age group, years in professional role, and gender.
Survey respondents indicated that resources to promote work-life balance or mental/emotional well-being are offered or provided by many institutions, with wellness programs being the most common offering (47.3%). Data show that those who are not offered any well-being resources from their institutions have higher present burnout rates and lower ratings of work-life balance, compared to those who are offered one or more well-being resources. Furthermore, respondents who indicated that their institutions offer wellness programs (most offer well-being resource) have a lower present burnout rate than those who did not. While the results of this survey show that institutions implement stress reduction and well-being initiatives, it remains unclear how institutions “developed their plans for selecting a particular intervention and who was engaged in developing the intervention.” 16,17 Whereas wellness programs promote well-being, they don’t address other critical issues laboratory professionals may encounter in the laboratory.
When asked to specify other source(s) of stress, the most common feedbacks from respondents were administration/management’s lack of understanding on the needs of the laboratory and their lack of open communication. Data suggest that there is a need for bridging the gap between administration and laboratory professionals, especially on the laboratory requirements and processes and the role of laboratory professionals in clinical settings. Data support that developing a comprehensive wellness program that addresses not only the physical and mental wellness but also emotional well-being of laboratory professionals must originate and be developed at the institution level. Creating targeted interventions based on the results of this survey may help improve the type and quality of wellness programs for laboratory professionals.
Results show that, overall, laboratory professionals agree that they enjoy their work as laboratory professionals and they feel that they have accomplished worthwhile things in their career. However, they also indicated that they do not feel appreciated by their institutions. If the field aims to address the need for more graduates from accredited laboratory training programs to fill the high vacancies left by retirement (ie, the next generation of laboratory personnel)11,12 and address retention issues, a focus on the laboratory professional’s well-being is key. Furthermore, examination of laboratory professionals who have better job satisfaction and lower stress and burnout might offer insight into how to develop targeted interventions. Stress and burnout impact the health care field from education to practice. Ignoring these factors will have a negative impact on health care professionals, including laboratory professionals, and, ultimately, on patient care.16
Future Directions
Although this survey collected data from a large number of laboratory professionals across the nation, it may not be possible to generalize the findings to every occupational role in the profession. The profession is quite diverse and the sample size of those surveyed was relatively small for some occupational groups. Results from this survey will help the ASCP improve on the survey questionnaire for future job satisfaction, well-being, and burnout surveys. A separate study on job satisfaction by age group and gender, job stress and gender, and burnout by age group and years working as a laboratory professional in the field may be an added resource to this report, and will be considered in the future. Data collected from this survey will also be used to perform multivariate analyses to determine independent predictors or confounders, to be published and shared with the field.
Another topic worth exploring for the field is the study on faculty vitality conducted by Pololi et al.18 They indicate that while satisfaction and vitality are somewhat similar, it might also be beneficial to examine how to enhance the energy, creativity, and resourcefulness of personnel.18 They conclude that leaders who wish to enhance their staff vitality should invest in activities that encourage trust between colleagues and align staff’s personal values with institutional values. Perhaps this is another area we need to explore to gain an overall picture of the well-being of laboratory professionals in the field and impact change at the facility level.
Resources
There are a number of resources available to help people with stress and burnout. The key is to find things that work at the individual level and taking time to learn about and try different things. This section provides a number of different resources as a starting point.
Gaining insights into one’s stress levels and areas of stress is an incredibly helpful tool. There are a number of different assessments online but it is necessary to ensure that any instrument used is validated. One assessment that is validated and free is the Perceived Stress Scale.19 Organizations such the American Institute of Stress,20 a nonprofit organization, provides resources about stress and coping mechanisms.
Another way to learn more about stress is through listening to TED Talks or podcasts. National Public Radio has a series on stress called “Stressed Out,” 21 in which they explore multiple topics related to stress management. TED has a playlist to help destress titled “Talks to Help You Manage Stress.” 22
Finally, ASCP has a number of resources available to their members and professionals in the field of pathology and laboratory medicine. The ASCP Leadership Institute (LI) has a course called Stress Analysis and Coping Techniques that allows one to explore current levels, areas, and causes of stress. The course also provides multiple coping techniques to reduce stress and to prevent stress from leading to burnout. The LI also offers personal one-on-one coaching to help with specific challenges and issues. Other LI courses focus on increasing collaboration, communication, and understanding between coworkers, which can significantly reduce stress, both personally and professionally. The ASCP also has launched a Leadership Book Club, available to all ASCP members. Selected books provide additional insights and strategies to handle specific situations. The discussions can help participants through particular issues or challenges they are facing and provide laboratory managers guidance on how to support employees suffering from burnout and foster a positive work environment that promotes work-life balance.
There are resources on stress and burnout, available via ASCP’s website.23 Future initiatives include augmenting these resources and identifying ways to strengthen efforts to support laboratory professionals.
Reviewers and Contributors: Evelyn T. Bruner, MD, FASCP, Medical University of South Carolina, Charleston, SC; E. Susan Cease, MLS(ASCP)CM (reviewer), Asante Three Rivers Medical Center, Grants Pass, OR; Tiffany Channer, MPH, MLS(ASCP)CM, Memorial Sloan Kettering Cancer Center, New York, NY; Paul Chiou, MPH, SCT(ASCP)CM (reviewer), Rutgers University, Newark, NJ; Henry Lee, MT(ASCP) DLM, CPHQ, Huntington Reproductive Center, Pasadena, CA; Lesley C. Lomo, MD, University of Utah Health Sciences Center, Salt Lake City, UT; Sean McNair, MPH, CT(ASCP) (reviewer), Memorial Sloan Kettering Cancer Center, New York, NY; Junell Petersen, MS, MASCP, MLS(ASCP)CMSH (reviewer), Rice Memorial Hospital, Willmar, MN; Matthew Schulze (reviewer), ASCP Institute for Science, Technology and Public Policy, Washington, DC; S. Joseph Sirintrapun, MD, FASCP, FCAP, Memorial Sloan Kettering Cancer Center, New York, NY; Harold C. Sullivan, MD, Emory University School of Medicine, Atlanta, GA; Phyllis S. Walker, MS, MT(ASCP)SBB (reviewer); and Jennifer Susan Woo, MD, University of California Irvine, Irvine, CA.
