
Impact of Speeds on Drivers and Vehicles – Results from Crash Tests
This study examines how vehicle crashworthiness and occupant protection degrade as impact speeds increase. The results and implications in this report provide valuable information for those who advocate for safety considerations when setting maximum posted speed limits.
January 2021
Abstract
Introduction
Despite numerous studies reporting on the negative impacts of increased speeds on roadways, many states have steadily raised their posted speed limits. In response to these concerns, the AAA Foundation for Traffic Safety initiated a multi-phased study to investigate the effect of posted speed limit changes on safety. The first phase entailed gathering feedback from traffic engineers on how posted speed limits are set and what factors they consider in changing posted speed limits. The second phase, which this report details, involved a collaborative effort with the Insurance Institute for Highway Safety (IIHS) and Humanetics Innovative Solutions to examine how vehicle crashworthiness and occupant protection degrade as impact speeds increase. Towards this, three vehicle crash tests were conducted.
Key Findings
Overall, as the crash speed increased, the additional occupant compartment deformations and higher crash energy resulted in higher peak injury measures recorded by dummy sensors over the entire body region.
According to National Highway Traffic Safety Administration, the injury measures from the baseline test (Test 1 at crash impact speed of 40 mph) represent a 15% risk of serious or worse[1] overall injury. In contrast, the results from Test 2 (at crash impact speed of 50 mph) indicate a 59% risk, while the results from Test 3 (at crash imact speed of 55.9 mph) indicate a 78% risk of serious or worse overall injury.
1 A score of 3 or higher on the Abbreviated Injury Scale (AIS) (Associate for the Advancement of Automotive Medicine, 1990. The Abbreviated Injury Scale, 1990 Revision. Des Plaines, IL.)
Methodology
Following the IIHS test protocol, the crash tests were set up and executed between October 28 and 30, 2019. The following summarizes details of the tests:
- Test type: Tests were conducted at a moderate overlap frontal impact crash mode. In this mode, 40% of the maximum width of the test vehicle crashed into a deformable barrier on the driver side with the forces concentrated on the driver side of the vehicle. This test setup simulates a head-on, partial-overlap crash between two vehicles of the same weight and size travelling at the same speed.
- Crash speed: Tests were conducted at three different impact speeds—40 mph for the baseline test (Test 1) and 50 mph and 55.9 mph for two higher speeds (Test 2 and Test 3, respectively).
- Test vehicle: Three 2010 Honda CR-V EX vehicles were selected as they represented the average age of vehicles (11.8 years in 2019) on today’s U.S. roadways and earned the top rank in crash test ratings. All three had comparable specifications including manufacture date, vehicle mileage, and drive type.
- Barrier type: Test vehicles were crashed into a barrier face that was fixed and composed of aluminum honeycomb materials.
- Crash test dummy type: This study used a Hybrid III 50th percentile male dummy positioned in the driver seat to represent an average-sized male driver. The dummy in each test was instrumented to record measures from the head, neck, chest, thighs, and legs.
Results
As shown in the table below, using IIHS protocols, only the baseline test vehicle would earn a rating of good in the overall evaluation, which is derived from the ratings for the injury measures, structure, and restraints and kinematics components. Tests 2 and 3 would earn a poor overall score, with Test 2 results heavily influenced by the elevated head injury measure, and Test 3 by elevated injury measures to vital body regions and the heavily compromised occupant compartment.
Vehicle Crashworthiness and Occupant Protection Ratings based on IIHS Protocols
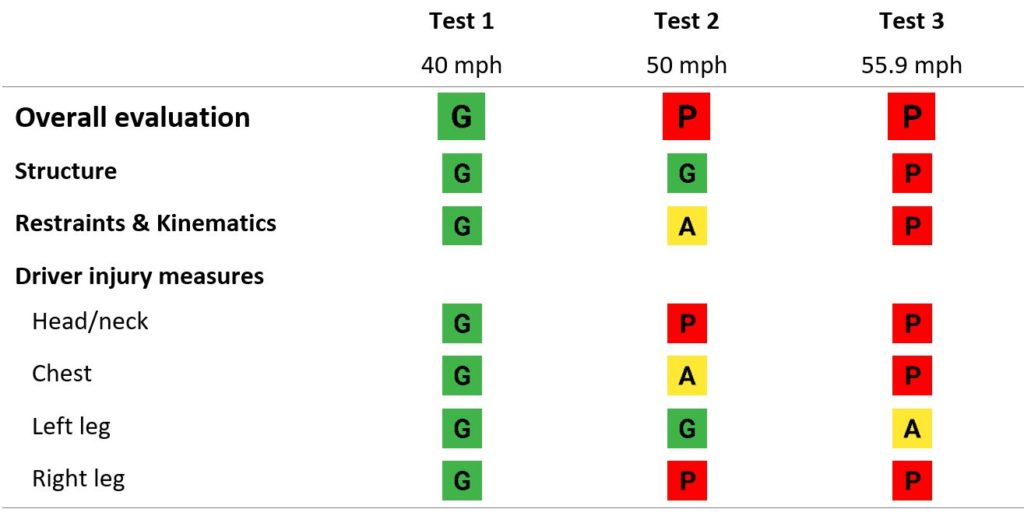
Note: The overall rating and each measurement for a vehicle’s crashworthiness can be good (G; the highest rating), acceptable (A), marginal (M), or poor (P; the lowest rating).
Suggested Citation