
Last year was a difficult time for recent college graduates. Those who graduated in the spring of 2020 found themselves job-hunting in the early stages of the COVID-19 pandemic when businesses across the country were forced to shut their doors. And among those businesses who didn’t have to close, many put the brakes on hiring. With the U.S. starting to round the corner of the pandemic, this year’s college graduates will face a very different job market. Unemployment rates are declining, vaccination rates are increasing, and businesses have a much brighter outlook for the future. Recent graduates will want to consider such factors as earning potential, local job market conditions, and the cost of living when they choose where to locate after the pandemic. According to data from the U.S. Census Bureau, in 2019 before the pandemic, median income for recent college graduates was $40,000, and the unemployment rate for this group was 3.4%.
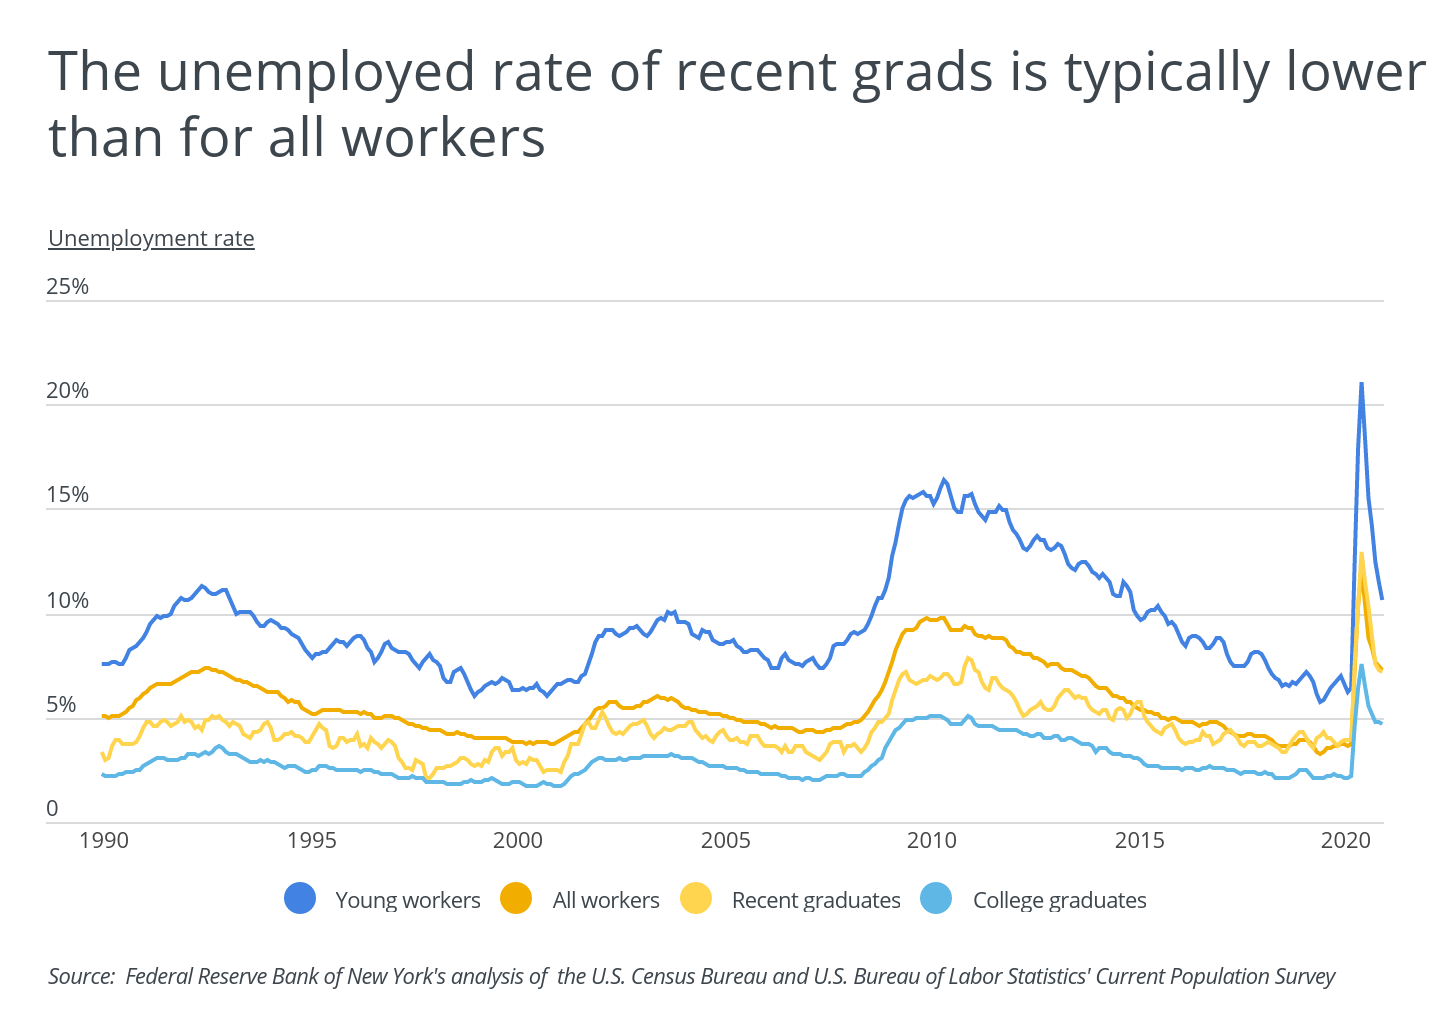
College degree holders often fare better in the job market during economic downturns than workers without a degree, but recent graduates at the beginning of their careers face unique challenges when job market conditions are tough. The unemployment rate for young workers aged 22 to 27 without a bachelor’s degree is typically at least several points higher than that of all workers (those aged 16 to 65), and the unemployment rate for recent college graduates (those aged 22 to 27) is usually lower. However, the unemployment rate for recent graduates surpassed that of all workers last year in the middle of the pandemic. While both rates have decreased from their high points, unemployment rates have still not returned to pre-pandemic levels.
Job market conditions vary across the country, and some places have been harder hit than others by the current recession. Recent college graduates will find it easier to find jobs in cities with historically robust job markets. Additionally, starting salaries and earning potential for college graduates vary on a geographic basis due to the local industry makeup, the supply and demand of skilled workers, and cost of living.
To find the best places to move after college, researchers at Porch analyzed data from the U.S. Census Bureau, the Department of Housing and Urban Development, and Bureau of Economic Analysis, creating a composite score based on the following pre-pandemic data:
- Median income for recent graduates
- Unemployment rate for recent graduates
- Number of employer firms per 1k residents
- Concentration of recent graduates compared to the national average
- Median 1-bedroom rent
- Cost of living compared to the national average
At the state level, the best states to move to after college are in the Midwest. According to their composite scores, North Dakota and Nebraska rank highest among all states, with scores of
88.8 and 88.6, respectively. In both of these states, median income for recent graduates was $40,000, equal to the national level, but cost of living is much lower. The unemployment rate among recent college graduates was very low in both North Dakota and Nebraska, at just 0.5% and 1.1%, respectively. In comparison, the national unemployment rate for recent graduates was 3.4% prior to COVID-19.

TRENDING
Replacing your conditioning can be expensive, but you have options. Read about a variety of AC systems, and learn how to save money on your next AC unit installation with Porch.
To find the best metropolitan areas in the U.S. for students to move after college, researchers at Porch applied the same methodology and ranked metro areas according to their composite score. To improve relevance, only metropolitan areas with at least 100,000 people were included in the analysis. Additionally, metro areas were grouped into the following cohorts based on population size:
- Small metros: 100,000–349,999
- Midsize metros: 350,000–999,999
- Large metros: 1,000,000 or more
Here are the best metros to move after college.
The Best Large Metros To Move After College

Photo Credit: Alamy Stock Photo
15. Columbus, OH
- Composite score: 79.4
- Median income for recent graduates: $40,000
- Unemployment rate for recent graduates: 3.5%
- Number of employer firms per 1k residents: 21.9
- Concentration of recent graduates (compared to average): +28.3%
- Median 1-bedroom rent: $886
- Cost of living (compared to average): -8.4%

Photo Credit: Alamy Stock Photo
14. Boston-Cambridge-Newton, MA-NH
- Composite score: 80.0
- Median income for recent graduates: $48,000
- Unemployment rate for recent graduates: 2.5%
- Number of employer firms per 1k residents: 27.6
- Concentration of recent graduates (compared to average): +92.9%
- Median 1-bedroom rent: $1,858
- Cost of living (compared to average): +15.5%
RELATED
Whether you live in an older home or a new construction, baseboards are an integral part of the finishing touches in every room. Porch makes it easy to plan and save on your next baseboard installation project.

Photo Credit: Alamy Stock Photo
13. Seattle-Tacoma-Bellevue, WA
- Composite score: 80.2
- Median income for recent graduates: $50,000
- Unemployment rate for recent graduates: 2.5%
- Number of employer firms per 1k residents: 27.6
- Concentration of recent graduates (compared to average): +61.9%
- Median 1-bedroom rent: $1,621
- Cost of living (compared to average): +14.5%

Photo Credit: Alamy Stock Photo
12. Indianapolis-Carmel-Anderson, IN
- Composite score: 80.4
- Median income for recent graduates: $40,000
- Unemployment rate for recent graduates: 4.3%
- Number of employer firms per 1k residents: 23.3
- Concentration of recent graduates (compared to average): +22.4%
- Median 1-bedroom rent: $831
- Cost of living (compared to average): -8.9%

Photo Credit: Alamy Stock Photo
11. Charlotte-Concord-Gastonia, NC-SC
- Composite score: 80.4
- Median income for recent graduates: $40,000
- Unemployment rate for recent graduates: 1.9%
- Number of employer firms per 1k residents: 23.9
- Concentration of recent graduates (compared to average): +26.1%
- Median 1-bedroom rent: $1,090
- Cost of living (compared to average): -5.6%

Photo Credit: Alamy Stock Photo
10. Milwaukee-Waukesha, WI
- Composite score: 81.2
- Median income for recent graduates: $40,000
- Unemployment rate for recent graduates: 2.4%
- Number of employer firms per 1k residents: 25.0
- Concentration of recent graduates (compared to average): +1.2%
- Median 1-bedroom rent: $853
- Cost of living (compared to average): -5.4%

Photo Credit: Alamy Stock Photo
9. Minneapolis-St. Paul-Bloomington, MN-WI
- Composite score: 81.8
- Median income for recent graduates: $44,000
- Unemployment rate for recent graduates: 2.1%
- Number of employer firms per 1k residents: 26.8
- Concentration of recent graduates (compared to average): +51.4%
- Median 1-bedroom rent: $1,136
- Cost of living (compared to average): +2.9%

Photo Credit: Alamy Stock Photo
8. Kansas City, MO-KS
- Composite score: 82.2
- Median income for recent graduates: $43,000
- Unemployment rate for recent graduates: 2.9%
- Number of employer firms per 1k residents: 24.4
- Concentration of recent graduates (compared to average): +15.6%
- Median 1-bedroom rent: $919
- Cost of living (compared to average): -7.2%

Photo Credit: Alamy Stock Photo
7. Buffalo-Cheektowaga, NY
- Composite score: 82.8
- Median income for recent graduates: $37,000
- Unemployment rate for recent graduates: 0.8%
- Number of employer firms per 1k residents: 24.9
- Concentration of recent graduates (compared to average): +6.0%
- Median 1-bedroom rent: $824
- Cost of living (compared to average): -5.5%

Photo Credit: Alamy Stock Photo
6. Louisville/Jefferson County, KY-IN
- Composite score: 83.0
- Median income for recent graduates: $36,000
- Unemployment rate for recent graduates: 1.3%
- Number of employer firms per 1k residents: 23.8
- Concentration of recent graduates (compared to average): +6.5%
- Median 1-bedroom rent: $810
- Cost of living (compared to average): -10.4%
Photo Credit: Alamy Stock Photo

5. Cincinnati, OH-KY-IN
- Composite score: 83.2
- Median income for recent graduates: $38,500
- Unemployment rate for recent graduates: 2.6%
- Number of employer firms per 1k residents: 22.1
- Concentration of recent graduates (compared to average): +21.0%
- Median 1-bedroom rent: $754
- Cost of living (compared to average): -9.4%
TRENDING
Is it time to upgrade your kitchen? Find out what it would cost to install kitchen cabinets and improve the resale value of your home.

Photo Credit: Alamy Stock Photo
4. Cleveland-Elyria, OH
- Composite score: 83.4
- Median income for recent graduates: $39,000
- Unemployment rate for recent graduates: 3.0%
- Number of employer firms per 1k residents: 25.2
- Concentration of recent graduates (compared to average): -12.1%
- Median 1-bedroom rent: $754
- Cost of living (compared to average): -10.1%

Photo Credit: Alamy Stock Photo
3. Omaha-Council Bluffs, NE-IA
- Composite score: 83.7
- Median income for recent graduates: $41,000
- Unemployment rate for recent graduates: 1.9%
- Number of employer firms per 1k residents: 23.5
- Concentration of recent graduates (compared to average): +15.4%
- Median 1-bedroom rent: $852
- Cost of living (compared to average): -8.3%

Photo Credit: Alamy Stock Photo
2. St. Louis, MO-IL
- Composite score: 86.0
- Median income for recent graduates: $40,000
- Unemployment rate for recent graduates: 1.8%
- Number of employer firms per 1k residents: 26.1
- Concentration of recent graduates (compared to average): -2.2%
- Median 1-bedroom rent: $783
- Cost of living (compared to average): -9.9%

Photo Credit: Alamy Stock Photo
1. Pittsburgh, PA
- Composite score: 88.2
- Median income for recent graduates: $41,600
- Unemployment rate for recent graduates: 1.9%
- Number of employer firms per 1k residents: 26.9
- Concentration of recent graduates (compared to average): +33.1%
- Median 1-bedroom rent: $839
- Cost of living (compared to average): -7.6%
Detailed Findings & Methodology
The best places to move after college are primarily more affordable cities in the Rust Belt and Midwest. These metros tend to have low costs of living and low unemployment rates for recent graduates. While median income for recent graduates is similar to the national level in these places, the low cost of living means that salaries go much further. Despite high costs of living, the Seattle and Boston metro areas also make the cut for the top 15 large metros due to high median incomes for recent graduates, low unemployment rates, and very high concentrations of graduates.
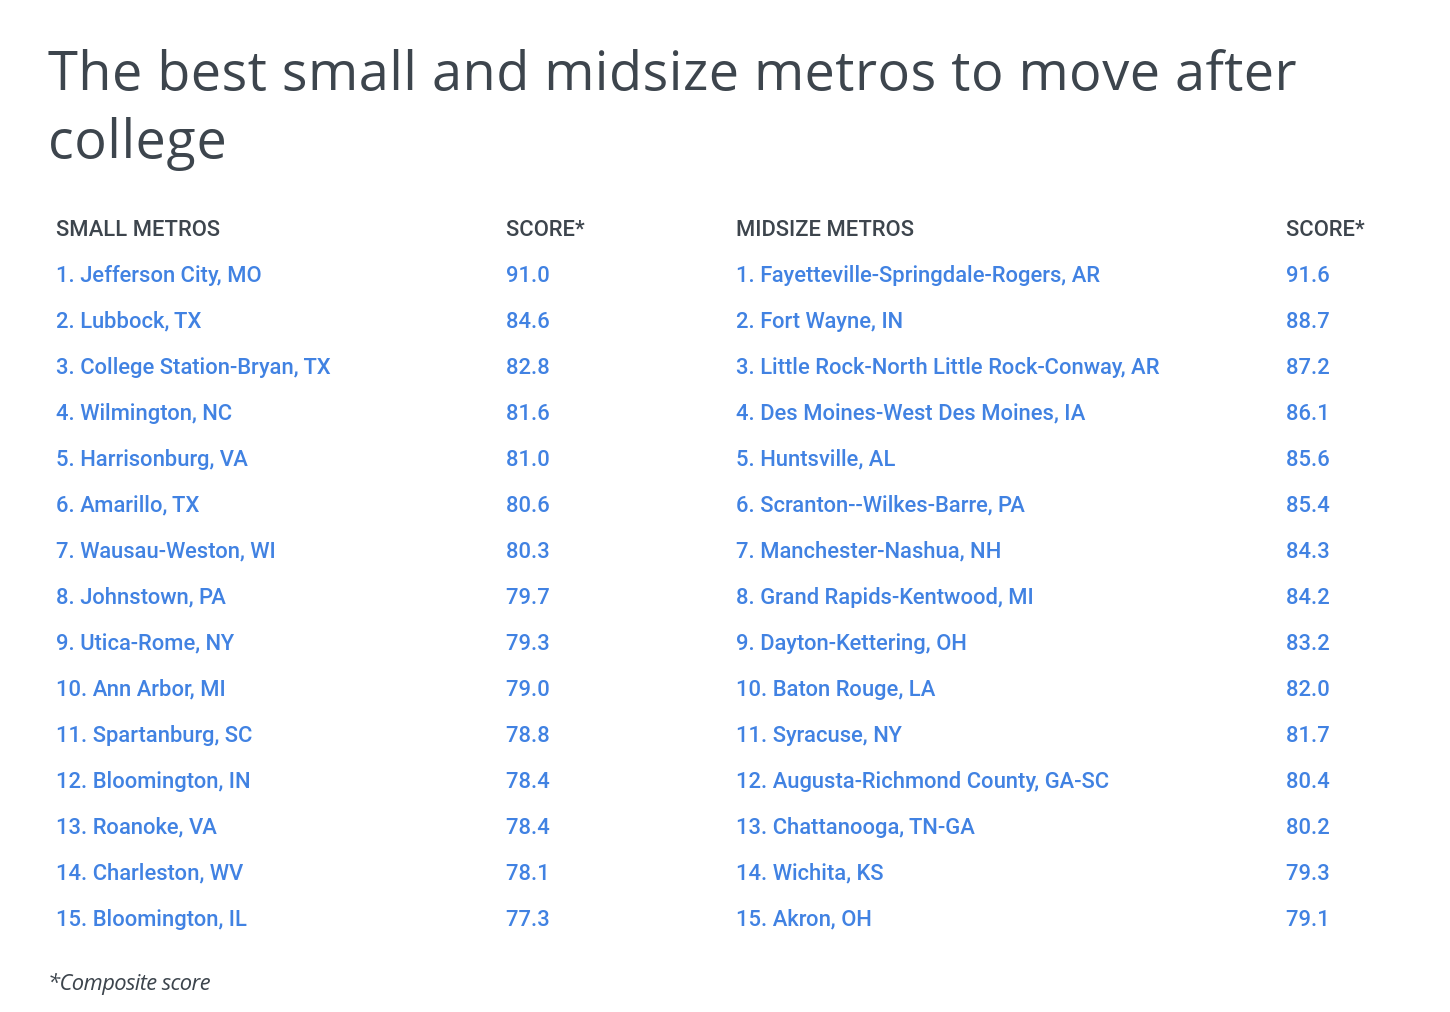
While many new college graduates are drawn to big cities, some small and midsize metros are also excellent options for this demographic. These metros tend to be very affordable, and many have a large number of employer firms per capita, giving young professionals plenty of employment opportunities.
To find the best places to move after college, researchers at Porch analyzed data from the U.S. Census Bureau’s 2019 American Community Survey Public Use Microdata Sample (PUMS) and 2018 County Business Patterns (CBP), the Department of Housing and Urban Development’s (HUD) 2021 50th Percentile Rent Estimates, and the Bureau of Economic Analysis’s 2019Regional Price Parities(RPP). The researchers created a composite score based on the following components (measured prior to the pandemic):
- Median income for recent graduates: the median total personal income for recent college graduates
- Unemployment rate for recent graduates: the number of unemployed recent graduates as a percentage of all recent graduates in the labor force
- Number of employer firms per 1k residents: number of business establishments with at least 1 employee per 1,000 residents
- Concentration of recent graduates (compared to average): population share of recent college graduates compared to the national share
- Median 1-bedroom rent: the median monthly price for a rental unit
- Cost of living: cost of living relative to the national average
Recent college graduates were defined as residents aged 22 to 27 with a bachelor’s degree or PhD, not currently in school. Median income for recent graduates, the unemployment rate for recent graduates, and the concentration of recent graduates were calculated from the PUMS data. The number of employer firms per 1k residents was sourced from the CBP data, and the median one-bedroom rent was derived from the HUD rent data.
Metro areas were ranked according to their composite score. In the event of a tie, the metro with the larger population share of recent graduates was ranked higher. Additionally, metros were grouped into the following cohorts based on population size:
- Small metros: 100,000–349,999
- Midsize metros: 350,000–999,999
- Large metros: 1,000,000 or more


